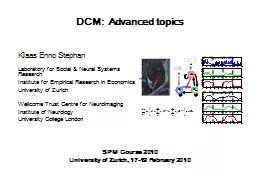
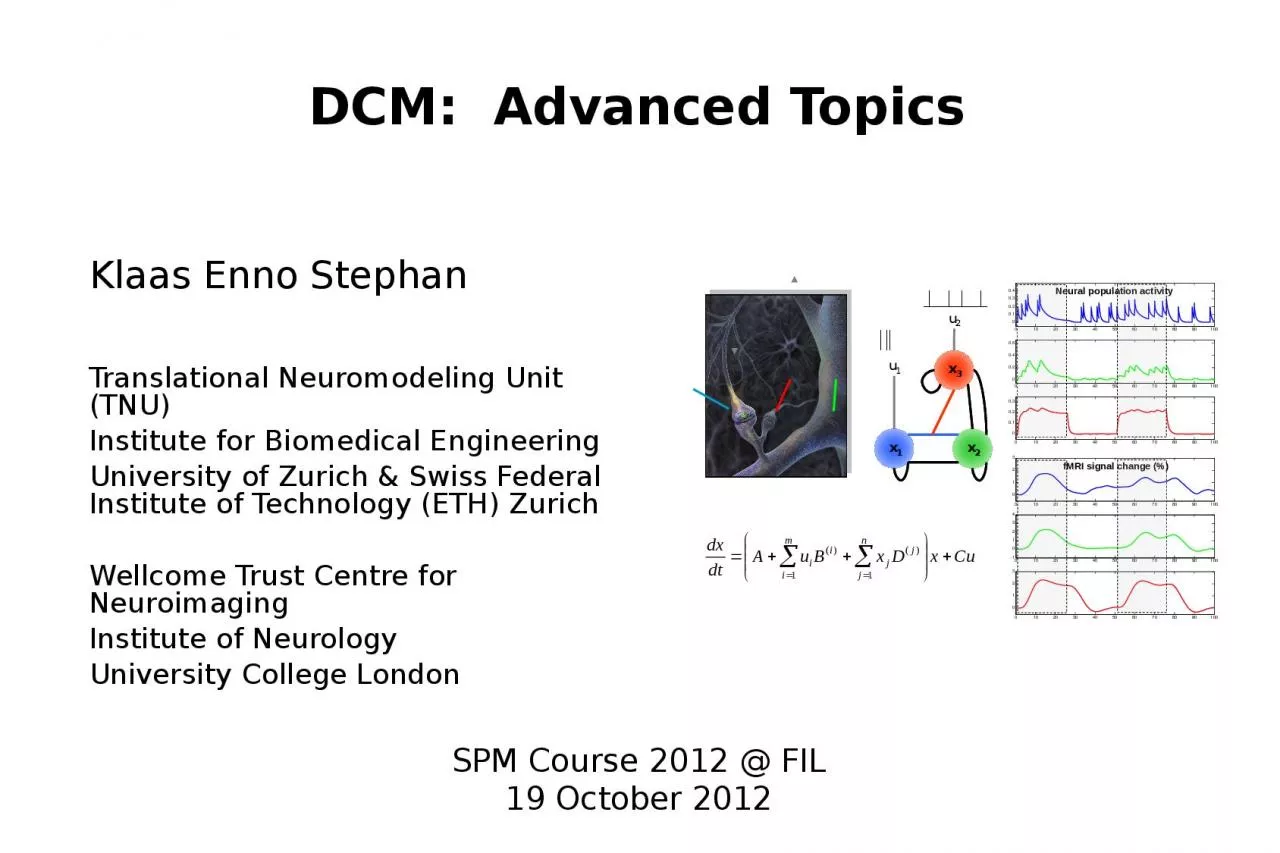
/
DCM:   Advanced Topics Klaas Enno Stephan DCM:   Advanced Topics Klaas Enno Stephan

DCM: Advanced Topics Klaas Enno Stephan - PowerPoint Presentation

fanny
fanny . @fanny
Follow
66 views
Uploaded On 2023-07-26

DCM: Advanced Topics Klaas Enno Stephan - PPT Presentation

Translational Neuromodeling Unit TNU Institute for Biomedical Engineering University of Zurich amp Swiss Federal Institute of Technology ETH Zurich Wellcome Trust Centre for Neuroimaging ID: 1011351

models model neuroimage dcm model models dcm neuroimage stephan state friston dynamic causal 2010 2011 fmri amp penny bms

Share:

Link:

Embed:

Download Presentation from below link

Download Presentation The PPT/PDF document "DCM: Advanced Topics Klaas Enno Stepha..." is the property of its rightful owner. Permission is granted to download and print the materials on this web site for personal, non-commercial use only, and to display it on your personal computer provided you do not modify the materials and that you retain all copyright notices contained in the materials. By downloading content from our website, you accept the terms of this agreement.


Presentation Transcript

1. DCM: Advanced TopicsKlaas Enno Stephan Translational Neuromodeling Unit (TNU)Institute for Biomedical EngineeringUniversity of Zurich & Swiss Federal Institute of Technology (ETH) ZurichWellcome Trust Centre for NeuroimagingInstitute of NeurologyUniversity College LondonSPM Course 2012 @ FIL19 October 2012

2. OverviewBayesian model selection (BMS) Extended DCM for fMRI: nonlinear, two-state, stochastic Embedding computational models in DCMsIntegrating tractography and DCMApplications of DCM to clinical questions

3. Neural state equation:Electromagneticforward model:neural activityEEGMEGLFPDynamic Causal Modeling (DCM)simple neuronal modelcomplicated forward modelcomplicated neuronal modelsimple forward modelfMRIEEG/MEGinputsHemodynamicforward model:neural activityBOLD

4. Generative models & model selectionany DCM = a particular generative model of how the data (may) have been causedmodelling = comparing competing hypotheses about the mechanisms underlying observed dataa priori definition of hypothesis set (model space) is crucialdetermine the most plausible hypothesis (model), given the datamodel selection  model validation!model validation requires external criteria (external to the measured data)

5. Model comparison and selectionGiven competing hypotheses on structure & functional mechanisms of a system, which model is the best?For which model m does p(y|m) become maximal?Which model represents thebest balance between model fit and model complexity?Pitt & Miyung (2002) TICS

6. Model evidence:Various approximations, e.g.:negative free energy, AIC, BICBayesian model selection (BMS)accounts for both accuracy and complexity of the modelallows for inference about structure (generalisability) of the modelall possible datasetsyp(y|m)Gharamani, 2004McKay 1992, Neural Comput.Penny et al. 2004a, NeuroImage

7. Logarithm is a monotonic functionMaximizing log model evidence= Maximizing model evidenceSPM2 & SPM5 offered 2 approximations:Akaike Information Criterion:Bayesian Information Criterion:Log model evidence = balance between fit and complexityPenny et al. 2004a, NeuroImagePenny 2012, NeuroImageApproximations to the model evidence in DCMNo. of parametersNo. ofdata points

8. The (negative) free energy approximationUnder Gaussian assumptions about the posterior (Laplace approximation):

9. The complexity term in FIn contrast to AIC & BIC, the complexity term of the negative free energy F accounts for parameter interdependencies.The complexity term of F is higherthe more independent the prior parameters ( effective DFs)the more dependent the posterior parametersthe more the posterior mean deviates from the prior meanNB: Since SPM8, only F is used for model selection !

10. Bayes factorspositive value, [0;[But: the log evidence is just some number – not very intuitive!A more intuitive interpretation of model comparisons is made possible by Bayes factors:To compare two models, we could just compare their log evidences.B12p(m1|y)Evidence1 to 350-75%weak3 to 2075-95%positive20 to 15095-99%strong 150 99%Very strongKass & Raftery classification:Kass & Raftery 1995, J. Am. Stat. Assoc.

11. V1V5stimPPCM2attentionV1V5stimPPCM1attentionV1V5stimPPCM3attentionV1V5stimPPCM4attentionBF 2966F = 7.995M2 better than M1BF  12F = 2.450M3 better than M2BF  23F = 3.144M4 better than M3M1M2M3M4BMS in SPM8: an example

12. Fixed effects BMS at group levelGroup Bayes factor (GBF) for 1...K subjects:Average Bayes factor (ABF):Problems:blind with regard to group heterogeneitysensitive to outliers

13. Random effects BMS for heterogeneous groupsDirichlet parameters = “occurrences” of models in the populationDirichlet distribution of model probabilities rMultinomial distribution of model labels mMeasured data yModel inversion by Variational Bayes (VB) or MCMCStephan et al. 2009a, NeuroImagePenny et al. 2010, PLoS Comp. Biol.

14. MOGLGLGRVFstim.LVFstim.FGFGLD|RVFLD|LVFLDLDMOGMOGLGLGRVFstim.LVFstim.FGFGLDLDLD|RVFLD|LVFMOGm2m1m1m2Data: Stephan et al. 2003, ScienceModels: Stephan et al. 2007, J. Neurosci.

15. m1m2Stephan et al. 2009a, NeuroImage

16. inference on model structure or inference on model parameters?inference on individual models or model space partition?comparison of model families using FFX or RFX BMSoptimal model structure assumed to be identical across subjects?FFX BMSRFX BMSyesnoinference on parameters of an optimal model or parameters of all models?BMAdefinition of model spaceFFX analysis of parameter estimates(e.g. BPA)RFX analysis of parameter estimates(e.g. t-test, ANOVA)optimal model structure assumed to be identical across subjects?FFX BMSyesnoRFX BMSStephan et al. 2010, NeuroImage

17. Model space partitioning:comparing model familiesm1m2m1m2Stephan et al. 2009, NeuroImage

18. Bayesian Model Averaging (BMA)abandons dependence of parameter inference on a single modeluses the entire model space considered (or an optimal family of models) computes average of each parameter, weighted by posterior model probabilitiesrepresents a particularly useful alternativewhen none of the models (or model subspaces) considered clearly outperforms all otherswhen comparing groups for which the optimal model differsNB: p(m|y1..N) can be obtained by either FFX or RFX BMSPenny et al. 2010, PLoS Comput. Biol.

19. OverviewBayesian model selection (BMS) Extended DCM for fMRI: nonlinear, two-state, stochastic Embedding computational models in DCMsIntegrating tractography and DCMApplications of DCM to clinical questions

20. DCM10 in SPM8DCM10 was released as part of SPM8 in July 2010 (version 4010).Introduced many new features, incl. two-state DCMs and stochastic DCMsThis led to various changes in model defaults, e.g.inputs mean-centredchanges in coupling priorsself-connections estimated separately for each areaFor details, see: www.fil.ion.ucl.ac.uk/spm/software/spm8/SPM8_Release_Notes_r4010.pdfFurther changes in version 4290 (released April 2011) to accommodate new developments and give users more choice (e.g., whether or not to mean-centre inputs).

21. The evolution of DCM in SPMDCM is not one specific model, but a framework for Bayesian inversion of dynamic system modelsThe default implementation in SPM is evolving over timeimprovements of numerical routines (e.g., for inversion)change in priors to cover new variants (e.g., stochastic DCMs, endogenous DCMs etc.)To enable replication of your results, you should ideally state which SPM version (release number) you are using when publishing papers.In the next SPM version, the release number will be stored in the DCM.mat.

22. endogenous connectivitydirect inputsmodulation ofconnectivityNeural state equationhemodynamicmodelλxyintegrationBOLDyyyactivityx1(t)activityx2(t)activityx3(t)neuronalstatestdrivinginput u1(t)modulatoryinput u2(t)tThe classical DCM:a deterministic, one-state, bilinear model

23. Factorial structure of model specification in DCM10Three dimensions of model specification:bilinear vs. nonlinearsingle-state vs. two-state (per region)deterministic vs. stochasticSpecification via GUI.

24. bilinear DCMBilinear state equation:driving inputmodulationdriving inputmodulationnon-linear DCMTwo-dimensional Taylor series (around x0=0, u0=0):Nonlinear state equation:

25. Neural population activityfMRI signal change (%)x1x2x3Nonlinear dynamic causal model (DCM)Stephan et al. 2008, NeuroImageu1u2

26. V1V5stimPPCattentionmotion1.250.130.460.390.260.500.260.10MAP = 1.25Stephan et al. 2008, NeuroImage

27. V1V5PPCobservedfittedmotion &attentionmotion &no attentionstatic dots

28. inputSingle-state DCMIntrinsic (within-region) couplingExtrinsic (between-region) couplingTwo-state DCMTwo-state DCMMarreiros et al. 2008, NeuroImage

29. Estimates of hidden causes and states(Generalised filtering)Stochastic DCMLi et al. 2011, NeuroImageall states are represented in generalised coordinates of motionrandom state fluctuations w(x) account for endogenous fluctuations,have unknown precision and smoothness  two hyperparametersfluctuations w(v) induce uncertainty about how inputs influence neuronal activitycan be fitted to resting state data

30. OverviewBayesian model selection (BMS) Extended DCM for fMRI: nonlinear, two-state, stochastic Embedding computational models in DCMsIntegrating tractography and DCMApplications of DCM to clinical questions

31. Learning of dynamic audio-visual associationsCSResponseTime (ms)02004006008002000 ± 650orTarget StimulusConditioning StimulusorTS0200400600800100000.20.40.60.81p(face)trialCS1CS2den Ouden et al. 2010, J. Neurosci.

32. Hierarchical Bayesian learning modelobserved eventsprobabilistic associationvolatilitykvt-1vtrtrt+1utut+1Behrens et al. 2007, Nat. Neurosci.prior on volatility

33. Explaining RTs by different learning models40044048052056060000.20.40.60.81Trialp(F) TrueBayes VolHMM fixedHMM learnRWBayesian model selection: hierarchical Bayesian model performs best5 alternative learning models: categorical probabilitieshierarchical Bayesian learnerRescorla-WagnerHidden Markov models (2 variants)0.10.30.50.70.9390400410420430440450RT (ms)p(outcome)Reaction timesden Ouden et al. 2010, J. Neurosci.

34. PutamenPremotor cortexStimulus-independent prediction error p < 0.05 (SVC)p < 0.05 (cluster-level whole- brain corrected)p(F)p(H)-2-1.5-1-0.50BOLD resp. (a.u.)p(F)p(H)-2-1.5-1-0.50BOLD resp. (a.u.)den Ouden et al. 2010, J. Neurosci .

35. Prediction error (PE) activity in the putamenPE during reinforcement learningPE during incidentalsensory learningO'Doherty et al. 2004, Scienceden Ouden et al. 2009, Cerebral CortexCould the putamen be regulating trial-by-trial changes of task-relevant connections?PE = “teaching signal” for synaptic plasticity during learning p < 0.05 (SVC)PE during activesensory learning

36. Prediction errors control plasticity during adaptive cognitionModulation of visuo-motor connections by striatal prediction error activityInfluence of visual areas on premotor cortex:stronger for surprising stimuli weaker for expected stimuliden Ouden et al. 2010, J. Neurosci .PPAFFAPMdHierarchical Bayesian learning modelPUTp = 0.010p = 0.017

37. events in the worldassociationvolatilityHierarchical variational Bayesian learningsensory stimuliMean-field decomposition Mathys et al. (2011), Front. Hum. Neurosci.

38. OverviewBayesian model selection (BMS) Extended DCM for fMRI: nonlinear, two-state, stochastic Embedding computational models in DCMsIntegrating tractography and DCMApplications of DCM to clinical questions

39. Diffusion-weighted imagingParker & Alexander, 2005, Phil. Trans. B

40. Probabilistic tractography: Kaden et al. 2007, NeuroImagecomputes local fibre orientation density by spherical deconvolution of the diffusion-weighted signalestimates the spatial probability distribution of connectivity from given seed regionsanatomical connectivity = proportion of fibre pathways originating in a specific source region that intersect a target region If the area or volume of the source region approaches a point, this measure reduces to method by Behrens et al. (2003)

41. R2R1R2R1low probability of anatomical connection small prior variance of effective connectivity parameterhigh probability of anatomical connection large prior variance of effective connectivity parameterIntegration of tractography and DCMStephan, Tittgemeyer et al. 2009, NeuroImage

42. LGLGFGFG DCMLGleftLGrightFGrightFGleft anatomical connectivity probabilistictractographyProof of concept study connection-specific priors for coupling parametersStephan, Tittgemeyer et al. 2009, NeuroImage

43. Connection-specific prior variance  as a function of anatomical connection probability 64 different mappings by systematic search across hyper-parameters  and yields anatomically informed (intuitive and counterintuitive) and uninformed priors

44. Models with anatomically informed priors (of an intuitive form)

45. Models with anatomically informed priors (of an intuitive form) were clearly superior to anatomically uninformed ones: Bayes Factor >109

46. OverviewBayesian model selection (BMS) Extended DCM for fMRI: nonlinear, two-state, stochastic Embedding computational models in DCMsIntegrating tractography and DCMApplications of DCM to clinical questions

47. model structure Model-based predictions for single patientsset of parameter estimatesBMSmodel-based decoding

48. BMS: Parkison‘s disease and treatmentRowe et al. 2010,NeuroImageAge-matched controlsPD patientson medicationPD patientsoff medicationDA-dependent functional disconnection of the SMASelection of action modulates connections between PFC and SMA

49. Model-based decoding by generative embeddingBrodersen et al. 2011, PLoS Comput. Biol.step 2 —kernel constructionstep 1 —model inversionmeasurements from an individual subjectsubject-specificinverted generative modelsubject representation in the generative score spaceA → BA → CB → BB → CACBstep 3 —support vector classificationseparating hyperplane fitted to discriminate between groupsACBjointly discriminativemodel parametersstep 4 —interpretation

50. Discovering remote or “hidden” brain lesions

51. Discovering remote or “hidden” brain lesionsdetect “down-stream” network changes  altered synaptic coupling among healthy regions

52. Model-based decoding of disease status: mildly aphasic patients (N=11) vs. controls (N=26)Connectional fingerprints from a 6-region DCM of auditory areas during speech perceptionBrodersen et al. 2011, PLoS Comput. Biol.

53. Model-based decoding of disease status: aphasic patients (N=11) vs. controls (N=26)Classification accuracyBrodersen et al. 2011, PLoS Comput. Biol.MGBPTHG(A1)MGBPTHG(A1)auditory stimuli

54. Multivariate searchlightclassification analysisGenerative embedding using DCM

55. Brodersen et al. 2011, PLoS Comput. Biol.

56. Key methods papers: DCM for fMRI and BMS – part 1Brodersen KH, Schofield TM, Leff AP, Ong CS, Lomakina EI, Buhmann JM, Stephan KE (2011) Generative embedding for model-based classification of fMRI data. PLoS Computational Biology 7: e1002079.Daunizeau J, David, O, Stephan KE (2011) Dynamic Causal Modelling: A critical review of the biophysical and statistical foundations. NeuroImage 58: 312-322.Friston KJ, Harrison L, Penny W (2003) Dynamic causal modelling. NeuroImage 19:1273-1302.Friston K, Stephan KE, Li B, Daunizeau J (2010) Generalised filtering. Mathematical Problems in Engineering 2010: 621670.Friston KJ, Li B, Daunizeau J, Stephan KE (2011) Network discovery with DCM. NeuroImage 56: 1202–1221.Friston K, Penny W (2011) Post hoc Bayesian model selection. Neuroimage 56: 2089-2099.Kasess CH, Stephan KE, Weissenbacher A, Pezawas L, Moser E, Windischberger C (2010) Multi-Subject Analyses with Dynamic Causal Modeling. NeuroImage 49: 3065-3074.Kiebel SJ, Kloppel S, Weiskopf N, Friston KJ (2007) Dynamic causal modeling: a generative model of slice timing in fMRI. NeuroImage 34:1487-1496.Li B, Daunizeau J, Stephan KE, Penny WD, Friston KJ (2011). Stochastic DCM and generalised filtering. NeuroImage 58: 442-457Marreiros AC, Kiebel SJ, Friston KJ (2008) Dynamic causal modelling for fMRI: a two-state model. NeuroImage 39:269-278.Penny WD, Stephan KE, Mechelli A, Friston KJ (2004a) Comparing dynamic causal models. NeuroImage 22:1157-1172.Penny WD, Stephan KE, Mechelli A, Friston KJ (2004b) Modelling functional integration: a comparison of structural equation and dynamic causal models. NeuroImage 23 Suppl 1:S264-274.

57. Key methods papers: DCM for fMRI and BMS – part 2Penny WD, Stephan KE, Daunizeau J, Joao M, Friston K, Schofield T, Leff AP (2010) Comparing Families of Dynamic Causal Models. PLoS Computational Biology 6: e1000709. Penny WD (2012) Comparing dynamic causal models using AIC, BIC and free energy. Neuroimage 59: 319-330.Stephan KE, Harrison LM, Penny WD, Friston KJ (2004) Biophysical models of fMRI responses. Curr Opin Neurobiol 14:629-635.Stephan KE, Weiskopf N, Drysdale PM, Robinson PA, Friston KJ (2007) Comparing hemodynamic models with DCM. NeuroImage 38:387-401.Stephan KE, Harrison LM, Kiebel SJ, David O, Penny WD, Friston KJ (2007) Dynamic causal models of neural system dynamics: current state and future extensions. J Biosci 32:129-144.Stephan KE, Weiskopf N, Drysdale PM, Robinson PA, Friston KJ (2007) Comparing hemodynamic models with DCM. NeuroImage 38:387-401.Stephan KE, Kasper L, Harrison LM, Daunizeau J, den Ouden HE, Breakspear M, Friston KJ (2008) Nonlinear dynamic causal models for fMRI. NeuroImage 42:649-662.Stephan KE, Penny WD, Daunizeau J, Moran RJ, Friston KJ (2009a) Bayesian model selection for group studies. NeuroImage 46:1004-1017.Stephan KE, Tittgemeyer M, Knösche TR, Moran RJ, Friston KJ (2009b) Tractography-based priors for dynamic causal models. NeuroImage 47: 1628-1638.Stephan KE, Penny WD, Moran RJ, den Ouden HEM, Daunizeau J, Friston KJ (2010) Ten simple rules for Dynamic Causal Modelling. NeuroImage 49: 3099-3109.

58. Thank you