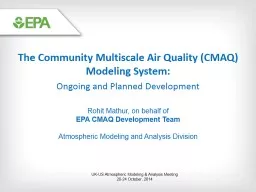
CMAQv51 EPA CMAQ Development Team Atmospheric Modeling and Analysis Division National Exposure Research Laboratory Office of Research and Development 1 CMAS Conference October 5 2015 Recent CMAQ Versions ID: 730434
Download Presentation The PPT/PDF document "A new version of the Community Multiscal..." is the property of its rightful owner. Permission is granted to download and print the materials on this web site for personal, non-commercial use only, and to display it on your personal computer provided you do not modify the materials and that you retain all copyright notices contained in the materials. By downloading content from our website, you accept the terms of this agreement.
Slide1
A new version of the Community Multiscale Air Quality Model: CMAQv5.1EPA CMAQ Development TeamAtmospheric Modeling and Analysis DivisionNational Exposure Research LaboratoryOffice of Research and Development
1
CMAS Conference
October 5, 2015Slide2
Recent CMAQ VersionsPeriodic Public Release of Improved versions of the Modeling SystemCMAQv4.7 (Fall 2008) and CMAQv4.7.1 (June 2010)
Supporting evaluation
: Foley et al,
Geoscientific
Model Development, 2010CMAQv5.0 (Feb. 2012)Updates to gas-aqueous-aerosol chemistry and photolysis Improved advective and turbulent transportMajor structural upgrades that improve flexibility and maintainability2-way coupling between WRF-CMAQBi-directional exchange: NH3 and HgCMAQv5.0.2 (May 2014)Instrumented Models (Direct Decoupled Method (DDM), Source Apportionment, Sulfur Tracking)Community Contributions (Volatility Basis Set (VBS))CMAQv5.1 (October 2015)
2Slide3
Drivers: Multi-scale modeling3
Hemispheric model needed to provide LBCs for US Domain
Intercontinental input increases importance as NAAQS are reduced
Fine scales:
Urban EnvironmentsLinkage with human exposure & health studiesResidual non-attainment
Hemispheric model at 108 km provides LBCs for 12 km CONUS with nests to 4 km and 1 kmSlide4
CMAQv5.1 Chemistry updatesMoving towards improved integration of chemistry across all phasesUpdates to CB05 to improve nitrogen cycling and nitrogen depositionAdditional sources of secondary organic aerosol (see talk by Pye)Restructuring heterogeneous reactions and link with gas phase chemistrymore transparency and higher accuracy in fast reactions on aerosols and soil surfacesExpanded capability for aqueous organic chemistry (see Fahey poster)Updates to photochemistry for effects of BC aerosol and improved representation of clouds (see talk by Hutzell)Updates to all three chemical mechanisms (CB05, SAPRC07, and RACM2)Standard mechanisms more consistent with current research and reviewsAdded first order marine depletion parameterized from halogens
reduces ozone over marine environments and coastal
regions
4Slide5
CMAQv5.1 Updates:Organic Nitrogen Chemistry and DepositionIssue: All organic nitrates are lumped into one species in CB05, but they can vary widely in physical and chemical properties. CMAQv5.1 has 7 modeled organic nitrate species
5
Better characterization of alkyl nitrates can improve predictions of
NOy
species and organic nitrogen depositionAlkyl nitrates PANsMeasurements (Discover AQ) CMAQv5.02CB05e51CB05e51 with hydrolysisParameterRepresentative valuesCMAQ v5.02CMAQ v5.1 (7 species)
Henry’s Law
coef
.
(M/atm)
0.6
to 4
0,000
1.7
0.65 to 17,000.
Reaction rate with OH (cm3/molecule-sec)
1.8e-13 to 1.1e-10
1.8e-13
1.1e-12 to 3.3e-11
Example (07/10/11) results for
NOySlide6
CMAQv5.1 Updates:Improving representation of marine environmentsIssue: Impact of deposition to seawater, simple halogen chemistry, and boundary conditions on O3 over the CONUS domain. Boundary conditions accounting the effect of halogen chemistry is important6
halogen chemistry effect
Enhanced deposition effect
Boundary condition effect
Combined effectSlide7
CMAQv5.1 Updates:Aqueous chemistry with Rosenbrock Solver and kinetic mass transfer: AQCHEM-KMT
Available for both standard AQCHEM chemistry as well as expanded mechanism that includes SOA formation from IEPOX/MPAN
Readily expandable for new chemistry or processes
Reduced potential for coding error (KPP-generated code) Increased linkage between aqueous chemistry and cloud microphysical parametersIncreased computational requirements7Slide8
CMAQv5.1 Updates:Secondary Organic Aerosols8AERO6 module updatedSOA from isoprene updatedSOA from ISOPRENE + NO3
addedAcid catalyzed SOA (AISO3J) updated to form from IEPOX [Pye et al. 2013 ES&T]
SOA from PAHs (naphthalene) added [Pye and Pouliot 2012 ES&T]
SOA from alkanes added (CB05) or updated (SAPRC) [Pye and Pouliot 2012 ES&T]
New AERO6i moduleWorks with detailed isoprene chemistry (saprc07tic)Speciated epoxide SOASOA from BVOC nitrates (see Pye talk)SOA from GLY/MGLY uptake on particles (see Pye talk)Slide9
CMAQv5.1 Updates:Aerosol Size Distribution
Motivation:
Accurate aerosol
size distribution
is needed for estimating impacts on human health, ecosystems, visibility, and climatePrevious (limited) studies indicate particle number underestimatedUpdates:Correction of current binary nucleation scheme (Vehkamaki et al., 2002)Update PM emissions modal mass fractions and size distribution based on modern measurements (Ellerman and Covert, 2010)Added gravitational settling of aerosolsImpacts:Small impact on mass concentrations, as expectedCompared to Pittsburgh Air Quality Study SMPS measurements, simulated number distributions better represent the observed magnitude and size distribution of particles
Courtesy: Kathleen Fahey
9Slide10
CMAQv5.1 Updates:Sea-salt Emissions
Model updates
Added
dependency on sea surface temperature
Better reflects recent measurements and findingsReduced the size of the surf zone emissionsEarly ResultsLess coarse mode sea salt aerosolsIn agreement with size resolved observationsMore fine scale sea salt emissionsIn agreement with recent observationsResults in more aerosol nitrate in coastal areasAs indicated by CALNex observations (Kelly et al. 2014 JGR)Improves model biases but non-volatile NO3 aerosol concentrations are still underestimated (Gantt et al. 2015 GMDD)Improves evaluation against base cation wet deposition observationsCourtesy: Jesse BashSummer 201010Slide11
Updates to the BEIS
BEIS Canopy Model
Two layer model with leaf temperature parameterization
Integrated with metrological model surface energy balance
BELD dataUpdated to 2001-2011 NLCD, MODIS, and Forest Inventory Analysis (FIA) dataFiner (grid cell versus county) spatial allocation of tree speciesEarly ResultsImprovements in evaluation against AQS hourly isoprene observations~30% reduction in NMB and 15% reduction in NMESmall, ~1%-5%, Reduction bias and error in modeled PM2.5 and O3 estimatesCMAQv5.1 Updates:Biogenic Emissions11For details see, Bash et al. 2015 GMDDSlide12
CMAQv5.1 Updates:Dry Deposition and Bidirectional Exchange
Redesign of dry deposition and vertical diffusion codes
Utilizes a shared data module for meteorological and calculated environmental variables
Shares data and calculated parameters between vertical diffusion, deposition, bidirectional exchange, and emissions
Easier to maintain, update and modify codeRevised O3 deposition to vegetationMeasurements indicate that it is not governed by O3 solubilitySet wet cuticular resistance to 385 s/m (Altimir et al. 2006)Scaled cuticular resistance at physisorbed H2O at RH > 70% Altimir et al. (2006) between dry and wet valuesDry cuticular resistance of Wesley (1989)Results in approximately a 25% increase in nighttime O3 deposition velocity and lower background O3 concentration12Slide13
Model structure and numericsParallel I/O (Talk by Wong) More efficient PBL solver for ACM2Run-time optimizationOptimized code in horizontal advection, aerosols, and chemistry Large run time improvements in chemistry (~60%) and Aerosols (~15%)Run Time Results Approximately 25% faster model run time over betaApproximately 15% faster than v5.0.2Despite larger chemical mechanism (CB05TUCL vs CB05e51) Despite more gas species in the CONC file (86 versus 91)
13
13
Beta
V5.0V5.1Simulation daysRun time (h)Slide14
Updates to Meteorology ModelingImprovement to WRFv3.7 (released April 2015)Improvements in land surface and atmospheric boundary layer processes (PX LSM, ACM2)Consistent changes in ACM2 in CMAQmore accurate representation of surface meteorology and pollutant concentrations day and nightImproved treatment of wetlands in PX LSMSimple parameterization for urban development better prediction of effects of urban heat islands14
Advanced data and assimilation techniques
Iterative data assimilation techniques for high resolution (i.e. 1 – 4 km grids)
i
mproved fine-scale simulationsHigh resolution SST, and snow analysesRe-calculation of Monin-Obukhov length in CMAQ to be consistent with ACM2 in WRFTends to reduce stability in CMAQ run and increase ozone concentrationsBaseNew ACM2 and PX LSMSlide15
Evaluation TeaserSee Wyat Appel’s talk on Wednesday for thorough evaluationCMAQv5.1/WRF3.7 compared to CMAQv5.0.2/WRFv3.4 for ozone CONUS July 201115Slide16
PM2.5 in January 201116Slide17
NOx in July 201117Slide18
ConclusionsAdvanced science in chemistry (gas, aerosol, aqueous and heterogeneous), dry deposition, photolysis, boundary layer, biogenic emissionsImproved computational efficiencyImproved capabilities at large (hemispheric) and small (urban) scales Preliminary evaluation shows improved statistics for most metrics except increased mean ozone bias but also increased ozone correlation2-way WRF/CMAQ has been updated to CMAQv5.1 and WRFv3.718Slide19
Extra19Slide20
Drivers: Better Representation of concentration range (background to extreme)Scale Interactions: Tightening NAAQS and greater importance of characterizing “background” air pollution
“FT”
boundary contribution to surface O
3
2012-2014 8-Hour Ozone Design Values across the U.S.66-70ppb 71-75ppb >75ppb20Modelled Apr-Oct mean US Background O3
Air quality modeling suggests that an appreciable portion of the ozone in the western U.S. can be the result of sources other than U.S. anthropogenic emissions. Apportionment modeling suggests that much of this transport of ozone into the western U.S. from outside the domain occurs within the free troposphere. Plots courtesy of Kirk Baker and Pat Dolwick.Slide21
CMAQv5.1 Updates:Improving representation of marine environmentsIssue: Halogen chemistry and deposition to water are key sinks for O3 in marine environments; their accurate representation impacts predictions of both long-range transport and ambient levels in coastal areas.
21Slide22
WRF/CMAQ 4 km comparisonEC Aerosol Error difference: New ACM2 – Old ACM2Small differences in Max 8-h Ozone Error in both direction (not shown)Reduction in EC error at most CSN sites but little difference at IMPROVE sites
Very little difference in other aerosol species
The new ACM2 results in substantial reductions in NO
2
error and bias, particularly in the Washington through New York urban corridor Number of Model/Obs PairsNO2 Error difference: New ACM2 – Old ACM2Slide23
Reduction in Error
Increase in Error
Enabling Fine-scale Applications:
Improvements in Dynamics
GHRSST(daily; 1km)Impervious Surface FractionImproving representation of urban areasHigher surface heat capacity of impervious surfacesGreater heat storage warmer nighttime temp.Less stable nocturnal boundary layerUrban heat island effects on pollutant mixing RMSE and bias reduced with GHRSST. Reduction is even greater compared to NAM 12-km SST data.Implications for representing Bay Breeze and pollutant transport23Slide24
CMAQv5.1 Updates:Gas-Phase ChemistryMechanism Options: CB05, SAPRC07, and RACM2
Sarwar et al., ACP, 2013
24
(
a) Predicted mean fromm CB05TU, (b) percent differences in mean HO between RACM2 and CB05TU, (c) a comparison of predicted median HO to observed median data from the 2006 Texas Air Quality StudyA comparison of predicted daily maximum 8 h O3 with observations from the Air Quality System (when 8 h O3 > 75 ppbv). Error bars represent minimum and maximum valuesSlide25
2-way coupled WRF-CMAQCoupled Meteorology and Air Quality model Affords tighter temporal coupling between meteorological and chemical processesFacilitates feedback effects where gas and aerosol concentrations can affect meteorological processes which then feedback to Air Quality Last released version was based on WRFv3.4 and CMAQv5.0.2New release is updated to WRFv3.7 and CMAQv5.125Slide26
CMAQ 5.1 Run Time OptimizationProfiled CMAQ 5.1 subroutinesModel Changes Optimized code in horizontal advection, aerosols, and chemistry Large run time improvements in chemistry (~60%) and Aerosols (~15%)Run Time Results Approximately 25% faster model run time over betaApproximately 15% faster than v5.0.2Despite larger chemical mechanism (CB05TUCL vs CB05e51) Despite more gas species in the CONC file (86 versus 91)26
Beta
V5.0
V5.1
Simulation daysRun time (h)Slide27
Scale Interactions
:
Examining U.S. air quality in context of the global
atmosphere
Drivers: CMAQ Evolution27Slide28
CMAQv5.1 Updates:Heterogeneous ChemistryWhen particle contain Cl, uptake of N2O5 can also produce ClNO2
N
2
O
5(g) + H2O (aq) 2 HNO3 (g) N2O5(g) + H2O (aq) + y Cl (aq) y ( HNO3(g) + ClNO2(g) ) + 2(1-y) HNO3 (g) Current model: Uptake of N
2
O
5
on aerosols
Alters partitioning of reactive nitrogen, impacts oxidant chemistry, and thus
i
mpacts production of secondary pollutants (
Sarwar et al., GRL, 2014
)
Average change in winter-time predictions due to ClNO
2
Chemistry
TNO3 O
3
SO
4
2-
28Slide29
WRF Dx = 12 km: revised PX LSM and ACM2 vs Base
New Model with
Revised LSM
Revised PBL
Base ModelSignificant improvements in 2-m T and Q bias and errorAugust 2006