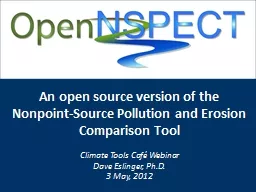
Climate Tools Café Webinar Dave Eslinger PhD 3 May 2012 What is OpenNSPECT Water quality screening tool Spatially distributed rasterbased pollutant and sediment yield model Compares the effects of different land cover and land use scenarios on total yields ID: 383206
Download Presentation The PPT/PDF document "An open source version of the Nonpoint-S..." is the property of its rightful owner. Permission is granted to download and print the materials on this web site for personal, non-commercial use only, and to display it on your personal computer provided you do not modify the materials and that you retain all copyright notices contained in the materials. By downloading content from our website, you accept the terms of this agreement.
Slide1
An open source version of the Nonpoint-Source Pollution and Erosion Comparison Tool
Climate Tools Café Webinar
Dave
Eslinger
, Ph.D.
3 May, 2012Slide2
What is OpenNSPECT?
Water quality screening toolSpatially distributed (raster-based) pollutant and sediment yield modelCompares the effects of different land cover and land use scenarios on total yieldsUser friendly graphical interface within a GIS environmentSlide3
Processes Simulated
Topography determines flow direction and slopeSoil characteristics, land cover
,
and
precipitation
determine runoffRunoff, land cover, and pollutant coefficients determine pollutant loads Runoff, topography, soil characteristics, and land cover determine sediment loadsSlide4
Uses Existing Approaches
Rainfall runoff
Soil Conservation Service (SCS) curve number technique
Nonpoint pollutant
Event mean concentration technique
Sediment erosion
Universal Soil Loss Equation (USLE)
Modified (MUSLE)
Revised (RUSLE)Slide5
Assumptions/Limitations
Omitted processesStormwater drainageStream diversionsSnowmeltLandslides
No time component for
Runoff dynamics
Sediment redeposition
Pollutant dynamics
Source: NASA Earth Science EnterpriseSlide6
Usage Example
Kingston Lake Watershed Association, near Conway, SCNutrient loads under different growth scenariosSlide7
Data Needs
National sources*Land cover dataTopographyPrecipitationSoils dataPollutant coefficients
Rainfall erosivity
Local sources
Water quality standards
Additional pollutant coefficients
*Local “tuning” improves accuracySlide8
Topography
Defines flow direction, stream networks, watershedsDefaultU.S. Geological Survey (USGS) 30 m resolution digital elevation modelResolution impacts processing speed and file sizeSlide9
Land Cover
Foundation for runoff quantity, sediment yield, pollutant yieldDefaultCoastal Change Analysis Program (C-CAP)30 m resolution
Flexible
Can easily substitute any land cover gridSlide10
Soils
Runoff and erosion estimates are dependent upon soils and land coverDefaultSSURGO soils†
County level resolution
Infiltration rate
Hydrologic group
Soil erodibility
K-factor
†
Soil Survey Geographic Database provided by the Natural Resources Conservation ServiceSlide11
Precipitation
Derived from point estimates or modeled
OSU PRISM data
Annual average
Single event rainfallSlide12
Pollutants
Pollutant coefficients
Event mean concentrations
Land cover specific
Defaults
Nitrogen
Phosphorus
Lead
Zinc
User–definable
New pollutants
New coefficientsDifferent criteriaSlide13
Outputs
Runoff volumeAccumulated runoffSediment yieldAccumulated sediment load
Pollutant yield
Accumulated pollutant load
Pollutant concentrationSlide14
Baseline Runoff
Flow directions derived from topography
Precipitation grid provides amount of rainfall
Uses soils and land cover data to estimate volume of runoff
Validated
Flow directionSlide15
Baseline Erosion
Estimates total annual sediment load delivered to coast
Provides a conservative estimate
A “worst-case” scenarioSlide16
Baseline Nitrogen
Estimates total annual pollutant load delivered to coast
Focuses attention on source areasSlide17
Baseline Nitrogen
Estimates total annual pollutant concentrationFocuses attention on source areasSlide18
Example Application
Makaha Valley, Oahu, HawaiiAnnual time scale“What-if” scenario Baseline
Land cover change
New residential development
Climate change
C
hange in rainfall characteristicsSlide19
Land Cover Change Scenario
Develop a subdivisionChange scrub/shrub vegetation to low intensity developmentSlide20
Nitrogen (Pre-Change)
Baseline
Low nitrogen runoff
Add scenarioSlide21
Nitrogen (Post-Change)
Compare baseline estimate to the new estimated load
138 percent increase in annual nitrogen loadSlide22
Climate Change Scenarios
Same amount of rainfall, but change the number and intensity of the storms
7 raining days, Type I
14 raining days, Type IA
3 raining days, Type IISlide23
Questions?
Download OpenNSPECT: nspect.codeplex.com
Esri
9.x version at csc.noaa.gov/
nspect
Project Contacts:Dave Eslinger, Project lead
Dave.Eslinger@noaa.gov
843-740-1270
Shan
Burkhalter
Shan.Burkhalter@noaa.gov 843-740-1275Matt Pendleton Matt.Pendleton@noaa.gov 843-740-1196