PDF-Average, Standard Deviation and Relative Standard Deviation How will
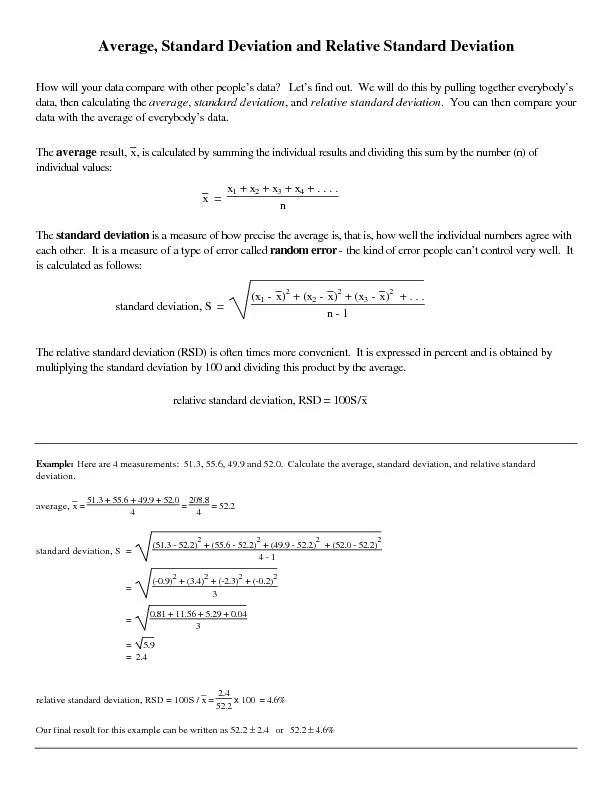
The standard deviation is a measure of how precise the average is that is how well the individual numbers agree with each other It is a measure of a type of error
Download Presentation
"Average, Standard Deviation and Relative Standard Deviation " is the property of its rightful owner. Permission is granted to download and print materials on this website for personal, non-commercial use only, provided you retain all copyright notices. By downloading content from our website, you accept the terms of this agreement.
Presentation Transcript
Transcript not available.