PPT-Normal Distribution and Z-scores
Author : kittie-lecroy | Published Date : 2018-12-05
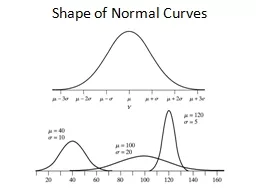
Intro to Statistics What is Normal Distribution Modeled by a Bellshaped curve Symmetric about the mean Mean average and the Median middle are the same number Or
Presentation Embed Code
Download Presentation
Download Presentation The PPT/PDF document "Normal Distribution and Z-scores" is the property of its rightful owner. Permission is granted to download and print the materials on this website for personal, non-commercial use only, and to display it on your personal computer provided you do not modify the materials and that you retain all copyright notices contained in the materials. By downloading content from our website, you accept the terms of this agreement.
Normal Distribution and Z-scores: Transcript
Download Rules Of Document
"Normal Distribution and Z-scores"The content belongs to its owner. You may download and print it for personal use, without modification, and keep all copyright notices. By downloading, you agree to these terms.
Related Documents