PPT-Module 7 Percent Area and the Normal Curve
Author : tawny-fly | Published Date : 2019-01-23
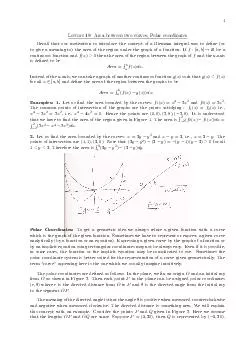
What it is History Uses 1 Normal Curve Characteristics Inflection points at and 1 SD Where slopes changes from down to out Axes X axis abscissa Scores as usual
Presentation Embed Code
Download Presentation
Download Presentation The PPT/PDF document "Module 7 Percent Area and the Normal Cu..." is the property of its rightful owner. Permission is granted to download and print the materials on this website for personal, non-commercial use only, and to display it on your personal computer provided you do not modify the materials and that you retain all copyright notices contained in the materials. By downloading content from our website, you accept the terms of this agreement.
Module 7 Percent Area and the Normal Curve: Transcript
Download Rules Of Document
"Module 7 Percent Area and the Normal Curve"The content belongs to its owner. You may download and print it for personal use, without modification, and keep all copyright notices. By downloading, you agree to these terms.
Related Documents