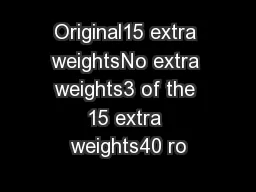
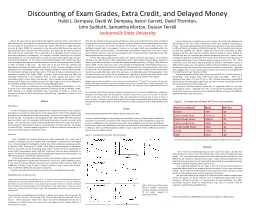
/
Discounting of Exam Grades, Extra Credit, and Delayed Discounting of Exam Grades, Extra Credit, and Delayed

Discounting of Exam Grades, Extra Credit, and Delayed - PowerPoint Presentation

faustina-dinatale
faustina-dinatale . @faustina-dinatale
Follow
396 views
Uploaded On 2017-12-16

Discounting of Exam Grades, Extra Credit, and Delayed - PPT Presentation

Money Heidi L Dempsey David W Dempsey Aaron Garrett David Thornton John Sudduth Samantha Morton DaJuan Ferrell Jacksonville State University AUC Discounting of Mean Std Dev ID: 615795

points discounting credit extra discounting points extra credit effort students time money hours study exam point grades hypothetical minutes

Share:

Link:

Embed:

Download Presentation from below link

Download Presentation The PPT/PDF document "Discounting of Exam Grades, Extra Credit..." is the property of its rightful owner. Permission is granted to download and print the materials on this web site for personal, non-commercial use only, and to display it on your personal computer provided you do not modify the materials and that you retain all copyright notices contained in the materials. By downloading content from our website, you accept the terms of this agreement.


Presentation Transcript

Slide1

Discounting of Exam Grades, Extra Credit, and Delayed MoneyHeidi L. Dempsey, David W. Dempsey, Aaron Garrett, David Thornton,John Sudduth, Samantha Morton, DaJuan FerrellJacksonville State University

AUC Discounting of:MeanStd. Dev.Grades.789.181 Extra Credit Point.414b,c,d.613 Extra Credit Points.505c,d.745 Extra Credit Points.391d.3310 Extra Credit Points.459c.32$1,000.278a,b.25$100.235a.28

Figure

2.

A Comparison of Mean

AUC Across

Commodities

Items which do not share a common subscript are significantly different from one another.

After

this the majority of choices were hypothetical in nature and involved decisions about reading for varying amounts of extra credit (1 point, 3 points, 5 points, 10 points) across varying amounts of time (5 minutes, 10 minutes, 15 minutes, 30 minutes, 45 minutes, 1 hour, 1.5 hours, and 3 hours). One additional scenario had a consequence (3 points in 5 minutes) which was embedded within the hypothetical extra credit questions. All point/time combinations involved the same linear scaling where students would earn the same percentage of the total points for the percentage of total time they said they would be willing to read.

For the effort discounting of exam grades, the scaling of choices was based on the standard learning curve, such that even a little studying will result in substantially increased grades, whereas it takes a great deal of studying to receive the highest possible grade (e.g.,

Ettlinger, 1926; Mazur & Hastie, 1978). In this scale more points were received at the beginning of the reading session (e.g., 6.37 points in 4 minutes) and the point distribution flattened out near the maximum (e.g., 9.23 points in 8 minutes). For the purposes of this study, the learning curve was modified so that the maximum reward was actually attainable, rather than serving as an unattainable upper limit (asymptote). From this point forward, this scaling will be referred to as “logarithmic” because the shape of the curve roughly approximates a logarithmic curve (increasing, concave down). Students were told to: Imagine that you were enrolled in a course where you could study for **3 hours** and receive 100 points (a 100%) on the exam. However, if you chose to study for less time, you would receive a lower exam grade. The list of exam grades and corresponding study times are listed on the next page. How long would you choose to study? For example, in the 3 hour example, students selected one of 13 choices to indicate their preference (0 points in 0 minutes; 18 in 15; 33 in 30; 46 in 45; 56 in 1 hour; 65 in 1.25; 73 in 1.5; 80 in 1.75; 85 in 2; 90 in 2.25; 94 in 2.75; 100 in 3 hours). We used seven time intervals (1 hour, 2 hours, 3 hours, 4 hours, 7 hours, 10 hours, and 15 hours) which we thought corresponded well to both the typical amounts someone might study for an exam (a few hours) and a large amount for college freshman (15 hours).ResultsDiscounting of Hypothetical Exam Grades, Money, and Extra Credit In order to calculate degree of discounting, the coordinates (reinforcer, delay) of each indifference point were converted to a proportion of the total amount or delay and were plotted on a graph to create an indifference curve, including a curve of the mean indifference points across participants. Then the area under the indifference curve (AUC) was calculated by the trapezoid method, as outlined by Myerson, Green, and Warusawitharana (2001). Figure 1 depicts the mean indifference points for each of the commodities studied.Figure 1. Average Discounting for All Commodities

One of the areas that has been lacking with regard to empirical study is the domain of effort discounting. Although the procrastination literature has demonstrated that people are more likely to procrastinate on things that require effort (Ferrari, 1992; McCown, Johnson, & Petzel, 1989), the researchers in the discounting field have rarely examined how people discount outcomes that require effort. One reason for this may be because effort and time are confounded. This is especially true in education, which is the area we were most interested in investigating. For example, a student cannot just sit in front of their textbook for a certain length of time in order to receive a letter grade (e.g., 10 hours in front of the textbook = “A” vs. 7 hours in front of the textbook = “B”). Rather, they must actively engage in reading and comprehending the material, exerting a great deal of effort in order to receive a high score. We know this to be true from the cognitive and educational psychology literatures which show that “active” learning strategies involving comprehension, metacognition, higher order thinking, repetition, mastery-based learning, PSI, distributed learning, overlearning, and so forth lead to higher comprehension and retention of material (e.g., Hattie, 2008). However, even though time and effort are inexorably intertwined in the education field, in other aspects this process looks remarkably similar to other types of discounting. That is, people can be asked to make a decision about where their indifference point lies with regard to how much effort/time they would be willing to expend in order to receive differing rewards. The current study is an extension of two studies by Williams and colleagues. In this study we used a new computer program (Dempsey, Dempsey, Garrett, & Thornton, 2008), which allowed us to change commodities (e.g., discounting of money vs. points) and change the method by which discounting is assessed (e.g., hypothetical choices or real time choices).

  A series of bivariate correlations were run to examine the relationship between the discounting of real time effort, hypothetical effort, and temporal discounting of money. The results indicated that the temporal discounting of money was unrelated to either of the sets of measures of effort discounting. This is consistent with previous research by Sugiwaka and Okouchi (2004) who found that discounting of effort (measured by how often Japanese students would be willing to wash a bathtub for 100,000 yen) was not correlated with delayed discounting of money. Further, Green and Myerson (2010) concluded after their review of the literature, that temporal and probability discounting “involve different decision-making processes” (p. 74). Other researchers have also found that discounting of different commodities results in different discounting rates. For example, Odum and Rainaud (2003) found that people discounted money less steeply than consumable rewards of equal value. Together, these suggest that it is not surprising that students may discount money differently than they discount tasks that involve effort. A repeated measures ANOVA was used to compare AUC for all of the measures of discounting: exam grades, extra credit points, $100, and $1000. There was a significant linear effect, F (1, 65) = 70.56, p < .001. Pairwise comparisons revealed that people discounted exam grades significantly less than any other commodity, and they discounted money the most (see Figure 2). Contrary to previous research, there was no magnitude effect for the delay discounting of money. Although there was a trend toward discounting lower extra credit point values more, there was not a significant difference between the different hypothetical extra credit point values.

Discussion One of the most interesting things to come out of this study is the fact that students discount money much more steeply than extra credit and especially exam grades. This is consistent with several of our other studies which show that it is very difficult to get students to discount extra credit. Future research should take this a step further and examine students’ hypothetical discounting of exam grades correlates with how much they actually study for a given exam. One surprising finding from this study is the fact there was little evidence of magnitude effects, even in the temporal discount of money. This is a very uncommon finding. Future research should examine this phenomenon further and be sure that there is not something unique with this population of students. We also have several other things in this data set that we need to analyze which will be the genesis for future research, such as hypothetical discounting in work situations, self-report measures of impulsiveness and procrastination, and other personality measures related to impulsiveness (e.g., locus of control, need for cognition, academic delay of gratification). Poster presented at the ABAI Behavioral Economics Conference, March 2011

Method Participants  A total of 134 general psychology students from a regional university in the Southeast participated in at least the online portion of the data collection (67 of these students also participated in the laboratory portion of the study). There were 50 males (37.3%) and 84 females (62.7%). The majority of the participants were White (56%), followed by African American (40%), with the remainder (4%) being from other minority or mixed racial groups. The majority were freshman (68%), followed by sophomores (23%), then juniors and seniors (9%). Most students lived on campus (50%) or commute less than 15 minutes to school (26.1%). Students ranged in age from 17 to 58 years old with a mean age of 21 years and a median age of 19 years (SD = 6.61). Procedure  After completing the consent, students were taken individually into a room with a computer and asked to put on a headset with a microphone. Students were then logged into a computer program developed by the first four authors (Dempsey, Dempsey, Garrett, & Thornton, 2008; Dempsey et al., 2008). After filling in the demographic information, students completed several discounting tasks which included temporal discounting of money, effort discounting of extra credit (the majority of scenarios were hypothetical in nature, but two had consequences), effort discounting of hypothetical exam grades, and effort discounting of real time extra credit scenarios. To assess the temporal discounting of money, the computer program employed the double limit algorithm to narrow down participants’ choices to a single indifference point. In the present study, participants were given two maximum dollar amounts, $100 and $1000, and 7 delays—1 day, 1 week, 1 month, 6 months, 1 year, 5 years, and 25 years. Thus, 14 different indifference points were calculated.   To assess discounting of extra credit, scenarios such as the following were used: Hypothetical Extra Credit Scenario: Imagine that your teacher was offering you a **1 point** extra credit opportunity where you could choose to read an English literature book out loud for **1 minute** in order to receive the full amount of extra credit points, or you could choose instead to read for a shorter amount of time and still earn some percentage of the total number of extra credit points. Finally, you could choose not to read at all and earn 0 points now. How long would you choose to read to earn extra credit points?The points/time combinations were as follows: 0 points in 0 seconds, .10 in 6 seconds, .20 in 12, .30 in 18, .40 in 24, .50 in 30, .60 in 36, .70 in 42, .80 in 48, .90 in 54, and 1.00 in 1 minute. After participants made their choice, they were immediately moved into a consequence condition where they were given the opportunity to actually read for 1 minute to earn 1 point.  

Note: The curve is drawn using Mazur’s (1987) discounting function, which was not a good fit for either amount of discounted money.