/
National Conference on Agriculture for National Conference on Agriculture for

National Conference on Agriculture for - PowerPoint Presentation

faustina-dinatale
faustina-dinatale . @faustina-dinatale
Follow
403 views
Uploaded On 2017-05-13

National Conference on Agriculture for - PPT Presentation

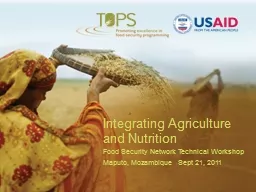
Rabi Campaign 201314 Group IV Interventions to increase Oilseed Pulses production in different ecologies 24 September 2013 Farmer Welfare and Agriculture Development Bhopal Madhya Pradesh ID: 547996

area production seed amp production area amp seed lakh districts yield productivity phy fin increase 2013 state 2012 chickpea

Share:

Link:

Embed:

Download Presentation from below link

Download Presentation The PPT/PDF document "National Conference on Agriculture for" is the property of its rightful owner. Permission is granted to download and print the materials on this web site for personal, non-commercial use only, and to display it on your personal computer provided you do not modify the materials and that you retain all copyright notices contained in the materials. By downloading content from our website, you accept the terms of this agreement.


Presentation Transcript

Slide1

National Conference on Agriculture for Rabi Campaign 2013-14Group – IV Interventions to increase Oilseed, Pulses production in different ecologies

24 September 2013

Farmer Welfare and Agriculture Development

Bhopal, Madhya PradeshSlide2

Agro Climatic Zones in Madhya PradeshSlide3

NUMBER OF HOLDINGS IN PERCENTAGESlide4

Important Agriculture StatisticsAgro climatic zones. - 11Net Cultivable area – 150.75 lakh ha. Fallow land

- 11.55 lakh ha.Area sown : Kharif

- 118.59 lakh ha.,

Rabi

– 104.32 lakh ha.

Double cropped area

- 72.16 lakh ha.

Cropping intensity

- 148 %

Area under Irrigation – 36.5% ,

Rainfed - 63.5%

No. of Holdings - 79.08 lakh,

Holdings of Small & - 53.47 lakh (68%) Marginal farmers

Area - 46.63 lakh ha (29.16%)

Fertilizer consumption – 88.28 kg./Ha (2011-12)

Power Consumption

- 1.36 K.W/haSlide5

Rainfall position 2013(23-09-2013)

Item

No.

DISTRICTS

EXCESS

RAINFALL

(+20% & Above)

42

JABALPUR,

SAGAR

, INDORE,

BETUL

,

BURHANPUR

,

GUNA

,

DAMOH

,

RAJGARH

,

HARDA

,

KHANDWA

,

SHIVPURI

,

VIDISHA

,

NARSINGHPUR

,

JHABUA

,

HOSHANGABAD

,

SHAJAPUR

, Agar,

ASHOKNAGAR

,

ALIRAJPUR

,

SEONI

,

BHIND

;

NEEMUCH

,

PANNA

, UJJAIN,

DEWAS

,

MORENA

,

CHHINDWADA

,

RAISEN

,

TIKAMGARH

,

CHHATARPUR

,

RATLAM

,

MANDSAUR

,

MANDLA

,

SEHORE,DHAR

, BHOPAL,

DATIA

,

REWA

,

KATNI

,

SATNA

,

BARWANI

,

KHARGONE

.

NORMAL RAINFALL

(+19% to –19%)

9

SHEOPURKALA, GWALIOR, SIDHI,

SHAHDOL, ANUPPUR

, BALAGHAT, DINDORI, SINGROLI, UMARIA .

NORMAL RAINFALL OF STATE (mm)

916.5

ACTUAL RAINFALL OF STATE (mm)

1260.8

% INCREASE

38%Slide6

1. (a) Area (Lakh ha.)Name of Crop

Normal

2011-12

2012-13

FFC

2013-14 TAR.

Wheat

40.78

52.61

54.59

57.00

Total Cereals

41.58

53.42

55.46

57.95

Gram

26.49

26.30

31.29

35.25

Lentil

5.29

5.87

5.72

6.25

Pea

1.97

2.32

2.82

2.90

Total pulses34.3235.1740.3845.05Mustard7.026.647.858.00Linseed1.300.911.101.20Total oil seeds8.327.558.959.20Sugarcane0.550.050.650.80Total Rabi84.7796.64105.44113.00

Rabi Programme Slide7

1. (b) Production (Lakh tonnes)Name of Crop

Normal

2011-12

2012-13

FFC

2013-14 TAR.

Wheat

70.88

145.44

161.25

190.10

Total Cereals

71.86

146.77

162.99

192.14

Gram

23.81

28.45

38.12

47.59

Lentil

2.55

2.16

3.34

3.91

Pea

0.90

0.82

1.95

2.15

Total pulses27.6231.8943.8054.13Mustard6.987.9010.3811.40Linseed0.530.470.570.66Total oil seeds7.508.3710.9512.06Sugarcane(Gur)2.371.973.354.24Total Rabi109.37189.00221.09262.56

Rabi prospects Slide8

1. (C) Productivity (kg./ha.)Name of Crop

Normal

2011-12

2012-13

FFC

2013-14 TAR.

Wheat

1738

2770

2959

3335

Total cereals

1728

2747

2939

3316

Gram

899

1083

1220

1350

Lentil

485

367

584

625

Pea

456

354

694

740

Total pulses80590710851201Total food grain 1311201721582424Mustard994119213251425Linseed408516518550Total oil seeds90211095181311Sugarcane4316397151635300

Total Rabi

1290

1956

2097

2324

Rabi prospects Slide9

9State Scenario of Total Pulses

Area

Lakh

ha. ,Production

Lakh

MT, Yield – Kg/ha

Year

Area

% increase over

07-08

Production

% increase over

07-08

Productivity

% increase over

07-08

2007-08

43.98


-

26.74

-


608

-


2008-09 *

46.37

5.43

37.138.7480031.582009-1047.959.0341.3454.6086241.782010-11 * * 52.0918.4430.2913.28581-4.442011-1247.598.2137.1839.0478128.452012-1353.2321.0350.4188.5294755.762013-14(T) 57.9531.7665.63145.44113386.35* Shortfall observed due to drought in 41 districts. * * Shortfall in yield during Rabi found due to frost in 37 districts. Slide10

10State Scenario of Rabi Pulses

Area

Lakh

ha. ,Production

Lakh

MT, Yield – Kg/ha

Year

Area

% increase over

07-08

Production

% increase over

07-08

Productivity

% increase over

07-08

2007-08

34.16


-

22.47

-


658


-

2008-09 *

36.72

7.49

32.21

43.3587733.282009-1037.9411.0736.2961.5095745.442010-11 * * 39.0114.2025.714.376590.152011-1235.172.9631.941.9790737.842012-1340.3918.2443.894.93108464.742013-14(T) 45.0531.8854.16141.03120182.52* Shortfall observed due to drought in 41 districts.* * Shortfall in yield during Rabi found due to frost in 37 districts.Slide11

11State Scenario of Chickpea

Area

Lakh

ha. ,Production

Lakh

MT, Yield – Kg/ha

Year

Area

% increase over

07-08

Production

% increase over

07-08

Productivity

% increase over

07-08

2007-08

26.62


19.26


724


2008-09 *

28.75

8.00

28.15

46.16

980

35.36

2009-1030.1413.2232.2167.24107047.792010-11 * * 28.888.4922.6617.657858.432011-1226.3-1.2028.4547.72108349.592012-1331.2917.5438.1297.92122068.512013-14(T) 35.2532.4247.59147.09135086.46* Shortfall observed due to drought in 41 districts.* * Shortfall in yield during Rabi found due to frost in 37 districts.Slide12

12State Scenario of Lentil

Area

Lakh

ha. ,Production

Lakh

MT, Yield – Kg/ha

Year

Area

% increase over

07-08

Production

% increase over

07-08

Productivity

% increase over

07-08

2007-08

5.22


2.21


423


2008-09 *

5.31

1.72

2.64

19.46

498

17.73

2009-105.2-0.382.7323.5352423.882010-11 * * 6.9933.912.02-8.60289-31.682011-125.8712.452.16-2.26367-13.242012-135.729.583.3451.1358438.062013-14(T) 6.2519.733.9176.9262547.75* Shortfall observed due to drought in 41 districts.* * Shortfall in yield during Rabi found due to frost in 37 districts.Slide13

13State Scenario of Soybean

Area

Lakh

ha. , Production

Lakh

MT, Yield – Kg/ha

Year

Area

% area increase over 07-08

Production

% production increase over 07-08

Productivity

%

productivity

increase over 07-08

2007-08

52.02

53.68

1033

2008-09

*

52.95

1.79

59.24

10.36

1120

8.42

2009-10

* *

54.54

4.84

64.28 19.751180 14.232010-11 * ** 55.52 6.7367.77 26.251222 18.302011-1257.8611.2364.9721.031124 8.812012-13****60.62 16.5382.64 53.951365 32.142013-14 E.63.8022.6587.7363.43137533.11* Drought affected 41 districts. ** Drought affected 38 districts*** Drought affected 37 districts & frost affected 46 districts.**** Hail storm affected 37 districts & frost affected 20 districtsSlide14

14State Scenario of Total Oilseeds

Area

Lakh

ha. , Production

Lakh

MT, Yield – Kg/ha

Year

Area

% area increase over 07-08

Production

% production increase over 07-08

Productivity

%

productivity

increase over 07-08

2007-08

65.63

63.32

965

2008-09 *

67.13

2.29

71.34

12.67

1063

10.16

2009-10* *

69.61

6.06

76.98

21.57

1106 14.612010-11 * ** 70.33 7.1681.33 28.441156 19.792011-1271.87 9.5178.97 24.721099 13.892012-13****75.69 15.3398.69 55.861304 35.13* Drought affected 41 districts. ** Drought affected 38 districts*** Drought affected 37 districts & frost affected 46 districts.**** Hail storm affected 37 districts & frost affected 20 districtsSlide15

15State Scenario of Rape-Mustard

Area

Lakh

ha. , Production

Lakh

MT, Yield – Kg/ha

Year

Area

% area increase over

07-08

Production

% production increase over 07-08

Productivity

%

productivity

increase over 07-08

2007-08

6.36

5.94

935

2008-09 *

7.57

19.03

7.99

34.51

1056

12.94

2009-10* *

7.70

21.07

8.05

35.521047 11.982010-11 * ** 7.27 14.318.19 37.881128 20.642011-126.64 4.407.90 33.001192 27.492012-13****7.85 23.4310.38 74.751325 41.712013-14 T8.0025.7911.4091.92142552.41

* Drought affected 41 districts. ** Drought affected 38 districts

*** Drought affected 37 districts & frost affected 46 districts.

**** Hail storm affected 37 districts & frost affected 20 districtsSlide16

Reason of Low ProductivityErratic and uncertain rains , Cold wave/ frost & hail storm.Lack of water availability for irrigation

.Lack of power supply during

critical stages of crops.

Low Seed replacement

& imbalanced use of fertilizers

.

Deficiency of

Micro nutrients,

specially

Zn

.

Difficulty in

operation of vertisol.

Problems of Wilt & root rots disease in chickpea & Lentil.

Delayed sowing in Rice-Chickpea/Lentil,

cropping SystemRising temperature

during grain formation period.

Non availability of

agricultural labour. Poor Farm Mechanization & Power consumption.

High percentage of

Small and Marginal farmers. Less purchasing capacity

of farmers due to increasing cost of input.

Non Availability of liquid bio fertilizer

16Slide17

Favourable conditions for Quality Pulse and Oilseed ProductionLooking to the heavy demand in Arab countries, Bold seeded export quality Lentil are being grown to augment yield . Gram and Lentil are more suitable for production in the rainfed areas of the state.Most pulse varieties released in the state are wilt resistant.KAK-2, JGK-3, Subhra are giving good return in comparison to bold seeded chickpea (dollar, local cultivar)

17Slide18

Policy initiatives by the State Formation of Agriculture Cabinet.Credit facility at 0 % interest to the farmer through cooperatives.Transfer of subsidy into the farmers' account.

Advance lifting scheme of fertilizer from 1st Aug. to 15th Sep. to ensure adequate availability of fertilizers without any interest.

30% Top up subsidy for

promoting irrigation by

sprinklers

.

Promoting Bullock drawn and selected power drawn implements, providing 7

5% including 25% top up subsidy

.

Distribution of

12.30

lakh

Soil health cards

.Established

9 Seed and

6 Fertilizer Testing Laboratories.

Feeder separation to ensure 8 hours quality energy

for agriculture. Fast completion of irrigation projects to

harness maximum potential .

RBC 6.4 Amended to help the farmers facing impact of natural calamities.

Convergence with MGNREGA

to energize in

Kapildhara wells irrigation by providing Diesel/Electric pumps

Creation of

new storage facilities.

Launching the revised food processing policy where the activities like collection, grading , packaging, waxing, storing & marketing brought under the definition of industry.

18Slide19

Strategies for enhancing Pulse and Oilseed ProductionAgronomic PracticesEmphasis on 100% seed treatment with fungicide & Ammonium Molybdate (1g/kg in chickpea) .

Production & distribution of quality seeds to increase SRR & VRR.

Promoting the

Resources Conservation Technologies

(RCT) such as use of Zero Tillage Seed Cum Fertilizer Drill, Rotavator, Laser Land Leveler and furrow irrigated raised bed (FIRB) planting.

Developing

irrigation facilities

to cover more area.

Promotion of large scale Ridge Furrow in Soyberan and pulses.

Promoting use of

Sprinklers

.

Use of

post emergence weedicides

as per recommendation. Emphasis given on

control measures for diseases, termites and rats. Encouraging

line sowing in place of Broadcasting.

Use of short duration varieties under Late sown condition

Emphasis on water conservation, watershed management & sprinkler irrigation.

Survey and

surveillance for disease and insect pest. Diagnostic Team-

Comprised of officials of State Department of Agriculture and Scientists.

19Slide20

Seed Replacement Rate (%)

CROPS

2007-08

2008-09

2009-10

2010-11

2011-12

2012-13

2013-14

Target

GRAM

2.90

4.51

6.83

10.39

12.22

12.86

17.05

LENTIL

0.77

0.73

1.70

3.35

3.77

4.05

5.79

PEAS

4.50

4.01

5.38

5.63

8.7711.2215.57MUSTARD16.8821.1927.7833.4748.6129.1836.99LINSEED0.970.550.791.651.041.652.5220Slide21

Old varieties and new alternative varieties

Crop

Old varieties

Alternative varieties to be

promoted/Recommended Varieties

Lentil

K-75

(1986),

JL

-1

(1991),

L-4076

(1993),

JL

-3

(2000)

,

IPL

-81

(2001),

RVL

-31

(2010),

IPL

-316

(2013)

Chickpea

(Medium)

JG-315

(1984),

JG-218(1996), ICCV-10(1992), VIJAY-(1994)JG-322(1999), JG-16(2001), JG-63(2006), JG-226(2007), JG-14(2009), Chickpea (Bold)JG-74(1991), VISHAL (1997), VIRAT(2002), JG-130(2002), JAKI-9218(2007), RVG-202(2012) Chickpea (Gulabi)GG-1(1999), JGG-1(1999)Chickpea(KABULI)ICCV-2(1993), ICCV-37 (2001), JGK-1(2002),KAK-2(2001), JGK-2(2007), JGK-3(2007), IPCK-2002-29(2009), IPCK 2004-29(2010), JSC-42(2012), JSC-40(2012), RVG-203(2013),Chickpea (LATE SOWING)JAKI-9218(2007), JG-14(2009), RVG-202(2012), RVG-203(2013), 21Slide22

MUSTARD

NAME OF THE VARITIES

>10 YEAR

YIELD POTENTIAL Kg/ha

NAME OF THE VARITIES

< 10 YEAR

YIELD POTENTIAL Kg/Ha

LAXMI (RH 8812)

750-900

JM - 1

1200-1600

PUSA BOLD

800-1000

JM - 2

1300-1650

MAYA (RK 9902)

900-1100

JM - 3

1400-1800

ROHINI

900-1200

PUSA MUSTARD – 27 (EJ-17)

1500-2000

VARUNA

1000-1300

RGN 73

1500-1950

SWARN JOYTI

(rh-19802)

1500-2100

22Slide23

LINSEEDNAME OF THE VARITIES

MORE THEN 10 YEAR

YIELD POTENTIAL Kg/ha

NAME OF THE VARITIES

LESS THE 10 YEAR

YIELD POTENTIAL Kg/ha

J – 23 - 10

350-550

INDRA ALSI - 32

350-400

JLS - 9

400-500

AJAD ALSI - 1

400-500

PADMINI (LMH – 62)

400-600

JLS - 27

450-600

PARWATI (LMH – 16)

400-600

KRATIKA (IA-18)

400-650

23Slide24

Seed Distribution Qty in Qtls

.

CROPS

07-08

08-09

09-10

10-11

11-12

12-13

13-14 (Target)

GRAM

62564

98989

144111

240095

257062

321830

450000

LENTIL

1318

1161

2695

7030

6634

6943

10000

PEA

9006

7868

8737

11173

162852532336000MUSTARD75958467975112166161381145415000LINSEED34120730862223745580024Slide25

Strategies for Seed Production Strengthening of established 2313 Cooperative seed production societies to facilitate Beej Sangh

.Seed production programme of Pulses will increase by 20%.

Linking farmers to the

seed production channel

by providing the breeder, foundation & certified seed at subsidized rate.

Capacity building

of the farmers by providing training.

Strengthening of

seed certification agency

by developing infrastructure, recruitment of additional staff and 4 Seed Testing Laboratories.

Developing

storage

, Transportation and

Post harvest facilities

.

Bonus for seed producer farmers.

Agriculture Credit (Cooperative Bank)

Year 2010-11 - 1903

crores

Year 2011-12 - 2817

crores

Year 2012-13 - 3659

crores

Year 2013-

14T

-

4200

crores

25Slide26

26Slide27

N P K consumption in Rabi

(Unit Kg./Ha.)

Year

N

P

K

TOTAL

2007-08

52.32

22.92

3.28

78.52

2008-09

47.26

24.13

2.74

74.13

2009-10

57.23

25.13

6.60

88.96

2010-11

62.77

33.08

5.65

101.51

2011-12

60.91

36.86

4.05101.822012-1359.1628.302.0589.502013-14 T64.2337.234.47105.9927Slide28

Consumption of Zinc Sulphate & Gypsum

(Unit -

M.T.

)

Year

Zinc

Sulphate

Gypsum

2007-08

1104

8044

2008-09

392

12499

2009-10

1310

22406

2010-11

3469

32941

2011-12

4038

12391

2012-13

6470

2044

2013-14

T

10000

5000

28Slide29

Irrigation A- Irrigation Department :Actual irrigated Area under different irrigation project :- 2009-10 - 08.03 lakh

ha 2010-11 - 08.90

lakh

ha

2011-12 - 16.34

lakh

ha

2012-13 -

20.20

lakh

ha

2013-14 T -

22.00

lakh

ha

Minor irrigation project completed in year 2011-12

- 309 Nos.

Minor irrigation project completed in year 2012-13 - 201 Nos.

Potential created during 2012-13

- 1.26 Lakh

ha. B-

Narmada Valley Development Authority :

Total irrigation capacity (Till March 2013) -3.88

lakh

ha

Irrigation project (Under Construction) -

10 Nos.

C

- Agriculture & Other Departmental Sources - 8.72

lakh

ha

29Slide30

Drip Irrigation in Gram30District - BurhanpurSlide31

Transfer of Technology (TOT)Innovative system for transfer of technology to 2.5 lakh farmers every year by covering 5000 farmers in each district in cluster approach through joint mobilization of scientists of KVK & ATMA.Formation of Farmer's interest group to develop Farmers producer's organization for dissemination of technology, Seed production, Input arrangement and Marketing to increase production and productivity.

To promote Pulses through Public Private Partnership in selected districts to achieve the production as well as value addition.

Reform of Extension technologies through farm field school, training, demonstration, exchange programme through study tour, transfer of technology through

Mobile SMS

Developing every block office as

Kisan Gyan Kendras

to

disseminate information to farmers

free of cost through internet

.

Other activities: Field day, Kisan Sangosthi, Farmer's Scientist ineraction, Kisan Mela. Comunity Radio Station.

31Slide32

Status Regarding Agenda IssuesSufficient infrastructure of production in distribution of quality of seed is availaible .Seed rolling plan has been preparedInvolvement of NSC,

SFCI, KRIBHCO

,

IFFCO

and state seed corporation are there.

Involvement of village

panchayats

in transfer of technology of oilseeds and maize production through effective interface with

KVKS

, other public extension organizations and NGOS, private sector etc are there.

Mass distribution of literature on improved genotypes and technology of oilseeds and maize production through effective interface with

KVKS

, other public extension organizations and NGOS, private sector are there.

Use of media such as TV and radio for projecting the advantages of oilseeds and maize production, including potential of varieties/hybrids, are there.

32Slide33

33Gram Cluster DemonstrationDistrict - BurhanpurSlide34

Strategy for increasing area under Pulses & OilseedsRabi fallow area will be covered under pulse crops.Nearly 3.00 lakh ha. covered by rice will be utilized for chickpea and lentil cultivation.

Introduction of moong and urd bean

before and after mustard & chickpea

in irrigated condition.

Intercropping of

chickpea with sugarcane & mustard.

Introduction of

chickpea

after cotton

.

Promotion of

chickpea

,

urd and

pea as utera in rice.

Preparation of district wise micro level action plan at the RAEO level for expanding the area of pulse and oilseed.

34Slide35

Strategies for enhancing Pulse Production Farm Mechnaization139 villages

have been developed as Yantradoot Villages

where farmers are encouraged to adopt mechanized farming.

917 custom hiring centers

have been established to facilitate farmers with power drawn implements.

Private entrepreneurs

are being encouraged by providing

subsidy up to

Rs

. 10

lakh

for each center. 67 such centers have been established so far.

Unique program of deep ploughing

has been started and subsidy of

Rs. 1500/- per ha is provided to farmers. So far

3 lakh

ha has been deep ploughed.To facilitate

timely land preparation in rabi

after paddy, to save cost of land preparation and achieve batter pulverization, the

rotavators are promoted. Every year about 5000 rotavators

are being purchased by farmers and are saving about 30 to 50% of cost of land preparation .

In rice-Chickpea

cropping pattern

zero tillage seed cum fertilizer drill

are promoted, through

top-up subsidy of 25%,

for timely sowing.

Spiral graders and seed treating drum

s will be provided in 20,000 villages.

35Slide36

Farm Mechanization in Yantradoot village

Deep Ploughing Sangoshthi Raised-Bed Planter

Spiral Grader Rotavator Raised-Bed Planting

36Slide37

RABI STRATEGY FOR PULSES

District with Low Yield & High Area

Area :-

000'Hac

, Prod :-

000'Tonnes

, Yield:- kg/

Hac

District

Average area & Yield

Proposed 2013-14

Area

Production

Yield

Area

Production

Yield

Ujjain

183.40

164.00

899

195.00

234.00

1200

Sehore

118.90

101.90

896

130.00

156.00

1200

Seoni90.2043.90852100.00115.001150Satna128.8044.00509160.00120.00750Mandla 63.804.5048180.0057.60720Dindori54.405.20473

70.00

49.00

700

Shajapur

202.20

89.60

471

240.00

168.00

700Slide38

RABI STRATEGY FOR PULSES

District with Low Area & High Productivity

Area :-

000'Hac

, Prod :-

000'Tonnes

, Yield:- Kg/

Hac

.

District

Average Productivity & Yield

Proposed 2013-14

Area

Production

Yield

Area

Production

Yield

Bhind

33.00

38.80

1763

40.00

76.00

1900

Gwalior

26.50

35.90

1566

31.50

58.28

1850Harda26.1039.70154336.5066.611825Neemuch25.2033.30135330.0048.001600Hoshangabad26.1032.70134665.00104.001600Singroli23.6062.00240228.60

98.67

3450

Chhindwara

67.00

155.20

2825

90.00

270.00

3000

Sheopurkala

8.30

13.90

1676

15.00

28.50

1900Slide39

Summer Mung Programme 2014Achievement in the year 2012 (FFC)Area Under Moong 0.22 Lakh ha. Productivity 510 kg./ha. Production 11220 MT Achievement in the year 2013

Area Under Moong 1.35 Lakh

hactare

Productivity 1116 Kg/Ha

Production (Estimated)

151000 MT

Target in the year 2014

Area Under

Moong

3.00 Lakh

hactare Productivity 1265 Kg/Ha

Production 3.79 Lakh MT

39Slide40

INTER CROPPING MOONG WITH SUGARCANESlide41

41Summer

Mung Programme 2014

Area ‘Ha.’, Prod. ‘Metric Ton’ and Prod. ‘Kg/ha

District

2013

2014

Area

Estt. Production

Yield

Area

Estt. Production

Estt. Yield

Hoshangabad

46150

71355

1550

70000

1,12,000

1600

Harda

30141

36192

1200

40000

52000

1300

Sehore

16845

18529

110030000375001250Narsinghpur 1194212539105015000180001200Seoni 34103410100010000115001150Rewa2000180090025000275001100Others1941268353521100001210001100Total135000

150660

1116

300000

379500

1265Slide42

Third Crop Summer Moong in District Harda (M.P.)Area (Ha.)

31100

Percentage of Cultivable land

17

Varieties

PDM

-139,

PDM

-11

HUM-12, HUM-16

SRR

51%

Productivity (Kg./ha.)

1450

Sale in Mandi

37000 Mt.

Total Production

45000 Mt.

Market Value

Rs

. 211

Crore

Seed Production

947 ha.

Seed Produced

1000Mt .Slide43

SUMMER MUNG43

Dist. HardaSlide44

Summer Moong at a Glance,Distt

.- Hoshangabad

Summer

Moong

Area

Ha

46150

Area covered

%

16

Productivity

Kg/Ha

1550

Production

MT

71535

Market Value

Crore

285

Varieties

PDM-139, TJM-3, HUM-1, TM-99-37, HUM-16

SRR

%

55

SEED PRODUCTION

Area

Ha

820.40

Production

MT

1296Slide45

45RABI STRATEGY FOR OILSEEDS

AREA:-000'HECTARE ,PRODUCTION:-000'TONNES, YIELD:-KG./HECTARE

Districts with High spread & low yield


Crop


DISTRICT

Avrege Area & Yield

2013-14

AREA

PROD.

YIELD

AREA

PROD.

YIELD

Musterd

TIKAMGARH

0.236

0.104

439

0.236

0.114

483

MANDSAUR

0.394

0.377

956

0.394

0.414

1052

NEEMUCH

0.2370.2229360.2370.2441030GWALIOR0.5630.5579890.5630.6121088SHIVPURI 0.5910.4257190.5910.467791TOTAL2.021.688332.021.85916LinseedSEONI 0.1040.0373590.104

0.041

395

MANDLA

0.044

0.014

324

0.044

0.016

356

CHHATARPUR

0.098

0.035

357

0.098

0.038

393

REWA

0.132

0.034

259

0.132

0.038

285

SIDHI

0.092

0.023

253

0.092

0.026

278

SINGROLI

0.074

0.026

357

0.074

0.029

393

SATNA

0.044

0.013

300

0.044

0.015

330

SHAHDOL

0.03

0.008

260

0.03

0.009

286

ANUPPUR

0.043

0.01

231

0.043

0.011

254

UMARIA

0.034

0.011

320

0.034

0.012

352

DINDORI

0.065

0.018

279

0.065

0.02

307

TOTAL

0.76

0.23

303

0.76

0.25

333Slide46

46RABI STRATEGY FOR OILSEEDS

AREA:-

000'HECTARE

,PRODUCTION:-

000'TONNES

, YIELD:-KG./HECTA

RE

Districts with Low spread & High yield


Crop


Avrege

Area & Yield

2013-14

DISTT

.

AREA

PROD.

YIELD

AREA

PROD.

YIELD

Musterd

RATLAM

0.07

0.105

1496

0.07

0.115

1646

Linseed

JABALPUR0.0110.0087270.0110.009800PANNA0.0150.0074660.0150.008513RATLAM 0.0130.01511590.0130.0171275BETUL0.0150.239159660.0150.26317563TOTAL0.0540.2749920.050.35491Slide47

Constraint And Strategies1) WILT - C.O.-Fusarium oxysporium f. sp.ciceri.At stage- Seedling to floweringSymptom- sudden drooping of leaflets& branchesSeed &Soil Borne

Resistant Varieties: JG 315, JG 322, JG 74, JG 226, JG 130, JG 16, JG 11, JG 12, JG 14, JSC 37, JSC 55, JAKI 9218, Vijay, Vishal, Digvijay (Desi) JK 1, JGK 2, JGK 3 (Kabuli), JGG 1 (Gulabi.

47Slide48

ROOT ROTSDry rootC.O. – Rhizoctonia bataticolaAt stage- Pod (temp. <30 degree C)Symptom- plants straw colour appearance - root becomes brittle and broken easilyCollar rootC.O. –

Sclerotium rolfsiiAt stage- Seedling (upto 45 days)Symptom- plants pulled very easily

-

mortality high in early sown crop

- favoured by high moisture and temperature

48Slide49

Management StrategiesDeep ploughing in summer (May, June)Crop rotation for minimum 3 yearsMild irrigation at the onset of disease.

Incorporation of Trichoderma viride

@ 5kg/ ha multiplied on decomposed FYM.

Seed treatment with

Trichoderma

viride

+

Carboxin

@4+1g/kg seed or

Carbendazim+Thiram

(1:2) @ 3g / kg seed

Intercropping-minimize wilt incidence (Chickpea + Linseed)

49Slide50

Helicoverpa - a menace in chickpea cultivationPest monitoring- Installation of pheromone trapTrap Crop- Marigold (At borders)Bird percher- 30-40/ haIntercropping – Coriander (10:1)

Spray of NSKE 5% NPV 250 LE/Indoxacarb 14.5 SC 500 ml/Emmamectin Benzoate 5% G 200 g/ha (Starting spray from flower initiation to pod development when 1-2 larvae/m length)

50Slide51

Lentil (Foliar disease)RustSpray- Dithane M 45@ 2.5/lt water at 15 days intervalPowery MildewSpray – wettable sulphur @ 3g/ lt at 15 days interval

Resistant Varieties for the state: K 75 (Malika), Lens 4076, IPL 81, (Noori) IPL 406

51Slide52

Recommended dose of fertilizer: Chickpea - 20 kg N, 40-60 kg P2O5, 20 kg S, 25 kg ZnSO4, 5 ton FYM/ha - Ammonium Molybdate- 1 kg (Basal application) or 1g/kg seed (seed treatment) - Spray of 2% urea/ DAP at flowering stage (70 DAS) and 10 days thereafterLentil

- 20kg N, 30-40 kg P2)5, 20 kg S/ ha, 15 kg ZnSO4 as Basal application, 5 ton FYM/ ha.

52Slide53

DRIP IRRIGATION IN GRAM “AN INNOVATION”Farmer - Shri Santosh S/o ShrI HarinarayanVillage -Chhoti, District- HardaCell No. -+ 91-9926370106Method - Raised Bed (120 cm.)Row - 90x90 cm ,

Plant -15x15 cmCultivar - Dollar (Bold Seed)Seed rate - 20 Kg. /acre

Sowing - Dibbling method

Nutrient management through drip system ( fertigation)

Yield -

48 q/ha.Slide54

Shri Dilip Singh Gond Village-Kachhwar, Block- Pali, Dist.- Umaria (M.P.)Area - 1.00 acreSeed Rate - 100 g/acreRow to Row Distance - 90 cm

Plant to Plant Distance - 90 cmWeed Control - Hand weeding with Kudal & Conoweeder(2-3)Production

- 19.00 Qtl/acre.

Traditional - 05.00 Qtl/acre.

Cost of Cultivation - Rs. 16127/-

Total Income - Rs. 63649/-

Net Income - Rs. 47522/-

Success Story – SRI

in Mustard

(System of Root Intensification in Mustard)Slide55

Mustard Cultivation by Innovative practiceSlide56

Success Story – SWI(System of Root Intensification in Wheat) Shri Bahadur Singh Gond

, Village-Kachhwar, Block- Karkeli,

Dist.- Umaria (M.P.)

Area - 1.00 acre

Seed Rate - 10 Kg/acre

Row to Row Distance - 20 cm

Plant to Plant Distance - 20 cm

Weed Control - Conoweeder(2-3)

Production

- 23.00 Qtl/acre.

Traditional - 10.00 Qtl/acre.

Cost of Cultivation - Rs. 15220/-

Total Income - Rs. 38384/-Net Income - Rs. 23165/-Slide57

Wheat Cultivation by Innovative practice of SWISlide58

Best Practices adopted by the State Timely sowing with Seed Treatment. Increasing Seed Replacement Rate .

Use of New varieties.

Balanced & integrated

use of fertilizer.

Use of

Zinc

Sulphate

in Zinc deficient soils.

Application of

Gypsum

to meet out

Sulphur

deficiency. Promoting

INM and

IPM technology.

Promoting application of FYM

/ Green manuring

for improving soil health.

Distribution of Soil Health Card to track soil health.

Campaign for III

rd crop (

Moong) in command area.

58Slide59

Best Practices adopted by the State Water management and augmentation of Ground Water. Promoting judicious use of irrigation through sprinkler

.

Balram

Talab

for

life Saving irrigation.

Frequent irrigation

in case of abrupt

rise in temperature.

Establishment

Farm Field School on large Scale.

Conducting cluster demonstration

on Production Technology. Emphasis on use of

improved farm machinery.

Resource conservation

Technologies (RCT).

Transfer of technology through

Kisan Mitra

& Didies

. Cont..

59Slide60

60Interventions to increase Pulses production


(Financial Rupees in Lakh)

Interventions

Unit

Achievement 2012-13

Target 2013-14

Phy

Fin

Phy

Fin

Distribution of certified Seeds


(a) For varieties less than 10 years

Qtl

14337

210.97

22000

484.00

(b) For varieties more than 10 years old

Qtl

32839

348.69

118250

1419.00

Demonstrations

   (a) Cluster Demonstrations Ha.743573171.26732003660.00Integrate Nutrient Management   MicronutrientsHa.88820444.10100000500.00(b) Lime/Gypsum/80% WG SulphurHa.23664121.3330000225.00(c) Rizobium culture / PSB

Ha.

83393

73.25

100000

100.00

Integrated Pest Management (IPM)


(a) IPM Package

Ha.

104045

780.34

80000

600.00

(b) Distribution of NPV

Ha.

5573

13.09

20000

50.00

(c) Distribution of P.P. Chemicals

Ha.

76765

383.31

80000

400.00

(d) Weedicides

Ha.

4835

25.27

15064

75.32Slide61

InterventionsUnit

Achievement

2012-13

Target 2013-14

Phy

Fin

Phy

Fin

Resource Conservation

Technologis

/ Tools :


(a) Knap Sack Sprayers

Nos.

36501

305.41

12000

360.00

(b) Zero Till Seed Drils

Nos.

2

0.30

40

6.00

© Multi Crop Planters

Nos.

20

3.00(d) Seed DrillsNos.1788263.703160474.00(e) Zero Till Multi Crop PlantersNos.203.00(f) Ridge Furrow PlantersNos.203.00(g) RotavatorsNos.2202659.212500750.00Efficient Water Application Tools :   (a) Distribution of Sprinkler setsHa.8550640.9311000825.00(b) Incentive for Mobile Sprinkler RaingunsNos.43537.51507.50(c) Incentive for pump sets Nos.5877557.422000200.00(d) Pipe for carrying water from source

Nos.

16894

244.03

11523

1200.00

Cropping System based trainingsNos.

16867

107.85

1750

245.00

Project

Management Team


116.35


0

125.68

Local Initiatives

:


1290

193.50

0

484.50

Total

Finacial


10893.82


12200.00

61

Interventions to increase Pulses production


(

Financial Rupees in

Lakh

)Slide62

Interventions to increase Pulses productionCluster demonstration of PulsesActivity

Amount (

Rs

.)

Cost of seed and seed treatment (

Rhizobuim

Culture,

PSB

Culture, Fungicide)

1800

Gypsum

1000

Micronutrient

500

Weed Management

600

PP Chemical

700

Crop

Cutteing

and Record Management and Honorarium to Progressive farmer of the cluster @

Rs

. 2000/- per Month for six Month

150

Visit of Scientists/Officers of

GOI

/

PMTs

/State Official etc. excluding TA/DA of any kind but for hiring Taxi,

POL

etc.

200Field Day/Kissan Goshthi50Total5000Slide63

Interventions to increase Pulses productionProvision under A3P for One Ha. As 100% Assistance(Cost in

Rs.)

Item

Quantity

GRAM

LENTIL

Seed

Minikit

@ 0.2% area/ ha(lentil @ 8 kg and Gram @ 16 kg/ha)

800

480

Gypsum

250 Kg

1200

1200

Micro Nutrient (Zinc Sulphate, Borex, Ferrous Sulphate, Micro Nutrient Mixture)

25 Kg

1000

1000

Rhizobium culture

Three Packet of 200 gm Each= 600

gms

75

75

PSB

Culture

Three Packet of 200 gm Each= 600 gm

75

75

Urea (For Foliar Spray)

10 Kg

6060Fungicide for seed treatment Thiraum 2 grm+1 grm Carbandzim/ kg of seed200200Insecticide/ Fungicide/ Biopesticides/ BioagentNeed based chemicals12801000Weedicides2.5 ltrs740740E-pest sureilanceSeperate programme170170Total56005000Slide64

Interventions to increase Oilseed production ACHIEVEMENT 2012-13 & TARGET 2013-14 (

ISOPOM)

No.

Component


Unit


Subsidy


OIL SEED

Achievement 12-13

Target 2013-14

Phy

.

Fin.

Phy.

Fin.

1

SEED


(a)

Purchase of Breeder Seed

Qutl

0.05

1767.99

112.0954532.71(b)Production of Foundation SeedQutl0.00541670275.37465046.50(c)Production of Certified SeedQutl0.005171211722.3762100621.00(d)Distribution of Certified SeedQutl0.005478630.39971671166.002Transfer of Technology    


(a)

Block Demonstration


Soybean

Hac

.

0.03

23203.1

570.69

13500

405.00


Sesamum

Hac.


340

3.35

0

0.00


Niger

Hac.


494

4.65

0

0.00


Repeseed & Mustard

Hac.


896.667

16.34

3375

67.50

(b)

Farm Field School(IPM)

Hac.

0.2268


(c)

Bio - Intensive Demonstration (IPM)

Hac.


Soybean

Hac.

0.0043

71953

351.25

41822

179.00


Musterd

Hac.

0.0093

12824

127.67

4890

45.48Slide65

Interventions to increase Oilseed production ACHIEVEMENT 2012-13 & TARGET 2013-14 (

ISOPOM)

No.

Component


Unit


Subsidy


OIL SEED

Achivement 2012-13

Target 2013-14

Phy.

Fin.

Phy.

Fin.

(d)

Farmers Training

Nos.

0.15

152

21.16

50

7.50

(e)

Officer Training

Nos.

0.16

54

8.64

254.003Non -Seed inputs       aP.P. Equip. Manually OperatedNos0.0081260294.26380030.40b  Power OperatedNos.0.023677.63

338

6.75

(c)

Distribution of

P.P.Chemicals

Hac.

0.005

154771

707.59

100188

500.94

(d)

Distribution of Weedicide

Hac.

0.005

3304

9.51

17280

86.40

(e)

Distribution of Rhizobium Culture/ PSB

Hac.

0.001

63238

57.20

48600

48.60

(f)

Distribution of Micronutrient

Hac.

0.005

16723

56.20

2700

13.50

 h

Farm Impliment Hand/ Bullock drawn

Nos.

0.025

40

0.41

100

2.50


Power Opreted

Nos.

0.15

25

3.42

25

3.75

(i)

Distribution of Sprinklar set

Nos.

0.075

14553

1111.59

8787

659.00

(j)

Pipe for Carrying Water Source to the Field

Nos.

0.15

17331

2637.16

9133

1369.95

4

Innovative Component


(a)

Multicrop

Planter

Nos.

0.03

3

0.45

0

0.00


Rotavator

Nos.


77

23.08

40

12.00


Multicrop Thresher

Nos.


26

3.52

12

1.80


Grand Total


6979.39


5385.28Slide66

Specific Issues & SuggestionAssistance on purchase of Breeder seed and production of foundation and certified seed should be provided.Shortage of disease resistant varieties of Gram & Lentil.

Special programme on Kabuli gram production & procurement for export purpose.

Assistance on the

fertigation

system

for Gram crops

Raising the subsidy on irrigation water saving devices up to 75%.

75% financial assistance should be provided to SC/ST & small Marginal farmers in

GOI

schemes.

The

minimum support price

of chickpea and lentil fixed by the Government is

less than the market price.

The cultivation of these crops are

very risky

, thus

provision of bonus on

MSP

by the Government may be initiated.

66Slide67

Seed treatment with chemical @ 2gm/kg and bio pesticide like trichoderma @ 5gm/kg of seed. To popularize seed treatment among the farmers assistant of Rs. 100/-/ ha. Or 50% of the total cost whichever is less will be given.To save crops from soil born diseases and insects, soil treatment with chemicals is necessary. Thus assistant on soil treatment Rs. 500/-/ha. or 50% of cost is proposed.Use of liquid Rhizobium and /Phosphorus solubilising bacteria will help in reducing the use of chemicals like nitrogenous and phosphorus fertilizer. To popularize the liquid form of culture, assistant of Rs

. 250/-/ha. Or 50% of the total cost which ever is less is proposed.Foliar spray of 2% Urea/DAP on pulse crop, financial assistant of

Rs

.

250/-

per

hac

. Or 50% of the cost whichever is less is proposed.

Specific Issues to be added in ongoing schemesSlide68

The present and proposed assistance in NFSM

Name of Machine equipment

Present form of assistance

Present Cost in

Rs

.

Proposed form of assistance

Rotavator

Rs

. 30000/ Machine or 50% of the cost which ever is less.

90000

Rs

. 40000/ Machine or 50% of the cost which ever is less.

Diseal Pump Set

Rs. 10000/Machine or 50% of the cost which ever is less.

30000

Rs

. 15000/ Pump Set

or 50% of the cost which ever is less.

Seed Grader

-

6000

Rs

. 2000/ Seed Grader or 50% of the cost which ever is less.

Cultivator

-

50000

Rs

. 20000/ Cultivator

or 50% of the cost which ever is less.

Reversible two bottom MB Plough

-60000Rs. 30000/ Plough or 50% of the cost which ever is less.Drip System (Arhar, Lentil and Gram)-100000Rs. 50000 or 50% of the cost which ever is less.Slide69

Issues for ResearchDevelopment of resistant variety for Helicoverpa in pulsesDevelopment of multiple disease resistant varieties in pulses

Development of drought tolerance varieties in pulses Development of low/high temperature tolerant varieties of

pigeonpea

, chickpea, Lentil & pea.

Development of water-logging to tolerant & extra early maturing

Pigeonpea

(varieties & hybrids)

Development of short duration (60-65 days)

YVM

resistant varieties of

mung

/

urd bean

Development of bold seeded lentil varieties for export purpose

Development of vascular wilt and sterility mosaic resistant Pigeon pea.Development of extra large seeded Kabuli Varieties of chickpea for export.

69Slide70

Outstanding AchievementsGovernment of India awarded Krishi Karmanya Award 2011-12, in Ist category of Total Foodgrain Production,

honoured by Hon'ble President of India. Hon'ble President awarded the State for achieving

more than 18% Agriculture Growth

in the year 2011-12.

Under the

Agriculture leadership awards

the state honored by

Best Agriculture State Award 2012.

State honored by Govt. of India and Indian Chambers of Commerce for

increasing the productivity

through

Best Agriculture practices and Farm Mechanization

in the year 2012.

70Slide71

Krishi Karman Awardee 2011-12 Smt. Radha Bai Dubey

(Village-Pandajhir,Distt.Raisen

)

Gram

-

JG-11

Yield

- 2300 kg/ha

Award

-

Rs

One Lakh

Package of Practices-Timely sowing by seed cum fertilizer drill,

Seed treatment with Trichoderma, use of

vermicompost, Rhizobium & P.S.B, culture

Use of 100 Kg/ha. DAP. Timely Irrigation with Sprinkler (1+2), Use of pheromone trap & bio pesticide.

71Slide72

72THANK’SSlide73

Betel-vine cultivation under RKVY

RASHTRIYA KRISHI VIKAS YOJANA,

Madhya Pradesh

73

Department of Farmer Welfare & Agriculture Development , GOMP, Bhopal. Slide74

74RASHTRIYA KRISHI VIKAS YOJANA, MADHYA PRADESH

Overall Financial Status of RKVY in MP (Aug- 2013)

Rs in Crores

S.N

Year

Release by GOI

Expenditure

U/C Sent to GOI

Remark

1

2007-08

101.62

101.62

101.62

2

2008-09

146.05

146.05

146.05

3

2009-10

247.44

247.44

247.44

4

2010-11

559.18 559.18559.1852011-12 Normal229.41229.41224.78Sub- Scheme168.96168.96163.01Total 11-12

398.37

398.37

387.79

6

2012-13

Normal

388.54

379.47

314.66

Sub-Scheme

59.59

59.59

53.68

Total 2012-13

448.13

439.06

368.34Slide75

75RASHTRIYA KRISHI VIKAS YOJANA, MADHYA PRADESH

Financial Status of RKVY in MP During 2013-14

Rs in crore

S.N

Year

Allocation

Release by GOI

Expenditure

U/C Sent to GOI

1

Normal

434.79

199.21

89.73

61.08

2

Sub- Scheme

Nutri cereals

1.36

0.68

0.57

0.57

RADP

10.00

5.00

1.39

1.39

Vegetable cluster6.003.000.00.0NMPS- 25.0012.509.129.12Nutri Farms48.0024.008.038.03Accelerated fodder Development programme (AFDP)20.0010.000.00.0Total Sub Scheme

110.36

55.18

19.11

19.11

Grand Total

545.15

254.39

108.84

80.19Slide76

76RASHTRIYA KRISHI VIKAS YOJANA, MADHYA PRADESH

Steps taken to increase allocation

Established

Krishi cabinet to take rapid dicisions for the development of

agriculture sector

H'ble chief minister of the state has also started quarterly review of all the

schemes being implemented in each department.

Introduction of quarterly budget pattern so as to ensure quarterly utilization of

funds.

The schemes under state plan have been made more rationalized and demand

driven so that the funds can be fully utilized.

State level sanctioning committee under the chairmanship

of

APC

, is analyzing

all projects prepared for

SLSC

.

The project under RKVY have been selected in such a way so that planned

target can be achieved with in the fiscal year.

Strong monitoring of expenditure through software of commissioner treasury &

Accounts, every month.

Review of expenditure & Physical progress by state government every month.


Slide77

Strategy for Districts with Low Spread &High Productivity (MUSTARD)

Name of the District

Area in 000 Ha.

Productivity in

Kg/Ha

P.P.Chemical

Micro nutrients

Sprinkler set

Pipe line

Weedicides

Phy

Fin

Phy

Fin

Phy

Fin

Phy

Fin

Phy

Fin

Damoh

0.9

1016

100

0.50

500.381007.5010015.00600.30Raisen0.910231000.50300.23806.008012.00400.20Indore0.2985500.25500.381007.5010015.00800.40Seoni1.08181500.75250.19755.637511.25300.15Dhar0.3714500.25500.381007.5010015.00600.30Slide78

Strategy for Districts with High Spread & Low Productivity (MUSTARD)

Name of the District

Area in 000 Ha.

Productivity in Kg/Ha.

seed distribution

Demonstration

I.P.M.

Sprinkler set

Pipe line

Phy

Fin

Phy

Fin

Phy

Fin

Phy

Fin

Phy

Fin

Tikamgarh

44.3

352

250

3.00

150

3.75

3503.2615011.2520030.00Dindori25.85172002.401503.753503.2615011.2520030.00Shivpuri74.87734004.802506.255004.6525018.7550075.00Slide79

Strategy for Districts with High Spread & Low Productivity (MUSTARD)

Name of the District

Area in 000 Ha.

Productivity in Kg/Ha.

Weedicides

P.P.

Equipment Manually Operated

P.P. Chemical

Training

Phy

Fin

Phy

Fin

Phy

Fin

Phy

Fin

Tikamgarh

44.3

352

80

0.40

125

1.00

250

1.25

6

90.00

Dindori

25.8

517

800.401000.802501.257105.00Shivpuri74.87731000.501501.204002.008120.00Slide80

Strategy for Districts with Low Spread & High Productivity (LINSEED)

Name of the District

Area in 000 Ha.

Productivity in

Kg/Ha

P.P.Chemical

Micro nutrients

Sprinkler set

Pipe line

Weedicides

Phy

Fin

Phy

Fin

Phy

Fin

Phy

Fin

Phy

Fin

JABALPUR

1.2

0.29

6

0.03

100.08151.13131.95200.10PANNA4.52.6250.03120.09100.75152.25250.13RATLAM1.00.4030.02150.11120.90111.65300.15BETUL1.10.6440.02160.12130.98131.95180.09Slide81

Strategy for Districts with High Spread & Low Productivity (LINSEED)

Name of the District

Area in 000 Ha.

Productivity in Kg/Ha.

seed distribution

Demonstration

Sprinkler set

Pipe line

Phy

Fin

Phy

Fin

Phy

Fin

Phy

Fin

SEONI

11.9

6.72

12.5

0.15

20

4.0

10

0.75

11

1.65

MANDLA3.45.1516.60.20255.0120.90101.50CHHATRPUR11.96.9515.30.18153.0110.83121.80REWA8.54.5110.50.13183.6141.05121.80SIDHI6.52.8010.50.13163.2120.90101.50SIGROLI8.74.3611.60.14153.0130.98101.50SATNA5.01.5312.50.15

16

3.2

10

0.75

11

1.65SHAHDOL

2.7

0.77

10.2

0.12

18

3.6

14

1.05

12

1.80

ANUPPUR

3.2

1.35

8.5

0.10

17

3.4

13

0.98

10

1.50

UMARIYA

6.4

3.64

7.6

0.09

16

3.2

12

0.90

10

1.50

DINDORI

11.3

5.99

5.7

0.07

15

3.0

10

0.75

12

1.80Slide82

Strategy for Districts with High Spread & Low Productivity (LINSEED)

Name of the Distt.

Area in 000 Ha.

Productivity in Kg/Ha

Weedicides

P.P.

Equipment Manually Operated

P.P. Chemical

Training

Phy

Fin

Phy

Fin

Phy

Fin

Phy

Fin

SEONI

11.9

6.72

10

0.05

5

0.04

8

0.04

2

30.0

MANDLA

3.4

5.15

120.0650.04100.05115.0CHHATRPUR11.96.95100.0560.05120.06230.0REWA8.54.51100.0540.03140.07345.0SIDHI6.52.80100.058

0.06

13

0.07

2

30.0

SIGROLI

8.7

4.36

11

0.06

7

0.06

12

0.06

1

15.0

SATNA

5.0

1.53

12

0.06

6

0.05

11

0.06

3

45.0

SHAHDOL

2.7

0.77

13

0.07

5

0.04

10

0.05

2

30.0

ANUPPUR

3.2

1.35

12

0.06

4

0.03

14

0.07

2

30.0

UMARIYA

6.4

3.64

10

0.05

3

0.02

10

0.05

1

15.0

DINDORI

11.3

5.99

11

0.06

2

0.02

10

0.05

1

15.0Slide83
Slide84

STRATEGY FOR ENHANCING CHICKPEA AND LENTIL PRODUCTION DURING RABI 2013-14

19

th

September 2013

Dr.

D.N.

Sharma

Director

Farmer Welfare and Agriculture Development

Bhopal Madhya Pradesh

84Slide85

1. (a) Area (Lakh ha.)Name of Crop

Normal

2011

2012 FFC

2013

TARGET

2013 ESTT.

Paddy

16.79

17.03

17.67

17.70

18.43

Jowar

6.05

3.61

3.07

3.00

2.64

Maize

8.69

8.60

8.45

8.45

10.03

Tur

3.10

5.36

5.31

5.40

5.32

Urd5.356.016.416.356.40Moong0.780.810.880.901.12Total pulses9.6012.4212.8412.9013.03Soybean46.4757.8660.6262.3563.80Total oil seeds51.6764.3266.7468.4569.63

Cotton

5.97

6.24

6.27

7.35

6.21

Total Kharif

104.05

116.90

119.26

122.00

123.80

Kharif prospects Slide86

1. (b) Production (Lakh tonnes)Name of Crop

Normal

2011

2012 FFC

2013

TARGET

2013 ESTT.

Paddy

14.89

22.80

30

.22

42.48

40.55

Jowar

6.54

5.47

5.43

5.10

4.75

Maize

12.56

13.24

22.90

25.35

29.09

Tur

2.27

3.38

3.51

6.48

5.32Urd1.881.632.654.453.20Moong0.250.200.350.450.48Total pulses4.485.286.6111.509.07Soybean46.6864.9782.6487.2987.73Total oil seeds49.8870.6087.7493.0193.23

Cotton

7.30

5.94

6.238.09

6.83

Total Kharif

99.28

128.12

163.86

191.43

188.64

Kharif prospects Slide87

1. (C) Productivity (kg./ha.)Name of Crop

Normal

2011

2012 FFC

2013

TARGET

2013 ESTT.

Paddy

887

1413

1807

2400

2200

Jowar

1080

1541

1809

1700

1800

Maize

1445

1540

2710

3000

2900

Tur

733

628

659

1200

1000

Urd352271413700500Moong315227381500425Total pulses907425515891697Soybean9651124136514001375Total oil seeds12231098131513591339

Cotton

954

976

1059

1100

1100

Total Kharif

887

1096

1374

1569

1524

Kharif prospects Slide88

SOIL TYPESSlide89

89Other strategiesTo

implement the programme only in focused districts with backstopping by ICAR will

be followed.

Identify fallow bunds for cultivation of oilseeds like sunflower, safflower, linseed and rapeseed mustard during rabi season are being followed.

Emphasis being given on seeds priming techniques.

To augment production of quality seeds with varietal replacement are being made.

Campaign for timely sowing of rapeseed mustard, chickpea & pea which helps in escaping from major disease and pest will be made.