/
USA Agriculture & Food USA Agriculture & Food

USA Agriculture & Food - PowerPoint Presentation

debby-jeon
debby-jeon . @debby-jeon
Follow
473 views
Uploaded On 2017-03-16

USA Agriculture & Food - PPT Presentation

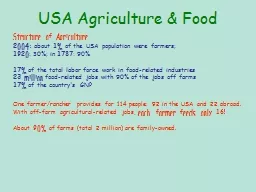
Structure of Agriculture Since 2004 less than 1 of the USA population were farmers 1920 30 in 1787 90 17 of the total labor force work in foodrelated industries 23 million ID: 525069

usa food amp agriculture food usa agriculture amp farm million largest source farmers farms crops billion received year percent federal feed 000

Share:

Link:

Embed:

Download Presentation from below link

Download Presentation The PPT/PDF document "USA Agriculture & Food" is the property of its rightful owner. Permission is granted to download and print the materials on this web site for personal, non-commercial use only, and to display it on your personal computer provided you do not modify the materials and that you retain all copyright notices contained in the materials. By downloading content from our website, you accept the terms of this agreement.


Presentation Transcript

Slide1

USA Agriculture & Food

Structure of Agriculture

Since 2004: less than 1% of the USA population were farmers; 1920: 30%; in 1787: 90%17% of the total labor force work in food-related industries23 million food-related jobs with 90% of the jobs off farms17% of the country's GNP

One farmer/rancher provides for 114 people: 92 in the USA and 22 abroad.

With off-farm agricultural-related jobs,

each farmer feeds only 16!

About

90%

of farms (total 2 million) are family-owned.Slide2

USA Agriculture & Food

Most U.S. farmers produce crops for feed and fuel (biofuels) rather than as food directly.

Feed and FuelWhereas 45% of the global crops are for feed and fuel, 73% of U.S. and 82% of Midwest crops are used for feed and fuel (purple color on the map).FoodIn contracts, whereas 55% of global crops are produced for direct food consumption, only 27% of U.S. and 19% of Midwest crops are used for food (green color on the map).Slide3

USA Agriculture & Food

2%

of farms with $500,000 or more sales operate 13% of the land6% of all landowners control over 50% of farmland[in Venezuela: fewer than 5% of all landowners control over 75% of farmland]2% of farms with $500,000 or more sales generate 50% of gross farm sales9% of farms produce 73% of

farm salesSlide4

USA Agriculture & Food

10% of the largest & richest farms receive 75% of

federal farm program paymentsBetween 2007 and 2011, 2,300 farm operators, who grew no crops of any kind, received $3 million!Between 2008 and 2012, $10.6 million was paid to farmers who were dead for over a year!Overall, farm subsidies account for about $20 billion per year from taxpayers.In 2014, Congress abolished direct farm payments based on land ownership, but farmers now get more subsidies crop insurance and new payments based on past crops and productivity! Things really never do change as long entrenched special interests control Congress.Slide5

Federal government farm subsidies per capita by county

20% of the largest farms received 80% of federal farm program payments.

Notable farm-subsidy recipientsRepublican from Iowa since 1981 Slide6

USA Agriculture & Food

Vertical Integration in Agriculture: production -> consumption

An Example: ConAgra -- vertical integration and contract farmingIn the 2004 Presidential election, 82% of ConAgra’s political contributions ($197,252) went to the Republican Party [Source: The Hightower Lowdown, January 2005] top four firms processing of beef, pork, broilers, sheep, turkeys, and seafood. second largest food firm in the USA; fourth largest in the world with operations in 32 countries.D) Retail Brands: Country Pride (fryers), Banquet

,

Beatrice Food

(TV dinners and pot pies)

C) Transportation: owns 1,00

barges

, 2,000

railroad cars

, 100

grain elevators

B) Feed and Farm Chemical Supplies:

1) largest

fertilizer

producer and agricultural chemicals

2) produces its own poultry and livestock

feed

A) Production:

1) owns and operates

chicken hatcheries

2)

contracts

with “independent” farmers to raise chickens

3) processes chickens in its own

slaughterhousesSlide7

USA Agriculture & Food

5

largest livestock commodity processors’ share of the US market10 companies supply more than 50% of all food and

drinks

sold in the USA.Slide8

USA Agriculture & Food

4 largest plant commodity processors’ share of the US marketSlide9

USA Agriculture & Food

Advertising and Creating Foods

1) Pringles (first introduced in 1973) by Proctor & Gamble Problem: what is wrong with potato chips? 150 marketing research surveys: Consumers did not like broken, irregular, stale, and burnt potato chips Solution: use small and irregular potatoes – lower costs; lower value to farmerscombine with 6 chemicals (color, shelf life, etc.) and sugarmush poured into potato chip-shaped moldspackage in tennis-ball like cans (20% of the total product’s cost)spent $5.4 million in advertisements; captured 75%+ of the market In 2009, Pringles argued before Britain’s Court of Appeal that the chips did not contain enough potatoes to pay the value-added tax!! In 2012, Pringles was sold for $2.5 billion to

Kellogs

, which is the fourth largest brand in the world.

2)

Fresh Horizons

advertised as

400% more fiber

than standard breads

third largest ingredient is pulverized wood pulp

Canada banned it; FDA is testing if wood pulp is dangerous to health

3)

Miracle Whip

, advertised as the taste of mayo with half the fat: now contains

less soya oil

, which fattening and expensive, and

more water

, which is slimming and cheap!Slide10

USA Agriculture & Food

Consequences

: farmers received 12¢ in 2012 for each food dollar spent; 35¢ in 1984; 40¢ in 1949 Annual return on investments: for farmers 4-5 percent vs. for food-processors about 20 percentItem

Retail Price

Farmer's Share

Box of cereal

$3.71

4.6 cents

Loaf of bread

$1.39

5 cents

Sirloin steak (1 lb.)

$4.39

68 cents

Cheddar cheese (1 lb.)

$5.91

$1.05

Potato chips (9 oz.)

$1.99

3.3 cents

Head of lettuce

$1.29

9 cents

Bacon (1 lb.)

$3.29

40 cents

Source: Figures based on Washington-area food prices and the U.S. Department of Agriculture

and the

Small

Farm Center

.

Yet when asked to compare

financial rewards

received by different levels of

USA

food production system,

43 percent of the respondents thought

food processors

received the most,

32 percent thought

farmers receive the most

, and

24 percent thought

supermarkets

received the most financial reward.

Source:

American Farm Bureau

FederationSlide11

USA Agriculture & Food

best value

worst valueSlide12

USA Agriculture & Food

p

oorer countries

richer countriesSlide13

USA Agriculture & Food

Source:

“The New Face of H

unger,”

National Geographic

, August 2014,

http

://www.nationalgeographic.com/foodfeatures/hunger/Slide14

USA Agriculture & Food

Source:

The

New

Face

of H

unger,”

National Geographic

, August 2014,

http

://www.nationalgeographic.com/foodfeatures/hunger/Slide15

USA Agriculture & Food

Federal government subsidies to food corporations

McDonald got $1.6 million to help advertise their fast food products overseasSunkist got $78 million since 1986 to promote orange juice in AsiaAll U.S. agribusinesses and food corporations receive about $6.2 billion per year in federal subsidies (direct payments and indirect through federal taxes).Food and Fun and Health1997 giveaway Teenie Beanie Babies increased sale for

McDonalds’ Happy Meals

from 10 million a week to 10 million a day!

[What were the health and toy-cost consequences?]

96

% of USA school children can identify

Ronald McDonald

; only Santa Claus

scored

higher

!

[But

Joe Camel

(cigarettes) was banded because of its association with bad health!

N

early

as many

six-year

olds

correctly associated "Joe

Camel"

with

cigarettes as

they could link

Mickey Mouse

to the Disney Channel.]

average

four oz. hamburger patty consists of beef or fat tissue

from

between

55 to 1,082 cattle

.

[Source: Colorado State University study, cited in

The Economist

, 9 March 2002

]Slide16

USA Agriculture & Food

Food Waste around the World

40% of all food produced in the USA was wasted at home, restaurants, and stores –- about 100 kg per person per year or a total of 1 billion tons of food a year (or $165 billion in 2011), equal to 33% of the entire world’s supply of meat! [In India, for example, 40% is wasted on or near farms.] In 1974, USA wasted only 28% of all food. Food TravelsIn 2000, U.S. food traveled 1,500 to 2,500 miles from farms to consumption (20% more than in 1980)

Source: Food First,

Backgrounder

,

2004;

Coop

America Newsletter

,

2006;

The

Economist

2011;

T

he Wall Street Journal

, October 2012.Slide17

USA Agriculture & Food

Socially

irrational but privately profitable international food tradeUSA exported $20 million of lettuce to Mexico and imported $20 million of lettuce from Mexico.New York exported $431,000 of California almonds to Italy and imported $397,000 of Italian almonds to the USA.California sold $18 million of asparagus abroad while importing $39 million of asparagus from other countries.Source: Food First, Backgrounder,

2004;

Coop

America Newsletter

,

2006;

The

Economist

2011;

T

he Wall Street Journal

, October 2012.

Socially

irrational

but privately profitable international

food-water trade

drought-stricken

interior California shipped more than 50 billion gallons of

water

(enough for the annual needs of 500,000 families) to China in the form of alfalfa to feed cattle there

.

for

every two container ships arriving with manufacturing goods from China, one returns

empty.

i

t costs twice as much ($45/ton) to truck alfalfa from a Southern California farm to a dairy in the

Central Valley

as it does to ship it from

Long Beach, CA, to Beijing

!Slide18

USA Agriculture & Food

Chicken parts sold around the world

Source:

National Geographic

, October 2014, pp.56-57Slide19

USA Agriculture & Food

overweight

hungry

The USA is the

largest food producer

, yet 35 million go

hungry

and nearly 66 percent are

overweight

!

Wealthier

neighborhoods have 2-3 times as many supermarkets as

low-income

areas.

White

areas have 4 times more food stores than

Black

neighborhoods.

Source: Food First,

Backgrounder

, Vol. 10, No.1, Winter 2004.