/
Rapid Assessment and Trajectory Modeling of Soil Carbon Across a Southeastern Landscape Rapid Assessment and Trajectory Modeling of Soil Carbon Across a Southeastern Landscape

Rapid Assessment and Trajectory Modeling of Soil Carbon Across a Southeastern Landscape - PowerPoint Presentation

faustina-dinatale
faustina-dinatale . @faustina-dinatale
Follow
381 views
Uploaded On 2018-12-24

Rapid Assessment and Trajectory Modeling of Soil Carbon Across a Southeastern Landscape - PPT Presentation

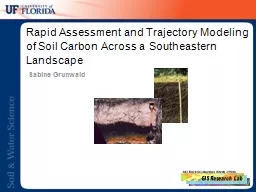
Soil amp Water Science Department University of Florida GIS Research Lab Sabine Grunwald Project Goals Modeling of soil carbon along pedo climatic trajectories across diverse ecosystems ID: 745722

soc soil land data soil soc data land grunwald 2009 modeling amp vnir prep global change current carbon variables

Share:

Link:

Embed:

Download Presentation from below link

Download Presentation The PPT/PDF document "Rapid Assessment and Trajectory Modeling..." is the property of its rightful owner. Permission is granted to download and print the materials on this web site for personal, non-commercial use only, and to display it on your personal computer provided you do not modify the materials and that you retain all copyright notices contained in the materials. By downloading content from our website, you accept the terms of this agreement.


Presentation Transcript

Slide1

Rapid Assessment and Trajectory Modeling of Soil Carbon Across a Southeastern Landscape

Soil & Water Science Department, University of Florida

GIS Research Lab

Sabine GrunwaldSlide2

Project Goals

: Modeling of soil carbon along

pedo

-climatic trajectories across diverse ecosystems

in Florida

Funding source: National Research Initiative Competitive Grant no. 2007-35107-18368 USDA NIFA - AFRI

Core Project of the

North American

Carbon Program

PD:

S. Grunwald

Co-PIs:

W.G. Harris, N.B.

Comerford

and G.L.

Bruland

Post-Docs:

D.B. Myers and D.

Sarkhot

Graduate students:

G.M.

Vasques

, X.

Xiong

and W.C. Ross

Field and lab staff:

A.

Stoppe

, L. Stanley, A.

Comerford

and S.

MoustafaSlide3

Rationale and Significance

Crutzen, 2002. Nature;

Steffen et al., 2005. Global Change and the Earth System;

Rockström et al., 2009. Nature;

Grunwald et al., 2011. Soil Sci. Soc. Am. J.

Global issues & priorities

Global estimates of terrestrial carbon stocks

UNEP-WCMC. http://www.carbon-biodiversity.net/GlobalScale/Map

Scharlemann et al. (2009): Harmonized World Soil Database (2009)-SOC values up to 1 m depth (1 km spatial resolution) & Ruesch and Gibbs (2008): Biomass carbon map using IPCC Tier 1 methodology and GLC 2000 land cover data.

Lack in understanding of soil

carbon (C) variability

Assessments rely on historic/

legacy soil C data

Soil C – a sink or source ?

Soil C – linkages to processes ?

Total soil C – C pools ?Slide4

Historic and current within ≤ 30m

Historic and current within ≤ 300m

Current (2008/2009)

Resampling of

453

historic sites (out of 1,288 historic pedons – FL Soil Database); 1965-1996

(Soil and Water Science Dept., UF & NRCS)

In 2008/2009 soil sampling at

1014

sites (0-20 cm) based on stratified-random sampling design (land use – soil suborder strata):

TC

SOC

IC

HC RC

BD

TN and TP

SOC Observations (FL)Slide5

N: 1,099

Data source: Florida Soil Characterization Database (FSCD)

Modeling of

Historic SOC

(1 m) – FL

Block Kriging

Block size: 250 x 250 m

Target: Ln-SOC kg m

-2

Nugget: 0.61

Sill: 0.86

Range: 101,088 m

ME: -0.0040 ln[kg m

-2

]

(~ 0.10 kg m

-2

)

Class Pedo-transfer function (PTF)

SOC =

f {LU, order}

SSURGO-Soil Data Mart (NRCS) 1:24,000

STATSGO2-Soil Data Mart (NRCS) 1:250,000

< 5

5 – 10

10 – 15

15 – 20

20 – 50

> 50

Not mapped

Vasques G.M. and S. Grunwald. 201_. Global Env. Change J. (in prep.)

Presented at the World Congress of Soil Sciences (2010)Slide6

SOC statistic

(depth to 1 m)

SSURGO

STATSGO2

FSCD obser-vations

FSCD block kriging

FSCD PTF

Map unit

655,155 map units

2,823

map units

1,099 points

2,282,843

250-m cells

7 soil orders

Minimum (kg m

-2

)

0.67

4.01

0.13

2.82

7.70

Maximum (kg m

-2

)

291.77

264.32

207.98

116.19

144.17

Median (kg m

-2

)

7.90

27.05

6.32

9.00

14.75

Mean (kg m

-2

)

24.17

58.44

12.85

13.95

32.84

Std. dev. (kg m

-2

)

39.3162.6723.6912.2845.63Total mapped area (km2)128,788142,681N/A142,678142,626Total stock (Pg)3.5186.820N/A1.9904.112Mean stock (kg m-2)27.3247.80N/A13.9528.83

Map unit

Florida

Estimates of SOC stocks to 1 m in Florida based on different data/methods was 4.110 ± 1.01 Pg (mean ± std. error)

Vasques G.M. and S. Grunwald. 201_. Global Env. Change J. (in prep.)Slide7

Grunwald S., J.A. Thompson & J.L.Boettinger. 2011. SSSAJ. In press

.

Predicts the spatially-explicit evolution and behavior of Soil Pixels / Voxels

Explicitly incorporates anthropogenic forcings

Incorporates bio-, topo-, litho-, pedo- and hydrosphere

Provides temporal context to account for ecosystem processes and forcings

Fuses empirical and process-based knowledge

Conceptual Modeling Framework: STEP-AWBH (

STEP-UP

)

Soil pixel (SA):Slide8

STEP variables:

Soil

Topographic

Ecological / geographic

Parent material

AWBH variables:

Atmosphere / climate Water Biota: LU/LC H(uman)

+

Spatially & temporally

explicit environmental matrix (FL): ~2 TB of data

N: 200+ variables

…..

Soil observations

+

PLSR

CART

Ensemble

regression

trees

… and others

Model

development:

Predict soil-

environmental

properties:

TC

SOC

SOC seq.

Carbon pools

TN, TP

… and more

Model validation:

Uncertainty assessmentSlide9

Data source: NRCS-USDA,

Soil Geographic Database / Soil Data Mart.

Soil Taxonomic Classes – FL

Histosol

Time period: 2000

2005;

data source: MODIS satellite data

Net Primary Productivity – FL

SpodosolSlide10

January

February

March

Data source: PRISM

35 – 55

33 – 75

75 – 55

55 – 75

75 – 95

95 – 115

115 – 135

135 – 155

155 – 175

175 – 195

195 – 215

215 – 235

Avg. Monthly

Precipitation

(mm) [1971-2000]

April

May

June

July

August

September

October

November

December

Climatic Data – FL Slide11

Time frame: 1971 – 2000

Data source: PRISM

Climatic Data – FL Slide12

1990

1995

2003

Data sources: Land use / land cover

1970: USGS; 1990 and 1995: Water Management Districts & FL Department of Transportation

2003: Florida Fish and Wildlife Conservation Commission

1970

1970 to 2003

:

↑ Urbanization

(5.4% - 12.1% - 11.0%)

↓ Agriculture

(21.9% - 7.4% - 8.6%)

↓ ↑ Rangeland

(8.8% - 4.7% - 8.2%)

Forest

(29.9% - 23.2% - 26.2%)

↓ Wetland

(21.7% - 4.4% - 5.8%)

Land Use Change (1970 – 2003)

Based on Satellite Data

?Slide13

Inputs (predictor variables): STEP-AWBH environmental variables

Predict SOC stocks

Modeling of Current SOC (0-20 cm) – FL

Methods: Ensemble regression trees (RT) and other data mining methodsSlide14

Total N: 1,014; Randomized 70/30 calibration/validation split of dataset

R

2

RMSE

RPD

Regression trees (RT)

0.49

3.2

1.34

Bootstrapped RT

0.63

2.6

1.64

Boosted RT

0.61

2.7

1.59

Random Forest

0.64

2.6

1.66

Support Vector Machine

0.60

2.8

1.55

Modeling of Current (2009) SOC Stocks (0-20 cm) – FL

Validation results – STEP-AWBH Modeling (kg C m

-2

)

Myers D.B., S. Grunwald et al. 201_. Global Change Biology J. (in prep.)Slide15

Modeling of Current (2009) SOC Stocks

(kg m

-2

)

(0-20 cm) – FL

Predictor variables of importance

: Available water capacity 50 cm 1.0

Soil Great Group 0.85 Land cover / land use (NLCD) 0.83 Land cover / land use (FFWC, 2003) 0.74

Ecologic region 0.50

Soil Order 0.25

Soil Suborder 0.22

… and more

Method

: Random Forest

Independent validation (N: 304)

Myers D.B., S. Grunwald et al. 201_. Global Change Biology J. (in prep.)Slide16

Modeling of

Current (2009) SOC Stocks (20 cm) – FL

Myers D.B., S. Grunwald et al. 201_. Global Change Biology J. (in prep.)

SOC (kg m

-2

)

Spatial resolution: 30 mSlide17

SOC sequestration

(g C m

-2

yr

-1

)

SOC Sequestration in Florida (1965 – 2009)

Historic & current sites ≤ 30 m (N: 194)

Grunwald et al., 201_. Front Ecol. Env. J. (in prep.)

SOC sequestration (g C m

-2

yr

-1

)

Mean: 11.6; Median: 17.7

STDev: 93.3

Max: 511.3

Time frame of sequestration (yrs)

Mean: 30.3; Median: 29.6

STDev: 5.3

Max: 43.5Slide18

Predictor variables of importance

:Surficial geology 100

Land use 1995 75.4

Long-term max. temp. May 75.4Long-term max. temp. March 62.9

Long-term max. temp. April 35.9

Soil Great Group 27.3Land use 1970 25.9

MODIS EVI (day 137) 22.8MODIS EVI (day 169) 22.7Landsat Bd. 3 20.6

Forest canopy cover 17.5 …. and more

Modeling of SOC Sequestration Rates

(g C m

-2

yr

-1

) (0-20 cm) – FL

Methods

: Ensemble trees (bagging mode)

10% V-fold cross-validation

Grunwald et al., 201_. Front Ecol. Env. J. (in prep.)

STEP-AWBH

model evaluation

(

g C m

-2

yr-1):MSE = 85.93

MAD = 47.61Slide19

Significance of research:

Predict high-resolution soil C pixels across large landscapesReduce the uncertainty of soil C assessmentModel spatial variability of soil C (C pools and nutrients) along climate and land use trajectories

Model soil change in dependence of anthropogenic induced stressorsSlide20

Soil attributes

=

f

(VNIR)

Rapid and cost-effective sensing of Soil C and Pools using visible/near-infrared (VNIR) diffuse reflectance spectroscopy

Soil attributes

=

f

(VNIR; MIR)

Spectral soil C modelingSlide21

Authors

Spectra Type

Area

N

Properties

R

2

Cal.

R

2

Val.

Vasques et al. 2008. Geoderma

VNIR

SFRW

554

TC

0.98

0.86

Vasques et al. 2009. SSSAJ

(Ahn et al., 2009. Ecosystems)

VNIR

SFRW

102

TC

RC

SC

HC

MC

0.93

0.93

0.89

0.92

0.87

0.86

0.82

0.40

0.70

0.65

Vasques et al. 2010. JEQ

VNIR

FL (hist.)

7120

SOC

0.97

0.79

Myers et al. 2011. in prep.

VNIR

FL (2009)

1014

SOC (RC, HC)

0.930.89McDowell et al. 2011. in prep.VNIR & MIRHawaii306SOC0.93 (VNIR)0.97 (MIR)V-fold cross-validationSarkhot et al., 2011. GeodermaVNIRTX514TCHCSOCIC0.940.960.950.930.850.77

0.86

0.81

Research Results VNIR & MIR Slide22

Follow-up Research Project

(NRCS, Grunwald – UF & McBratney – U Sydney)

Rapid soil C assessment across the U.S.

Soil C ↔ Land use/land cover, ecoregion, climate, …

Soil C

↔ VNIR

Apply research methodology tested in FL to U.S.

FL Slide23

http://soils.ifas.ufl.edu/faculty/grunwald

sabgru@ufl.edu