/
THE USE OF 3D GEOLOGICAL INFORMATION IN A LARGE MANAGED AQU THE USE OF 3D GEOLOGICAL INFORMATION IN A LARGE MANAGED AQU

THE USE OF 3D GEOLOGICAL INFORMATION IN A LARGE MANAGED AQU - PowerPoint Presentation

faustina-dinatale
faustina-dinatale . @faustina-dinatale
Follow
372 views
Uploaded On 2016-05-13

THE USE OF 3D GEOLOGICAL INFORMATION IN A LARGE MANAGED AQU - PPT Presentation

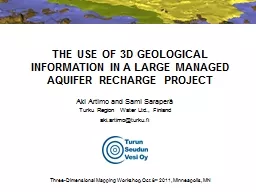
Aki Artimo and Sami Saraperä Turku Region Water Ltd Finland akiartimoturkufi ThreeDimensional M apping Workshop Oct 8 th 2011 Minneapolis MN Artificially infiltrated ID: 317269

water flow information infiltrated flow water infiltrated information groundwater aquifer production geological model infiltration project data wells tools pumping

Share:

Link:

Embed:

Download Presentation from below link

Download Presentation The PPT/PDF document "THE USE OF 3D GEOLOGICAL INFORMATION IN ..." is the property of its rightful owner. Permission is granted to download and print the materials on this web site for personal, non-commercial use only, and to display it on your personal computer provided you do not modify the materials and that you retain all copyright notices contained in the materials. By downloading content from our website, you accept the terms of this agreement.


Presentation Transcript

Slide1

THE USE OF 3D GEOLOGICAL INFORMATION IN A LARGE MANAGED AQUIFER RECHARGE PROJECT

Aki Artimo and Sami Saraperä

Turku Region Water Ltd., Finlandaki.artimo@turku.fi

Three-Dimensional

M

apping

Workshop,

Oct

. 8

th

2011, Minneapolis, MNSlide2

Artificially

infiltrated

groundwater

will

be

produced

for 300,000

inhabitants

living in the Turku area at the end of this year.The infiltration water is obtained from the River Kokemäenjoki, 90 km north of Turku. Artificial infiltration takes place in the Virttaankangas Quaternary esker aquifer, 60 km north of Turku.The length of feeder pipelines (DN=1200 mm) is about 100 km.The cost of the project is 176,000,000 euros.

INTRODUCTIONSlide3
Slide4

Precise

control of the infiltrated

water (i.e. flow paths and residence time in the

aquifer

) is

important

in the

operation

of the

managed

aquifer

recharge (MAR) plant.The aquifer is not used merely to store the infiltrated river water, but also to enhance the quality of the water. The natural purification of the infiltrated water during the flow within the saturated zone of the aquifer is a crucial process for those artificial recharge plants operating in the Nordic countries. After its completion, the Virttaankangas managed aquifer recharge project will significantly increase the number of consumers using artificially recharged groundwater in Finland.BACKGROUNDSlide5

The main factors

affecting the

quality change of the artificially infiltrated groundwater are the

composition

of the

soil

material

,

hydraulic

conductivity

distribution within the esker aquifer and residence time of the infiltrated water.Even though the water quality change occurs beyond the MAR plant’s facilities, the operation can be controlled with the help of:- Measurements of hydraulic head changes- Water quality monitoring data- 3D hydrogeological model- Groundwater flow

model

-

Tracers

(

natural

isotopes

,

organic

carbon and artificial tracers)

BACKGROUNDSlide6

The 3D geological

information

database has been available during the construction of the MAR

plant

.

Automated

updating

of the 3D

hydrogeological

and

groundwater

flow models has enabled the immediate use of the newest research information in the construction of the plant.In addition to basic sedimentological and hydrogeological information, the Virttaankangas 3D hydrogeological model has seen the introduction of geochemical, isotopic, and geophysical data into the 3D modeling workflow. Furthermore, the 3D hydrogeological model works as a structural basis for the 60-layer groundwater flow

model

.

TOOLS FOR THE PROJECT EXECUTIONSlide7

Database

development

Geological modelsHydrostratigraphical modelsGW flow modelsQuantitative

understanding

Simplified

basin

analysis

approach

.

Modified

from Sharpe et al. 2002TOOLS FOR THE PROJECT EXECUTIONSlide8

3D

Geological

information system(including time related data)

3D

Groundwater

Flow

M

odel

Quantitative

understanding

(Aquifer management)

Hydrogeochemical

data

Isotope

data

Drill

hole

data

Geophysical

data

Tracer

tests

Infiltrations

and

pumpings

GW

level

measurements

Sedimentological

interpretations

TOOLS FOR THE PROJECT EXECUTION

Integrated

approach

with

constantly

evolving

and

updating

3D

models

provides

versatile

tools

for

managed

aquifer

recharge

.Slide9

THE USE OF 3D GEOLOGICAL INFORMATION

Geological

information and 3D models have been used to solve

, for

example

,

legislative

,

constructional

, and

land-use

related

issues during the execution of the MAR project.Modeling tools were used to design the optimal layout and configuration of the infiltration pond and production well areas of the MAR plant.For example, locations of five previously planned infiltration areas were rejected due to discovery of morphologically undetectable kettle hole system underlying the infiltration areas restricting

the

flow

of

infiltrated

water

.

Exact

locations

of the

production wells were decided

after

a

thorough

examination

of

available

sedimentological

and

hydrogeological

data,

which

resulted

in

extremely

high

yields

of the

new

production

wells

. As

compared

with the pre-3D

plans

for

pumping

well

locations

, the

amount

of

wells

needed

for

full

scale

production

was

almost

reduced

in

half

.Slide10
Slide11
Slide12
Slide13
Slide14
Slide15

Avg

.

pumping rate per well 6,700 m3/dPreviously built wells 5,000 m3/d

New

wells

8,500 m

3

/d

(Maximum

yields of the new wells are

higher than the used pumping rates.)Coarsest part of the eskerSlide16

THE USE OF 3D GEOLOGICAL INFORMATION

Geological

information system with the modeling tools provided the means

to design and

control

the

infiltrations

and

pumpings

related

to the

one-year

testing phase required in the environmental permits.According to those permits, the full scale production is only allowed to start after the results of the testing phase provide enough information of the controlled execution of full scale infiltration and pumping.During the one year testing phase the observed flow

paths

and

residence

times

of the

infiltrated

water

coincided extremely well with the groundwater flow

simulations

conducted

prior

to the

testing

phase

.

This

was

not

the case

when

the

earlier

pre-3D

plans

for

infiltration

and

pumping

were

simulated

with the

same

flow

model

.

Those

plans

would

have

resulted

in a

failure

in the

operation

of the MAR

plant

.Slide17

THE USE OF 3D GEOLOGICAL INFORMATION

The groundwater

flow model is the only tool that

can

be

used

to

decide

the

exact

infiltration and pumping rates for all the 19 infiltration ponds and 12 production wells so that the residence time of the infiltrated water in the aquifer is sufficient throughout the flow field. The groundwater flow simulations for full scale production will be conducted later this month.Modeling tools, tracer tests

and the

testing

phase

have

shown

that

the

influence of the artificial infiltration can only

be

observed

in the

coarsest

part

of the

esker

(

g

laciofluvial

coarse

unit

).Slide18

The ”

glaciofluvial

coarse” unit from the 3D hydrogeological

model

(

left

)

and the

corresponding

gw

flow model cells depicting the detailed variation of hydraulic conductivity within that unit (right).Slide19
Slide20
Slide21
Slide22
Slide23
Slide24

Flow

of infiltrated water

(5 days)Slide25

Flow

of infiltrated water

(10 days)Slide26

Flow

of infiltrated water

(5 weeks)Slide27

Flow

of infiltrated water

(10 weeks)Slide28

Flow

of infiltrated water

(15 weeks)Slide29

Flow

of infiltrated water

(26 weeks)Slide30

All

the investments in research

have

been

less

than

5 M€ (

less

than 3% of the total budget).The cost of one production well is about 100,000 €. Average pumping rate of the MAR plant’s production well is 6,700 m3/d, whereas the avg. yield of other water producers’ wells within the same esker area is 500 m3/d.The required one-year testing phase was successfully completed before the entire construction work of the project was completed.The cost of each day of delay in water production after the construction is completed is about

20,000 €

due

to the loan

interests

.

The

required

production

rates

of the artificially infiltrated groundwater in this 176 M€ project would not have

been

achieved

without

the 3D

geological

information

system

and

models

.

CONCLUSIONS