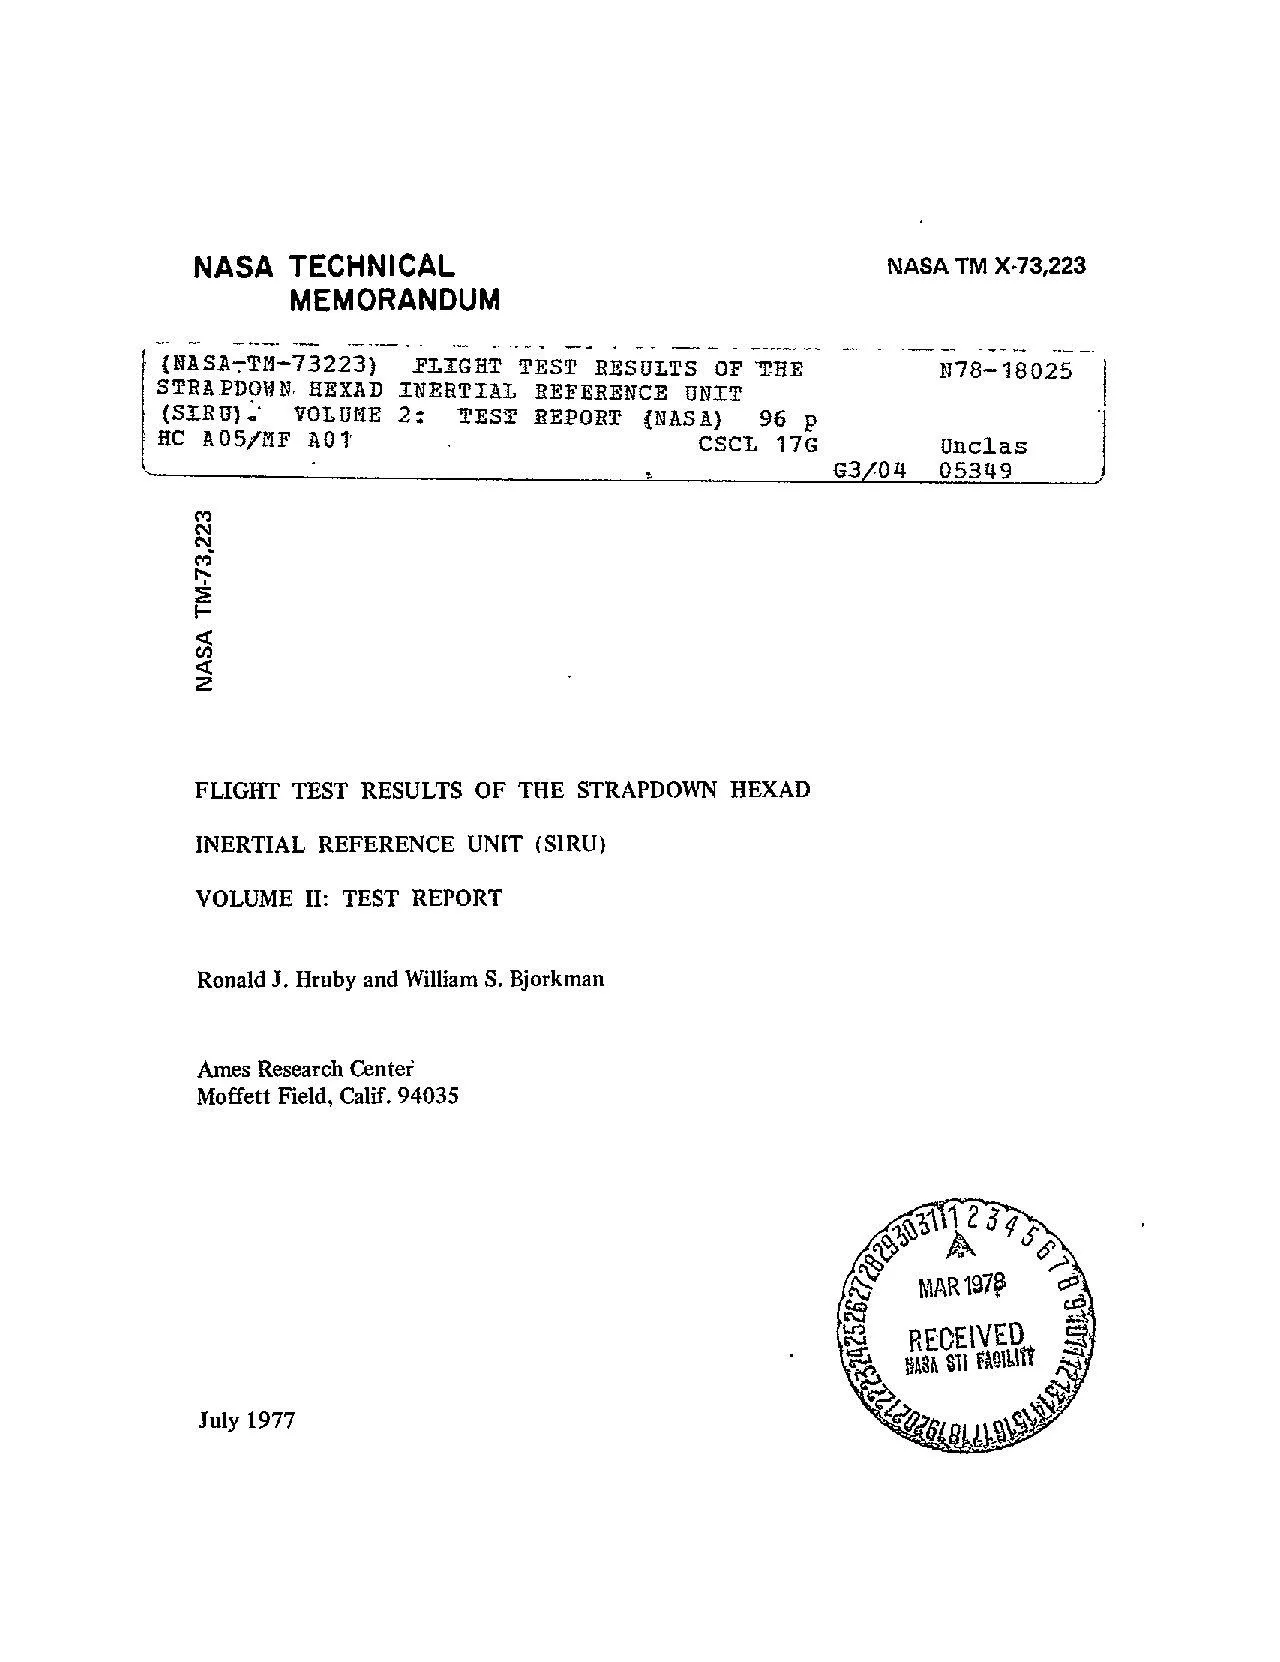
/
NASA TECHNICAL NASA TM X-73,223 MEMORANDUM {NASA7TM-73223) FLIGHT TEST NASA TECHNICAL NASA TM X-73,223 MEMORANDUM {NASA7TM-73223) FLIGHT TEST

NASA TECHNICAL NASA TM X-73,223 MEMORANDUM {NASA7TM-73223) FLIGHT TEST - PDF document

frostedikea
frostedikea . @frostedikea
Follow
342 views
Uploaded On 2020-11-20

NASA TECHNICAL NASA TM X-73,223 MEMORANDUM {NASA7TM-73223) FLIGHT TEST - PPT Presentation

individuals who to the Draper Laboratory1 1P Schamp1 1Stanford University OF THE no gyro aerodynamic highlift reduce takeoff aircraft carry in function ity Cost use the system origin ID: 820614

flight mci test siru mci flight siru test 000 system data computer landing crows time figure position error navigation

Share:

Link:

Embed:

Download Presentation from below link

Download Pdf The PPT/PDF document "NASA TECHNICAL NASA TM X-73,223 MEMORAND..." is the property of its rightful owner. Permission is granted to download and print the materials on this web site for personal, non-commercial use only, and to display it on your personal computer provided you do not modify the materials and that you retain all copyright notices contained in the materials. By downloading content from our website, you accept the terms of this agreement.


Presentation Transcript

NASA TECHNICAL NASA TM X-73,223 MEMORAND
NASA TECHNICAL NASA TM X-73,223 MEMORANDUM {NASA7TM-73223) FLIGHT TEST RESULTS OF THE N78-18025 STRAPDOWN,HEXAD INERTIAL REFERENCE UNIT (SIRU). VOLUME 2: TEST REPORT (NASA) 96 p HC A05/F AOt CSC 17G Unclas G3/0Z4 05349 C,:N FLIGHT TEST RESULTS OF THIE STRAPDOWN HEXAD INERTIAL REFERENCE UNIT (SIRU) VOLUME 11: TEST REPORT Ronald J. Hruby and William S. Bjorkman Ames Research Center Moffett Field, Calif. 94035 V3 REOE

IVED, July 1977 individuals who to the
IVED, July 1977 individuals who to the Draper Laboratory P. Schamp Stanford University OF THE no gyro aerodynamic high-lift reduce takeoff aircraft carry in function, ity. Cost use the system originally was undertaken sensors consist six nonparallel SIRU system July 1974, and individual the test The next The fourth and failure be used guidance data as ILS) aircraft operations, not available:&#

1; the case guidance backup under in
1; the case guidance backup under instrument be position be eval­sensor geometry. are used with nominally the dele­hope was software was required of the not degrade alignment techniques ating deleterious and isolation These are allowable squared total squared including effects false alarms, produces undetected only one accelerometers because detect and The total squar

ed error theoretically exceeded recompen
ed error theoretically exceeded recompensation algorithm from below recompensation algorithm bias, noise variance increase, degraded sensor for use The fault different constraints: second occurring of the was assumed Laboratory measure­that the detection and drift failures value commensurate that the computer during cruise conditions area maneuvers simulated sensor were observed and rec

orded. mance was degraded failed sensor
orded. mance was degraded failed sensor and isolation the effects for sensor of bias The dual computer configuration for the language used The dual mode. Theoutput unless an iden­the two where comparisons were data were to the computer system mechanization under operational aircraft conditions. Thisobjective included laboratory evaluation. Redundancy management of the two&

#1;computers by dual transfer boxes, dua
#1;computers by dual transfer boxes, dual receivers, and the arbiter is illus­trated in figure 5.Figure 6 shows the dual computer and digital tape recorder controk inter­face box and arbiter control panel. The dual plasma displays are shown infigure 2.FLIGHT TEST PROGRAM DESCRIPTIONThe flight test program was designed to evaluate navigation, redundancymanagement and

dual computer operation. It included bo
dual computer operation. It included both short (hr) andlong .5 ;(3 hr) flight periods, straight and triangular segments, curved paths,and conventional terminal area maneuvers. This chapter describes the SIRUflight test program, including:1 SIRU flight test plan2. A description of the CV-340 aircraft position reference system3. SIRU operational procedures used to

prepare and operate the systemd
prepare and operate the systemduring the test period4. Data analysis algorithms used to reduce and analyze the flight testdata using the Ames Research Center IBM-360 or CDC-7600 computerFlight Test PlanThe SIRU flight test program began May 20, 1975 and ended on September 24,1975. Several acceptance flights were made earlier at Hanscom Field, Massa­chusetts. Acc

eptance test results are reported in ref
eptance test results are reported in reference 7. AmesResearch Center's tests began and ended at Moffett Field Crows Landing NavalAuxiliary Landing Field was the central calibrated waypoint for every flighttest. All flights were made in California's San Joaqumn and Salinas Valleys.The largest segmented course included waypoints at Sacramento, Modesto,Salinas, Moffett Field, a

nd Oakland. The most commonly flown path
nd Oakland. The most commonly flown path was fromCrows Landing, Modesto, to Castle Air Force Base, and back to Crows Landing.Figure 7 shows the general areas used for flight test and the landmarks (way­points) used for visual calibration of the reference system.A total of 15 test flights were made, with 3 flights devoted entirely tonavigation performance. Cruise portions of the

flights were of sufficientlength
flights were of sufficientlength to record one or more complete Schuler periods. Early flights wereused for navigation, SIRU calibration, and system adjustments. Portions ofeach flight were utilized for testing the failure detection and isolationalgorithms. During September, several test flights were made near Crows Land­ing to provide performance data during turns and takeoff a

nd landing maneuvers.Most flight
nd landing maneuvers.Most flights were made below 3048 m (10,000 ft). Flight tests which evaluatedterminal area maneuvers followed the flight profile illustrated in figure 8.Flight tests made in late July, August, and early September includedcases where the two flight computers were operated independently from the same9sensor outputs. During these flights, the dual c

omputer system was used pri­marily
omputer system was used pri­marily to evaluate the SIRU system's sensor redundancy management rather thanto test dual computer redundancy management.Flight test patterns were of two types: enroute (Moffett Field-to-CrowsLanding or Crows Landing-to-Moffett Frield) and approach (in the general vicin­ity of Crows Landing). Enroute patterns are illustrated in figure 9 (take off

from Moffett Field, turn to fly over the
from Moffett Field, turn to fly over the Moffett Field DWE for a tape-mark,fly over the San Jose DME for a tape-mark (twice), fly over Lick Observatoryfor a visual mark, then overfly the Crows Landing DME for several tape-marksbefore landing). The same sequence in reverse order was used on returning toMoffett FieldA typical flight sequence originating at Crows Landing is show

n infigure 10. In this flight, t
n infigure 10. In this flight, the CV-340 left Crows Landing, crossed the runwayat Stockton, turned southeast, proceeded to Castle Air Force Base, then flewto Merced, and finally back to Crows Landing.Aircraft Position Reference SystemThe continuous position system used during the SIRU flight tests to trackthe CV-340 aircraft consisted of two primary references:&#

1;1. A modified Nike-Hercules radar trac
1;1. A modified Nike-Hercules radar tracking system located at CrowsLanding2. A six-channel multiple DME receiver system, designed by SierraResearch Corporation, mounted within the aircraftThe modified Nike-Hercules radar provided improved resolution through theuse of 19-bit range and angle digital shaft encoders. No atmospheric refrac­tion correction was provided. A tra

nsponder aboard the CV-340 was used to&#
nsponder aboard the CV-340 was used toimprove angle tracking.The DME receiver system provided range information from up to six DME orTACAN stations. The system utilized a fast-switching DME receiver which wasprogrammed to automatically switch through each of six selectable DME or TACANfrequencies. Range lock-up time was 1 sec maximum and range output resolutionwas 18.

5 m (0.01 n. mi.). Output range informat
5 m (0.01 n. mi.). Output range information was tagged with stationfrequency and receiver-clock time for identification.Time-referenced photographs of airport reference benchmarks were alsotaken from the CV-340 aircraft periodically throughout each flight to providea third basic waypoint reference. These waypoints are indicated in figure 7.The photographs were taken from the

aircraft by a camera mounted on a milita
aircraft by a camera mounted on a militarystandard driftmeter installed in the underside of the aircraft fuselage. Thepositions of the driftmeter and DME receiver system within the CV-340 areillustrated in figure 11. The timepoint at which each photograph was taken wasrecorded in the SIRU digital tape recorder in order to correlate with radar,SIRU, and DME position data. The

number of photographs per flight varied
number of photographs per flight varied from8 to 16, depending upon the length of flight. The driftmeter's level gyro was10inoperable during most of the flight tests, causing uncertainty about the air­craft's attitude. As an example of this uncertainty, a 0.50 vertical misalign­ment of the camera at an altitude of 3050 m (1000 ft) introduces a positionerror of 26.2 m (86 f

t).Figure 12 is a chart indicati
t).Figure 12 is a chart indicating the relative position of the DME stations,radar system, and reference airports utilized during the flight tests A listof the DME stations and their locations is printed in table 2. The range andbearing of each station is given with respect to the TACAN's coordinates atCrows Landing. The acquisition altitude given is the minimum altitude requ

iredat Crows Landing in order to
iredat Crows Landing in order to receive a signal from the DME station.In order to provide accurate start and terminal area position fixes, theUnited States Geological Survey was commissioned to obtain reference positionbenchmarks and azimuth lines at both Moffett Field and Crows Landing Thebenchmarks were located to within ±4.0 arcsec of position (standard deviation).&#

1;Tables 3a and 3b list the latitude, lo
1;Tables 3a and 3b list the latitude, longitude, and elevation of the applicablebenchmarks surveyed for Moffett Field and Crows Landing, respectively.Figures 13 and 14 present maps illustrating the location of the benchmarkswith respect to reference buildings and landmarks at Moffett Field and CrowsLanding, respectively.Flight Test Operating ProceduresBecause of limit

ed calendar time available for the fligh
ed calendar time available for the flight test portion ofthe SIRU program, a concerted effort was made to record a large amount of dataduring a variety of test flights. Each flight had raw and calibrated datarecorded with engines off, and up to 0.5 hr of raw and calibrated datarecorded with engines on prior to taxi and flight In this manner, a suffi­cient amount of preflight dat

a was recorded for preflight test calcul
a was recorded for preflight test calculation ofinertial sensor compensation values for use during flight The data also pro­vided postflight confirmation of performance changes occurring during the testperiod.All the flight tests were generally conducted with the following tensequential events.1. Equipment turnon and warmup using ground power with the CV-340 air­cra

ft located at ground benchmark (referenc
ft located at ground benchmark (reference point) #A. Align aircraft posi­tion with respect to benchmark prior to azimuth calibration.2 Level SIRU mechanical platform and align SIRU azimuth using theporro prism theodolite and the calibrated azimuth line.3. Start aircraft engines and remain in position up to 0.5 hr.4. Put SIRU in fine align.5. When computed instrument erro

rs have stabilized for bias calibration,
rs have stabilized for bias calibration,turn on digital tape recorder and shift to navigate mode.11Moffett Field warmup park­ing area to the continuous instrument go to recorded data this time. go to Moffett Field. and taxi navigate and record for about 5 min was bubble-leveled package was slowly and a new times for elements and a new package was before completi

on Forced failures isolation algorithms.
on Forced failures isolation algorithms. these forced recorded flight data was on tape. or the did not PDP 1145 considerable programming was not operational are shown and small a navigation gyro and or raw data file data file derived triad raw data uncompensated measurement and included copying process processing by tape (for time code SIR Navigation also estimated radar data (ref. data fr

om file. It smoothed navigation used in
om file. It smoothed navigation used in produce latitude-versus-longitude east, and root-sum-square position from computer-generated Ames Research Center's central computer 3 m Data Prooessing- the SIRU and derived and ranges lists the list, the not be found in was omitted position calculations. measurements was range-rate (using was considered more range time of SIRU FLIGHT were p

erformed and each a magnetic data. In SI
erformed and each a magnetic data. In SIRD was flown. One tapes could be read Commentary and following discussion, each of The flight for the year before was increased, turning maneuvers. algorithm was also removed in both flight tests, The first scheduled inflight return segment test was again successful, proper detection eter failures. into only between "unfailed-SIRU" the use the failure Good radar cov

erage and on program. An of the tape. On
erage and on program. An of the tape. Only were available per second real time when both degraded navigation. isolated. The marred by that the was in third segments of the flight showed indicated on the display panel for this segment Some intentional computerfailures were also injected on this flight. Computer failures were observedon no other flights in the programTest Flig

ht No. 11. (8/29)-This flight showed no
ht No. 11. (8/29)-This flight showed no unscheduled sensorfailures while successfully isolating nearly-simultaneous scheduled failuresin gyros A and B Navigation was not very good on the Moffett Field-to-CrowsLanding segment of this flight. It was good on the second segment which con­sisted of flying patterns at Crows Landing SIRU's position was reset and thevelocity was zeroed

in midnavigation on the second segment o
in midnavigation on the second segment of this flight,resulting in a navigational discontinuity.Test Flight No. 12. (9/05): This flight was the last flight involvingscheduled failures. These scheduled failures were successfully detected andisolated, although some unscheduled failures were indicated as well. Naviga­tion was relatively good.Test Flight No. 13 (9/10) This f

light featured multi-maneuver patterns&#
light featured multi-maneuver patternsat Crows Landing with no scheduled failures and with little regard for naviga­tional performance (which still turned out to be fair). This flight wasalmost free of unscheduled failures. SIRU was fine-aligned before the flightbut was otherwise kept in the navigation mode throughout the flight. Tapeswere changed while the aircraft was stationa

ry at Crows Landing.Test Flight
ry at Crows Landing.Test Flight No. 14. (9/18). This was a repeat of Flight 13, except thatSIRU was fine-aligned before the flight and also before returning to MoffettField.Test Flight No. 15. (9/24): The final flight was the longest of theseries. It exhibited good navigation performance and there were no indicatedsensor failures.Figure 17 depicts navigation m

ode duration, in-flight duration, and ra
ode duration, in-flight duration, and radarcoverage periods for the 15 flight tests. The flight date appears on the leftside of the figure. Each flight segment is represented by an unbroken hori­zontal line Later segments are shown relative to the zero time of the firstsegment for each multi-segment flight. Navigation duration for any segment isindicated by the length of the seg

ment's unbroken line. The darkened porti
ment's unbroken line. The darkened portionof the line indicates time in flight, with "T" indicating take-off and "L"indicating landing. Radar coverage periods are indicated by parenthesizedline segments just above the navigation segments. It may be observed that12 of the 15 flights had at least some radar coverage. DME coverage, althoughof poorer accuracy than the radar cover

age, was present in almost unbroken&
age, was present in almost unbrokenfashion for every flight test segment.Table 4 summarizes characteristics of the SIRU flight tests. Navigationmode and flight duration (in seconds) are shown, after a brief description ofthe route flown by the CV-340 Radar intersection is the total common time"Marks"interval for which there are data on both the SIRU and radar tapes. 

denotes the number of position fixes tak
denotes the number of position fixes taken and recorded "Computers" identi­fies which computers were recorded and whether they differed when both were19at the Hz) rate. of this was evaluated errors show small compared to the not into estimate from appears after of the procedures were In an average, shown single-number characterization SIRU flight were navigationally and 9/18C. 

;was fine-aligned table entries The curv
;was fine-aligned table entries The curve all data up to error slope The letters (A, B, which appear These figures improved navigational navigation performance SIRU system's at the 4 n. output corrections East, and South axes ment. Earth motion isolation South component was subject gravity during SIRU fine-alignment if this deleterious effect experiment was conducted commanded rotation attitude qua

ternion times, the recorded) dur
ternion times, the recorded) during alignment. while responding could not did indicate the test down com­on the as it 3-mrad change evidence, together and isolation algorithm accelerometeis were that the was not of the nominally horizontal center) equal to the the -4o(2Min)] &#x/MCI; 11;&#x 000;&#x/MCI; 11;&#x 000;Peak position error magnitude (at t = in this n. n. att

itude reference. aircraft occur. 
itude reference. aircraft occur. was programmed more) during all but caused by errors occur most sig­a navigation bias error was inserted A was was used up to later. The a maximum a maximum scheduled failure removal because of the inertial navigation) SIRU could These indications a batch 9/05B. The error was ends of stationary before by observing radar data. be possibl

e systems such sensor measurements use i
e systems such sensor measurements use in failure isolation calculations. sion of serving both and flight The SIRU was but not control applications. three plots in these for the six individual The 1-sec vides smoothing and landing the use such data in control systems. Another consideration control applications. Isolating accelerometer adequate performance Failure Detection dynamical

ly changing allowable squared allowable
ly changing allowable squared allowable squared six inertial internally defined error values were extracted error values flights. The squared error error was sensor error maximum allowable but real failures The error values was executed (gyro or point. This enabled "failed" computed aircraft attitude was 20/sec. was formed other (similar) and the and stability sensor error fault detec­error models tha

n in was used typical CV-340 flight and
n in was used typical CV-340 flight and their calibration numbers allowable squared constant value that the error value conformed reasonably by purposely miscompensating The levels from Draper of the tests. The as to the lack improper sensor compensation. Failures occurred after could be different instances. was solved was never encountered after reaching cruising altitude. of the&#

1; gram. The statistical on an time.
1; gram. The statistical on an time. This -All was preceded aided single The resultant for the the conditions test, the each flight results of position calibration defective mount. -All Test Flight aided five-position which utilized all the failures. for Flight lation, classification, dynamic increase Test Flight -ABCDF the adverse this flight Test Flight ometer module was recognized, a

ir was -E was caused -F was ana
ir was -E was caused -F was analyzed in table in the slew (turn) flight data 6. A level flight 35 is the SIRU of the sixth position SIRU frame in bubble mounting in level­was limited of +40' not control gyro and which would by the detection and not functioning in the system was outside air temperature exceeded be running. temperature was normal) cold air transient failure

during fine-alignment Using
during fine-alignment Using computed as 52 zero for and isolation be one and a maximum dynamic increase these limits and (0.13 not inspect There was For the of this output controlled data outputs was selected SIRU computer still exist good one. had occurred in the not possible In order more mundane of components failure rate a whole. SIRU computer set for almost entirely The

self­and computing even though only
self­and computing even though only once and central single bit system where for self­so that gates and more independent cost and all fed and recovery both disagreement cause the prime, and but there be no failure in both computers have latched fail indi­case of did not arbiter, error not fail from errors be manipulated was not all the as to "no error," each device then the time, so by other 

a way of the be much-easier of e
a way of the be much-easier of each good one the use can greatly be just were contaminated, that it by error­the fault the cost would increase The current architectures desirable achieve higher The SIRU direct data small enough other serious problems. to the then the nonfaulty data accurate data. of the it to not fail were located following assessments: accuracy achieved dete

ct and isolate sensor operating performa
ct and isolate sensor operating performance SIRU parallel computer configuration and its 7 n. a 0.1to the was designed system, but that it no fault should attempt recovery. in all SIRU preflight in such ��5 &#x/MCI; 0 ;&#x/MCI; 0 ;would probably cause multiple computer failures which could not be traced tothe failed computer by the arbiter.&#x/MCI; 1 ;&#x/MCI;&#x

D 1 ;For a very simple computer system,
D 1 ;For a very simple computer system, the SIRU arbiter concept might be satisfactory, but its suitability for the redundant computational_problem of­&#x/MCI; 2 ;&#x/MCI; 2 ;-&#x/MCI; 3 ;&#x/MCI; 3 ;the -SIRU-system-is doubtful.  &#x/MCI; 4 ;&#x/MCI; 4 ;REFERENCES*&#x/MCI; 5 ;&#x/MCI; 5 ;1.  &#x/MCI; 6 ;&#x/MCI; 6 ;Eberlein, A.. J.; and Savage, P. G.: St

rapdown Cost Trend Study andFore
rapdown Cost Trend Study andForecast. NASA CR-137585.&#x/MCI; 7 ;&#x/MCI; 7 ;2. &#x/MCI; 8 ;&#x/MCI; 8 ;Bjorkman, William S.: Final Report for Development of Aided Inertial&#x/MCI; 9 ;&#x/MCI; 9 ;System Computer Programs. (AMA Report No. 74-37, Analytical MechanicsAssociates, Inc.) NASA CR-137641, 1974.&#x/MCI; 10;&#x 000;&#x/MCI; 10;&#x 000;3.

 &#x/MCI; 11;&#x 000;&#x/MCI;&#
 &#x/MCI; 11;&#x 000;&#x/MCI; 11;&#x 000;Bjorkman, William S.: SIRU Flight Test Summary. AMA Report No. 76-1,Analytical Mechanics Associates, Inc., January 1976.&#x/MCI; 12;&#x 000;&#x/MCI; 12;&#x 000;4,. Booth, Robert A.; Gilmore, Jerold P.; and Hruby, SIRU Development A ; Computer Configuration Inertial Reference I -TABLE 1.-INERTIAL NAVIGATION SYSTEM REQUIREMENTS FOR

SPACE-CRAFT AND AIRCRAFT APPLICATION
SPACE-CRAFT AND AIRCRAFT APPLICATIONPhysicalcharacteristic  Apollo  Length of operation  Weeks  Number of operations  Once without cooldown  or power downPreflight  Unlimited time in quiet  calibration  environment  Flight dynamics  1-D, straight line;  relatively low vibration  Thermal environment  Space radiator, stable,700 F  CV-340&

#1;One to four hoursRepeated
#1;One to four hoursRepeated on and offHurried in nonquietenvironment3-D, maneuvering;high vibration Aircraft ambient air­1100 F; cabin temper­ature: 40-88 F47TABLE 2.-DME STATION LOCATIONS FOR SIRU FLIGHT TEST PROGRAM DME Lat, Long, Alt, Freq, Range, Bearing, Acq-alt,name deg deg ft Hz n. mi. deg ft90. 108.4 14.7

0 19.08 242.0 Portervilie 35.91 -11i
0 19.08 242.0 Portervilie 35.91 -11i9.02 500. 109.2 135.12 121.04 15772.6Crows Landing 37.40 -121.11 170. 110.2 .45 -158.43 -28.8Woodside 37.39 -122.28 2270. 111.4 56.11 -101.01 651.3San Francisco 37.61 -122.37  Modesto 37.62 -120.95  10. 111.6 61.68 -88.16 3490.8Los Banos 36.71 -120.77 2107. 112.6 44.72 149.07 -199.4Fresno 36.88 -119.80 100. 112.9 70.08 106.27 43

79.0San Jose 37.36 -121.92 48. 1
79.0San Jose 37.36 -121.92 48. 114.1 39.42 -104.09 1465.4Linden 38.07 -121.00 260. 114.8 39.95 -2.98 1290.5Sacramento 38.44 -121.55 5. 115.2 65.26 -28.78 3897.3-119.09 550. 115.4 151.18 129.21 19788.4Bakersfield 35.48 Frxant 37.10 -119.59 2380. 115.6 74.81 93.77 2703.6Stockton -37.83 -121.17 40. 116.0 25.37 -16.89 669.5Gorman 34.80 -118.86 4500. 116.1 190.87 1

34.36 27849.8Oakland 37.72 -122.
34.36 27849.8Oakland 37.72 -122.22 30. 116.8 56.42 -80.36 2922.1Avenal 35.64 -119.97 710. 117.1 119.13 142.26 11969.1Salinas 36.66 -121.60 77. 117.8 50.83 -162.05 2346.0Fellows 35.09 -119.85 5000. 117.5 151.77 145.98 15496.2Moffett Field 37.43 -122.05 4. 117.6 45.39 -98.36 1956.948POSITION BENCHMARKS Latitude Longitude Elevation56" 1220 03' 20

" 58" 1220 03' 58" 1220 Latitude Longitu
" 58" 1220 03' 58" 1220 Latitude Longitude Elevation06' 17" 06' 16" 03" 1210 ��--&#x/MCI; 0 ;&#x/MCI; 0 ;TABLE 4 -FLIGHT TEST SUMMARY &#x/MCI; 1 ;&#x/MCI; 1 ;Navigation Flight Radar  &#x/MCI; 2 ;&#x/MCI; 2 ;Maximum Detected failures&#x/MCI; 3 ;&#x/MCI; 3 ;data Route duration, duration, Marks Computers Rate 367 8 D, E, TABLE 5.-POSITION REFERENCE DA

TAResidual  Residual Residua
TAResidual  Residual Residual radar-DME­radar­photograph  photograph DME Test flt.no. Mo. Day Mark no. R-M  D-M R-D Crows Landing5 6 25 1  423.825  975.927 622.658 5 6 25 2  320.361  550.117 604.741 5 6 25 3  520.697  497.351 711.678 5 6 25 4  361.289  1093.61 733'.728 5 6 25 5  128.034  634.744 744.033 5 6 25 7  54.7524  709.752 677.333

5 6 25 8  226.632  656.635 776.2
5 6 25 8  226.632  656.635 776.282 7 7 17 15  106.305  684.344 612.039 7 7 17 17  122.033  1246.06 1278.73 9 7 29 4  280.788  1012 775.809 9 7 29 8  246.434  853.89 730.937 15 9 24 2  613.069  940.726 735.407 15 9 24 6  574.165  610.515 1053.21 Stockton Metropolitan Airport 7 7 17 16 439.415 327.143 760.912 9 7 29 5 847.235 55.236 901.919 5 9 24 5 654.978 994.

773 779.891 Modesto City-County Airport
773 779.891 Modesto City-County Airport 7 7 17 13 499.61 562.744 284.105 9 7 29 6 439.118 507.555 372.682 15 9 24 7 597.118 734.54 879.79 15 9 24 15 1215.7 1576.1 362.534 Castle Air Force Base 7 7 17 14 368.718 209.895 567.57 9 7 29 7 776.962 448.343 599.089 15 9 24 8 612.854 567.516 513.086 15 9 24 14 1004.99 2083.71 1138.42 TABLE 6.-AVERAGE RESIDUALS BETWEEN POSITIONREFERENCES AS MEASURED DURING THE FLIG

HTRadar-photograph R-M DE-photog
HTRadar-photograph R-M DE-photograph D-M Radar-DME R-D Average residual (ft) 476.46 722.42 717.36 51Nav.  Flight durationse)(sec) 5/20 -5171 5/30A 2380  5/30B 5980  6/16A' 3074  6/16B 2321  6/18 15303  6/25 3405  7/14 6005  7/17A 4888  7/17B 4155  7/24A 2400  7/24B 2555+  7/24C 2587+  7/29A 4900  7/29B 2426  8/22A -2630 8/22B 2110 

8/22C 4082  8/22D 9 8/29A 2620 
8/22C 4082  8/22D 9 8/29A 2620  a ,-a 8/29B 2501  9/05A 2200  9/05B 3067  9/05C 2013  9/05D 2053  9/10A 3733  9/10B 6685  9/1OC 9620  9/10D 12130  9/18A 3860  9/18B 7345  9/18C 10700  9/18D 1600  9/24 15819  TABLE 7.-MaiLmum  positionerror errom 5-93  12.82  41;02  23.08  3.55  33.99  12.94  35.59  4.40 

2.10'  2.79  1.23+  4.04+ &
2.10'  2.79  1.23+  4.04+  14.06  7.13  2.93  .36  11.16  ?1  7.65  a .3  2.50  3.72  1.86  3t00  3.97  10.19  19.36  20.14  6.22  7.62  6.88  2.91  7.80  SIRU NAVIGATION PERFORMANCEAverage Average Straight line (A+ Bt)position slope A Berrore)(n.mir (n. um./hr) (n. mi.) (n. mi./hr) 3.19 4.61 -0.

02 4.65 4.47 9.80 -12.31 34.56 17.76 20.
02 4.65 4.47 9.80 -12.31 34.56 17.76 20.77 -6.56 26.59 12.30 29.61 -2.95 34.73 .81 2.70 -.15 3.06 12.60 5.49 4.39 3.90 7.63 15.58 1.07 13.86 15.65 19.79 -3.77 23.27 2.52 2.94 -.53 2.44 1.02 1.22 .45 .77 1.21 3.64 -.01 3.67 .36 .97 .04 .88 1.48 4.35 -.62 5.63 8.53 10.50 -1.88 12.50 1.76 6.14 -1.32 9.09 1.38 3.94 -.24 4.44 .31 .84 .27 .14 2.22 4.81 -.92 6.20 1 ? 9 2.10 6.65 -1.48 9.71 .15 .36 .12 .11 1.06 3.56 -.10

3.81 1.05 2.73 -.53 3.66 .60 2.25 -.16 2
3.81 1.05 2.73 -.53 3.66 .60 2.25 -.16 2.68 .73 4.13 -.57 6.22 1.19 2.36 -.20 2.65 4.40 5.32 -1.92 6.86 6.70 5.37 -1.66 6.29 8.16 5.15 -.85 5.53 2.22 4.52 -.96 5.85 '4.00 3.85 .34 3.61 4.33 2.59 2.03 i.57 .95 4.79 -.54 6.61 3.92 1.59 1.68 1.02 aPosition reset 1300 see.52tected Error,1628 1648 1808 1925 1308 1394 135 .1120... ... 495 495 516 516 /hr 1682 1682 675 775 488 572 M D 500 572

A C P P TABLE 10.-TOTAL PARITY ERROR R
A C P P TABLE 10.-TOTAL PARITY ERROR RESIDUALSTANDARD DEVIATIONS FROM FLIGHT 14 (9/18B)Gyro parity residuals Flight mode (standard deviation (0/hr)) aA aB aC aD aE aF 30 /sec (CCW) 1.04 2.28 0.96 0.70 2.56 2.88 30 /sec (CW) 1.24 1.99 .88 .76 1.96 Z.0 Level flight 0.36 0.69 1.01 0.68 0.33 0.72 TABLE 1.-SIRU COMPUTER PREFLIGHT SYSTEM TESTABILITY Subsystem  CommentsTestable:Watchw

ord checker Software can send various "f
ord checker Software can send various "faulty" watchwords to thereceiver to test a match for each bit, one bit at atime.Self-diagnostics  Software can continuously execute self-diagnostics,with random interrupts from the auxiliary test equip­ment which performs an action similar to the effectsof the fault being diagnosed.Time-out generator Software can se

nd opinions to the T-box at various&
nd opinions to the T-box at various(for computer) time delays, testing the "window" of the time-out.This can also be used to gauge the accuracy of thetime-out delay elements, but only if the clock gener­ator of the computer is determined to be within fre­quency bounds when tested by the auxiliary testequipment.Not testable:Parity checker  It is possi

ble to exercise the T-box parity tree by
ble to exercise the T-box parity tree bychanging all the input bits one at a time, but thereis no facility to change the parity bit sent to thereceiver.Bit count It is not possible to cause the T-box counter to actin a faulty way, nor can the transmitted clock betested by circuitry other than the (perhaps faulty)receiver counter.Clock active &#

2;There is no way to incrementally vary
2;There is no way to incrementally vary the clock timedelays or inject various unusual pulses on the clock lines.ORIGINAL PAGE 1OF POOR QUALIM55SIRU inertial sensor assembly. Figure 2.-SIRU computer console.57Vertical Z xz D -*-raSIRU F Accelerometer Attitude rate gyro module module !A5 8 frame OF POOR QUALM1 SIRU strapdown inertial reference unit F

igure 3.-Dodecahedron SIRU instrument co
igure 3.-Dodecahedron SIRU instrument configuration.58I I i H-316 Ii computer A I -Receiver I I sensrs boxArbterDisplay & control panels Aircraft reference system !' . I computer BI I LDual computer Receiver I e-F Figure 5.-Dual computer system configuration. ��0 &#x/MCI; 0 ;&#x/MCI; 0 ;INTERFACE BOX&#x/MCI; 1 ;&#x/MCI; 1 ;I0 &#x/MCI; 2 ;&#x/MCI; 2 ;RESET &#x/

MCI; 3 ;&#x/MCI; 3 ;LO &#x/MCI;&
MCI; 3 ;&#x/MCI; 3 ;LO &#x/MCI; 4 ;&#x/MCI; 4 ;P NO WRITE ,P0l A ONLYLOA&#x/MCI; 5 ;&#x/MCI; 5 ;LO EF MAE&#x/MCI; 6 ;&#x/MCI; 6 ;A &#x/MCI; 7 ;&#x/MCI; 7 ;D &#x/MCI; 8 ;&#x/MCI; 8 ;D &#x/MCI; 9 ;&#x/MCI; 9 ;'RDYI RTD&#x/MCI; 10;&#x 000;&#x/MCI; 10;&#x 000;BOTH &#x/MCI; 11;&#x 000;&#x/MCI; 11;&#x 000;I, &#x/MCI; 12;&#x 000;&#x/MCI;&#

xD 12;&#x 000;2&#x/MCI; 13;&#x 000;&
xD 12;&#x 000;2&#x/MCI; 13;&#x 000;&#x/MCI; 13;&#x 000;9 9 &#x/MCI; 14;&#x 000;&#x/MCI; 14;&#x 000;S &#x/MCI; 15;&#x 000;&#x/MCI; 15;&#x 000;P &#x/MCI; 16;&#x 000;&#x/MCI; 16;&#x 000;OA&#x/MCI; 17;&#x 000;&#x/MCI; 17;&#x 000;SL@ NIT (TERM LOAD P DONLY S -9 &#x/MCI; 18;&#x 000;&#x/MCI; 18;&#x 000;UNt CONT UNt D --REMOTE A&#x/MCI; 19;&#x 000;&#x/MCI; 19;&#x 000;

U Pe&#x/MCI; 20;&#x 000;&#x/MCI;
U Pe&#x/MCI; 20;&#x 000;&#x/MCI; 20;&#x 000;*SS EOTo o oo @ *O BOO @ LOA &#x/MCI; 21;&#x 000;&#x/MCI; 21;&#x 000;0 &#x/MCI; 22;&#x 000;&#x/MCI; 22;&#x 000;ARBITER &#x/MCI; 23;&#x 000;&#x/MCI; 23;&#x 000;SYSTEM &#x/MCI; 24;&#x 000;&#x/MCI; 24;&#x 000;FAIL &#x/MCI; 25;&#x 000;&#x/MCI; 25;&#x 000;'w &#x/MCI; 26;&#x 000;&#x/MCI; 26;&#x 000;/ &#x/MCI; 27;&#

x 000;&#x/MCI; 27;&#x 000;SOP COP NW
x 000;&#x/MCI; 27;&#x 000;SOP COP NW TIM PAR 7 8 . ... ) a Horizontal U b 4 Dual radar* Crows NALF DME 1/2 to 1nautical mile Vertical 2000'-3000' 2000'-3000' Crows Figure 8.-Terminal area pattern near Crows NALF. Wa p 3600 turn at a,b,c, d, e,could either be level, climbing, or descending Pattern altitude 1000' maxbank angle for turns was 450 Pattern remained in radar view 37.8 1 ON a 376 "kB-ay cc 37 4

-S.F. Moffett/ Feld San Jose Airport Cro
-S.F. Moffett/ Feld San Jose Airport Crows Landing NALF 37 3 -122 1 -122.0 -121.8 -121.6 Longitude, deg -1214 -121 2 -121 1 Figure 9.-Flight sequence -Moffett Field to/from Crows Landing NALF. 38 0 37 9 37 8 Stockton 37 7 *a 4-, , 376 Modesto U,375 Cc374CrwLadn AF Castle AFB 37 3 -Position from computer B 372 I -121 4 -1213 Figure 10.-I I I I -1212 -121 1 -121 0 -1209 -1208 -1207 -1206 -1205 Longitude, deg Typical

flight sequence originating at Crows La
flight sequence originating at Crows Landing NALF -1204 A SIRU OPERATOR'S SEATARC INSTRUMENTS INCLUDING SCORE SYSTEM DRIFT METER AISLEI V1111 W\\\\\\IRACKa,STA. 290 518 Figure 11.-Location of external reference equipment in the CV-340 aircraft.38 8 -1223 -121.7 -121 1 -120.5 -119.9 -119.3 -1187 388 * SACRAMENTO 382 376 37 0 00 -38.2 010 *LINDEN *STOCKTON *OAKLAND I *-SAN FRANCISCO

, *MODESTO MOFFETT FIELD *CROWS *WOODSID
, *MODESTO MOFFETT FIELD *CROWS *WOODSIDE (RADAR)*SANJOSE 3*FRIANT *LOS BANOS *FRESNO 37.6 37 0 -364 36.4 358 *AVENAL *PORTERVILLE 35.8 35 2 -122.3 -121.7 3*BAKERSFIELD -121 1 -120.5 -1199 -119.3 -1187 35.2 Figure 12.-Position reference locations. 67 ORIGINAL PAGE IS OF POOR QUALITY 1 2 3C TH 2 c N 249 lllmN 250M Bz STATION 2ARECEPTION m ASA GATE" t°°a ndcNationa l'Aero°nautics 2 31 Fi~gure 13.-Benchmar

k locatilons at M'offett Field.o
k locatilons at M'offett Field.o68PN TRACKING SYSTEM AP M 0 L TACAN STATION BASE FACI LITI ES R Figure 14.-Benchmark locations at Crows Landing.1 OI A I I T R -OIF radar and data processing TL TL "errors" were primary objective 380 380 360 360 E-Gyro removed 360-. 340 340 320 320 300  300280 280 260 E-Gyro 260failed 240 240" 220 220. 200 200 180 180 160 160 0 f

140 1401 120 120 100  10080
140 1401 120 120 100  10080  8060  6040  4020  , -20-200 -20ORIG~t M 0 -40 -401 --60 -60 60 2400 3000 3600 -Time Figure 20.-Aircraft heading vs time, according to the reference computer (A),flight 9/05C.75-7 5 1651 165 155j-155 No scheduled failure 145 145 135' 135 125 125 115 t115 105S105 95 95 85 81 65 1 65 .5 5 55 '45

MASE -45t .35 35 t 2525TB 25 15 
MASE -45t .35 35 t 2525TB 25 15  ' 1 TSE­2400 3000  3600 Time(MASE) and total squared errorFigure 22 -Maximum allowable squared error  (TSE) for gyros vs tame, reference computer (A), flight 9/05C.77  ORIGhNAL PAGE is OF POOR QUALITY 900 error due scheduled-and-removed E-gyro flight 9/05C. i726­1.26 22"22  E-Gyro taken off line" 1818 1414

 'a1  101 Caused by 1800
 'a1  101 Caused by 18006 F change in azimuth 6" 1 2 E-Gyro degraded21 0 T -2L -642 -64 -10  -101 -1 4-14 I-18-1 -18 -2 2-22 -22'I -26-26 2400 3000 3600 Time Pitch angle error due to a scheduled-and-removed E-gyro failure,Figure 25.-flight 9/05C.80.20 20­18 18­16 16 t 1 4 E-Gyro taken E-Gyro scheduled 1 1I off line failure removed j 12&

#1;12 1 0  10t T488 o I It6 6
#1;12 1 0  10t T488 o I It6 6£4 4 E-Gyro degraded 2  .2 -0 0' -2  -2 -4 -4 -6  -6­2400 3000 3600 Time Figure 26.-Yaw angle error due to a scheduled-and-removed E-gyro failure,flight 9/05C.81  ORIGINAL PAGE M OF POOR QUALITY .8 0 in B --6 88 88­84 -84­80 so 76 -76 72 72 68 68 64 64 60 60 56  56 T52 32 428 48 +. 44 E-Gyro scheduledfl failure removed 12 44-S40

 4036 236 32 32 TT
 4036 236 32 32 TT 28 28 computereB24 24 20 20 .16 16 .12 12 E-Gyro scheduled failure 4-computer B "00 04 00 04 --0 0 00 42400 3000 3600 -0 0 Time Figure 29.-Longitude error due to a scheduled-and-removed E-gyro failure,flight 9/05C84I I I -Position residual trajectory flight ��I &#x/MCI; 0 ;&#x/MCI; 0 ;.0001 &#x/MCI; 1 ;&#x/MCI; 1 ;-_ ­&

#x/MCI; 2 ;&#x/MCI; 2 ;xGyro &#x
#x/MCI; 2 ;&#x/MCI; 2 ;xGyro &#x/MCI; 3 ;&#x/MCI; 3 ;.. .--. --­..-~ ~ ~ _ _ _ _ _ _ . . . -, _ _ _ _ . ... ----data histories '1 1 --_+ _-'- --... . . .. . . . ..--. . . .. -" ---. . . ...... --­-,­..­' -.. . . . .. .. . . .. 103 Maximum allowable INS error for 747, 727, INS-ILS smoothing Experimental-SIRU data 102 747 dual fail passive 7475P, DC-lO, L1011, limits for dual/dual flight c

ontrol fail-operate o 101 Ed := Theor'et
ontrol fail-operate o 101 Ed := Theor'etcal-SI RU -" 44-arcsec quantization "o0 C 4.ao quantization 10 10-1 10-2 10-1 10 101 102 Sensor failure magnitude, deg/hr 103 104 Figure 35 -Theoretical and experimental failure detection and isolation time as a function of failure magnitude SIRU interru4 .4 latitude andSA = nd CLA­--A upiates 4 CMA . Fault No faultr B Output latitude and longitudedata Execute all C

test and diagnostic programs D Output a
test and diagnostic programs D Output all test results E L Waitfor next interrrupt Figure 36.-SIRU software states.E A...* 1 4 7 9 12 15 16 17 19 Report No NASA TM X-73,223 2 Government Accession No 3 Recipients Catalog No Title and Subtitle 5 Report Date FLIGHT TEST RESULTS OF THE STRAPDOWN HEXAD INERTIAL REFERENCE UNIT (SIRU) 6 Performing Organization Code VOLUME II: TEST REPORT A-6973 Author(s) 8 Perf

orming Organization Report No Ronald J.
orming Organization Report No Ronald J. Hruby and William S Bjorkman* 10 Work Unit No Performing Organization Name and Address 513-53-05 Ames Research Center 11 Contract or Grant No Moffett Field, Calif. 94035 Sponsoring Agency Name and Address 13 Type of Report and Period Covered Technical Memorandum National Aeronautics and Space Administration 14 Sponsoring Agency Code Washington, D. C. 20546 Supplementary Notes

*Analytfcal Mechanics Associates, Inc.
*Analytfcal Mechanics Associates, Inc. Mountain View, California 94040 Abstract Results of flight tests of the Strapdown Inertial Reference Unit (SIRU)navigation system are presented. The fault-tolerant SIRU navigation systemfeatures a redundant inertial sensor unit and dual computers. System soft­ware provides for detection and isolation of inertial sensor failures andcontinued operat

ion in the event of failures. Flight tes
ion in the event of failures. Flight test results includeassessments of the system's navigational performance and fault toleranceThis volume (II) contains a detailed description of the flight testprogram and the observed performance of the SIRU inertial navigation system.Performance shortcomings are analyzed. Companion volumes to this one are-Volume I Flight Test SummaryVolum

e III, AppendixesKey Words (Sugg
e III, AppendixesKey Words (Suggested by Author(s)) 18 Distribution Statement Strapdoxon inertial navigationUniteRedundancy management, fault-UnitetoleranceAircraft navigation STAR Category -04Security Classif(of this report) 20 Security Classif (of this ) 21 No of Pages 22 Price* Unclassified Unclassified 96 $5.00*For sate by the National Tprhincl Information Service