/
Terrigenous Sediment Dynamics Terrigenous Sediment Dynamics

Terrigenous Sediment Dynamics - PDF document

genevieve
genevieve . @genevieve
Follow
342 views
Uploaded On 2021-08-06

Terrigenous Sediment Dynamics - PPT Presentation

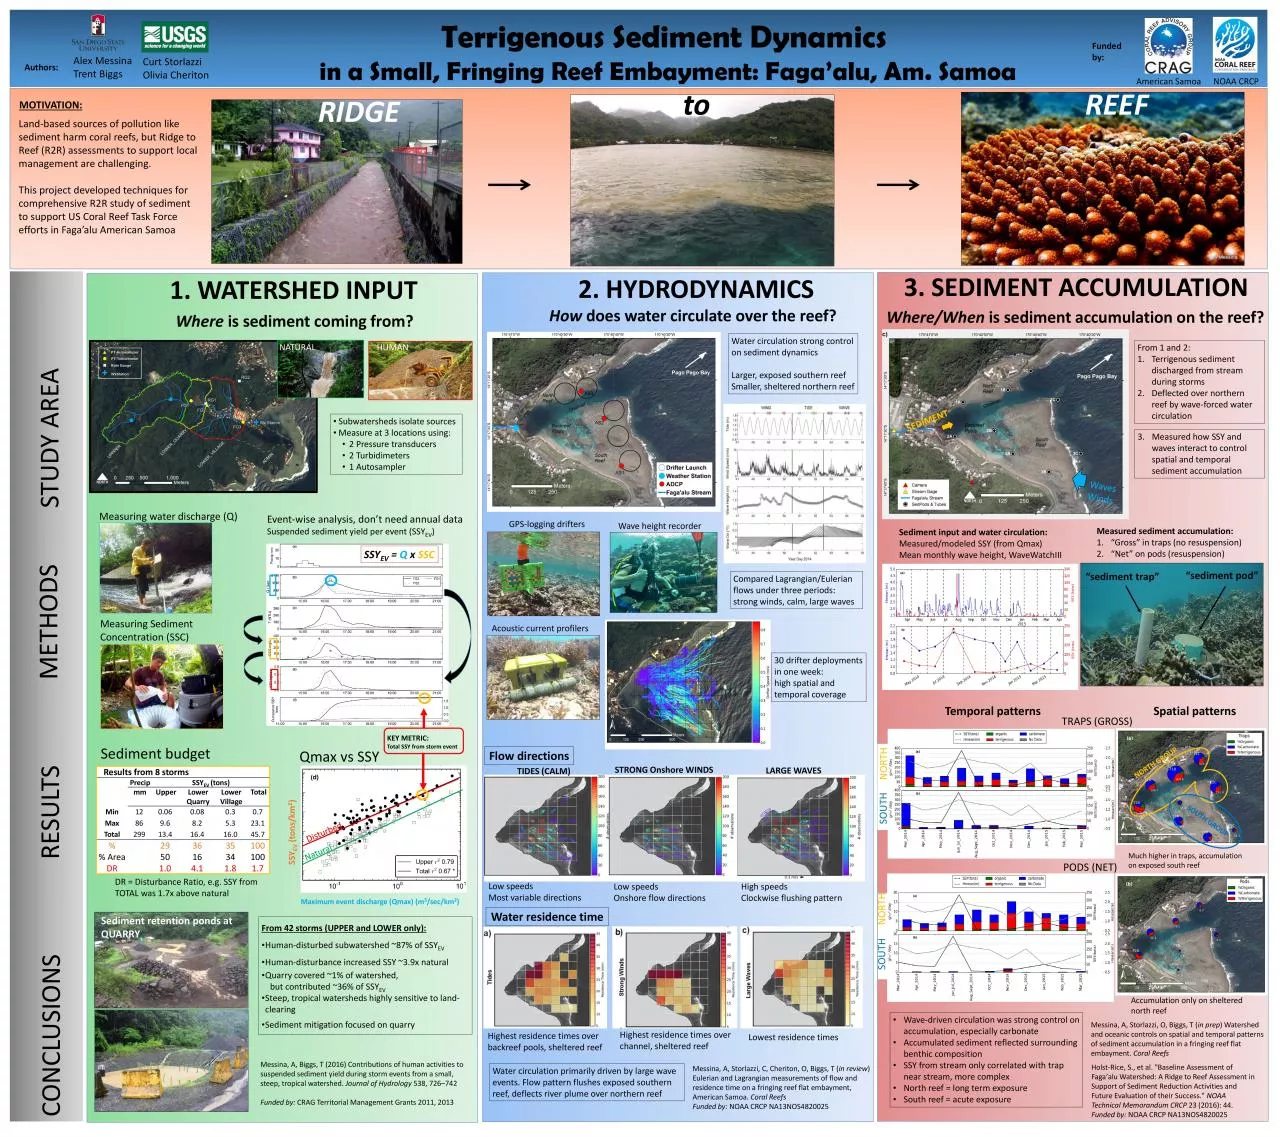
in a Small Fringing Reef EmNayment Fagaalu Am Samoa1 WATERSHED INPUT2 HYDRODYNAMICS3 SEDIMENT ACCUMULATIONRIDGEto REEFSTUDY AREAWhereis sediment coming from Howdoes water circulate over the reefWhere ID: 858227

reef sediment accumulation ssy sediment reef ssy accumulation water watershed circulation residence wave flow quarry north funded total human

Share:

Link:

Embed:

Download Presentation from below link

Download Pdf The PPT/PDF document "Terrigenous Sediment Dynamics" is the property of its rightful owner. Permission is granted to download and print the materials on this web site for personal, non-commercial use only, and to display it on your personal computer provided you do not modify the materials and that you retain all copyright notices contained in the materials. By downloading content from our website, you accept the terms of this agreement.


Presentation Transcript

1 Terrigenous Sediment Dynamics in a Sma
Terrigenous Sediment Dynamics in a Small, Fringing Reef EmNayment: Faga’alu , Am. Samoa 1. WATERSHED INPUT 2. HYDRODYNAMICS 3. SEDIMENT ACCUMULATION RIDGE to REEF STUDY AREA Where is sediment coming from? How does water circulate over the reef? Where/When is sediment accumulation on the reef? METHODS RESULTS CONCLUSIONS Results from 8 storms Precip SSY EV (tons) mm Upper Lower Quarry Lower Village Total Min 12 0.06 0.08 0.3 0.7 Max 86 9.6 8.2 5.3 23.1 Total 299 13.4 16.4 16.0 45.7 % 29 36 35 100 % Area 50 16 34 100 DR 1.0 4.1 1.8 1.7 “sediment trap” “sediment pod” NORTH SOUTH PODS TRAPS (GROSS) PODS (NET) NATURAL HUMAN • Subwatersheds isolate sources • Measure at 3 locations using: • 2 Pressure transducers • 2 Turbidimeters • 1 Autosampler Sediment budget Qmax vs SSY Measuring water discharge (Q) Measuring Sediment Concentration (SSC) KEY METRIC: Total SSY from storm event SSY EV = Q x SSC Event - wise analysis, don’t need annual data Suspended sediment yield per event (SSY EV ) Maximum event discharge ( Qmax) (m 3 /sec/km 2 ) SSY EV (tons/km 2 ) Messina, A, Biggs, T (2016) Contributions of human activities to suspended sediment yield during storm events from a small, steep, tropical watershed. Journal of Hydrology 538, 726 – 742 Funded by: CRAG Territorial Management Grants 2011, 2013 Messina, A, Storlazzi, C, Cheriton , O, Biggs, T ( in review ) Eulerian and Lagrangian measurements of flow and residence time on a fringing reef flat embayment, American Samoa. Coral Reefs Funded by: NOAA CRCP NA13NOS4820025 Messina, A, Storlazzi, O, Biggs, T ( in prep ) Watershed and oceanic controls on spatial and temporal patterns of sediment accumulation in a fringing reef flat embayment . Coral Reefs DR = Disturbance Ratio, e.g. SSY from TOTAL was 1.7x above natural From 42 storms (UPPER and LOWER only): • Human - disturbed subwatershed ~ 87% of SSY EV • Human - disturbance increased SSY ~3.9x natural • Quarry covered ~1% of watershed, but contributed ~36% of SSY EV • S teep, tropical watersheds highly sensitive to land - clearing • Sediment mitigation focused on quarry Sediment retention ponds at QUARRY Water circulation strong control on sediment dynamics Larger, exposed southern reef Smaller, sheltered northern reef Alex Messina Trent Biggs Curt Storlazzi Olivia Cheriton Authors: Funded by: Compared Lagrangian/Eulerian flows under three periods: strong winds, calm, large waves GPS - logging drifters Acoustic current profilers 30 drifter deployments in one week: high spatial and temporal coverage TIDES (CALM) STRONG Onshore WINDS LARGE WAVES Low speeds Most variable directions Low speeds Onshore flow directions High speeds Clockwise flushing pattern Wave height recorder Highest residence times over backreef pools, sheltered reef Flow directions Water residence time Highest residence times over channel, sheltered reef Lowest residence times Water circulation primarily driven by large wave events. Flow pattern flushes exposed southern reef, deflects river plume over northern reef TRAPS SOUTH NORTH From 1 and 2: 1. T errigenous sediment discharged from stream during storms 2. Deflected over northern reef by wave - forced water circulation 3. Measured how SSY and waves interact to control spatial and temporal sediment accumulation Sediment input and water circulation: Measured/modeled SSY (from Qmax) Mean monthly wave height, WaveWatchIII Measured sediment accumulation: 1. “Gross” in traps (no resuspension) 2. “Net” on pods (resuspension) Temporal patterns Spatial patterns Much higher in traps, accumulation on exposed south reef Accumulation only on sheltered north reef • Wave - driven circulation was strong control on accumulation, especially carbonate • Accumulated sediment reflected surrounding benthic composition • SSY from stream only correlated with trap near stream, more complex • North reef = long term exposure • South reef = acute exposure American Samoa NOAA CRCP Land - based sources of pollution like sediment harm coral reefs, but Ridge to Reef (R2R) assessments to support local management are challenging. This project developed techniques for comprehensive R2R study of sediment to support US Coral Reef Task Force efforts in Faga’alu American Samoa MOTIVATION: Holst - Rice, S., et al. "Baseline Assessment of Fagaʻalu Watershed: A Ridge to Reef Assessment in Support of Sediment Reduction Activities and Future Evaluation of their Success." NOAA Technical Memorandum CRCP 23 (2016): 44. Funded by: NOAA CRCP NA13NOS4820025