/
Illinois Sediment Acoustics Illinois Sediment Acoustics

Illinois Sediment Acoustics - PowerPoint Presentation

jane-oiler
jane-oiler . @jane-oiler
Follow
345 views
Uploaded On 2018-11-03

Illinois Sediment Acoustics - PPT Presentation

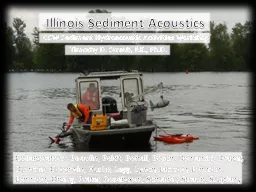
Timothy D Straub PE PhD Collaborators Beaulin Boldt Bohall Bosch Domanski Draper Duncker Goodwin Husko Legg Lynch Jackson Johnson Johnson Oberg Prater ID: 711755

illinois sediment peak previous sediment illinois previous peak drainage backscatter corrected oberg data coefficient 000 setup 05579630 kickapoo storms

Share:

Link:

Embed:

Download Presentation from below link

Download Presentation The PPT/PDF document "Illinois Sediment Acoustics" is the property of its rightful owner. Permission is granted to download and print the materials on this web site for personal, non-commercial use only, and to display it on your personal computer provided you do not modify the materials and that you retain all copyright notices contained in the materials. By downloading content from our website, you accept the terms of this agreement.


Presentation Transcript

Slide1

Illinois Sediment Acoustics

Timothy D. Straub, P.E., Ph.D.

Collaborators:

Beaulin, Boldt, Bohall, Bosch, Domanski, Draper, Duncker, Goodwin, Husko, Legg, Lynch, Jackson, Johnson, Johnson, Oberg, Prater, Roseboom, Schrader, Straub, Szupiany

OSW Sediment

Hydroacoustic

Activities WorkshopSlide2

15 Sediment Gages~2,000 samples per year7 Cooperators5 Technicians in 3 offices

Project Oriented Dam Removal RestorationOPERATIONAL NOT A RESEARCH focusi.e. 5 Sediment Acoustic sites slow addition

Illinois Sediment Network Background

135442Slide3

Site 1:

Predominantly Agricultural

Drainage Ditch

14 mi2 drainage areaUp-looker usedNearly 100 % finesin suspensionNo near field correctionsSlide4

Sediment Concentration and Attenuation Coefficient

Two October Storms at Kickapoo (05579630)Slide5

Sediment Concentration and Attenuation Coefficient

October 2009 Storms at Kickapoo (05579630)Slide6

1,636 mi

2

drainage

areaUp to ~25 % sands in suspensionSide-looker: on-going problems with debris on instrumentWake zone?Site 2:One of the largest contributors of sediment to the Illinois RiverSlide7

Partial cleanup of data

(negative slopes taken out)

Results with

only two cells used-no near field correction-wake zone?Slide8
Slide9

FISP Funded 2011-2012

LISST-SL Experience and

Testing Results in IllinoisSlide10

Typical Bridge SetupSlide11

Automation

Software Development

Beta Sediment Stationary Add-in

by Boldt, Szupiany, Czuba, and Oberg into VMT by Parsons, Jackson, Czuba, Mueller, and ObergSlide12

Beta Add-inAnimationSlide13

FUTURE Illinois

Sediment

NetworkSlide14

Previous Peak 37.24’

Previous Peak 34.56’

Previous Peak 39.01’

Previous Peak 26.04’Slide15

Next Steps for OSW?

Compile data from across the nation/world

Interim guidelinesThree or more iterations emergingVerification datasetUtilizing existing index velocity sites

10x10x(200+200)=$40,000Slide16
Slide17

Additional Complications

Setup

Launches

Data transmissionCablesTemperaturePowerSiltingDebrisSlide18

Measured

, and

Water

and Sediment Corrected BackscatterSlide19

Multiple

Water Corrected Backscatter ReadingsSlide20

The SAME Multiple

Readings, but for

Sediment Corrected Backscatter