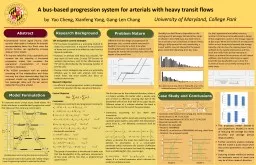
HAVING HEAVY TRANSIT FLOWS Yao Cheng 11252014 Thesis Defense for the Degree of Master of Science Transit Signal Priority TSP Transit system Active control strategies Busbased progression ID: 589704
Download Presentation The PPT/PDF document "AN INTEGRATED BUS-BASED PROGRESSION SYST..." is the property of its rightful owner. Permission is granted to download and print the materials on this web site for personal, non-commercial use only, and to display it on your personal computer provided you do not modify the materials and that you retain all copyright notices contained in the materials. By downloading content from our website, you accept the terms of this agreement.
Slide1
AN INTEGRATED BUS-BASED PROGRESSION SYSTEM FOR ARTERIALS HAVING HEAVY TRANSIT FLOWS
Yao Cheng11/25/2014
Thesis Defense for the Degree of Master of ScienceSlide2
Transit Signal Priority (TSP)
Transit system
Active control strategies
Bus-based progression
Bus operational features
Source: Sustainable Transportation in the Netherlands Slide3
Outline
Literature ReviewProblem Nature and Modelling FrameworkMethodology
Case Study
Conclusions and Future StudySlide4
Literature Review
T
he concept of TSP has been developed since late 1960s
(Smith, 1968)
.
A
ctive strategies
detect the arrival of buses
and grant a priority to them.
(
Ludwick & John, 1974; Dion & Hesham, 2005)Passive strategies
do not recognize the presence of buses, but predetermine the signal timings to facilitate bus movements. (Urbanik, 1977)Limitations of TSP strategiesSignificant negative impact to cross-street traffic
if the target arterials experience heavy bus volumesMay interrupt the conventional signal progression designSlide5
Literature ReviewSignal progression, first presented by Morgan and Little (1964), is studied mainly for
passenger cars.Allow some vehicles to pass consecutive intersections
without encountering red phases
.
Reduce accidents
MAXBAND (Little et al., 1981)
MULTIBAND (Gartner et al., 1990)Bus progression is a promising passive strategy to improve the operational efficiency of transit system with
minimized negative impact to cross-street trafficbenefits to transit vehicles on an arterial
outbound
inboundSlide6
Outline
Literature ReviewProblem Nature and Modelling FrameworkMethodology
Case Study
Conclusions and Future StudySlide7
Critical issues
Dwell time at bus stops
Dwell time uncertainty
Bus stop capacity
Competition between buses and PCsSlide8
Critical issues
Dwell time at bus stops
Dwell time uncertainty
Bus stop capacity
Competition between buses and PCs
Transit vehicles, impacted by the dwell time at stops, may not stay in the green
band designed for passenger cars.Slide9
Critical issues
Dwell time at bus stops
Dwell time uncertainty
Bus stop capacity
Competition between buses and PCs
D
eterministic dwell time
VS
.
S
tochastic dwell
time
T
he
stochastic nature
of bus dwell
time
should be considered when
studying bus progression.Slide10
Critical issues
Dwell time at bus stops
Dwell time uncertainty
Bus stop capacity
Competition between buses and PCs
Is the
w
ider
band
always
b
etter?
T
he
number of
buses
in a band
shall
not exceed the capacity of the bus stop to
prevent the formation of bus queues.Slide11
Critical issues
Dwell time at bus stops
Dwell time uncertainty
Bus stop capacity
Competition between buses and PCs
The bus band and passenger-car band may need to be optimized concurrently.Slide12
Critical issues
Dwell time at bus stops
Dwell time uncertainty
Bus stop capacity
Competition between buses and PCs
A deterministic model
An evaluation module
Following the concept of MAXBAND, a Mixed-Integer Linear Programming model is developed .
Taking advantage of the results produced from the deterministic model, an evaluation module is developed to fully account for the stochastic nature of bus dwell time.
Modelling Framework
A progression model for buses
An enhanced deterministic model
An enhanced evaluation module
A integrated model for both buses and PC s
Integrating passenger car’s benefitsSlide13
Outline
Literature ReviewProblem Nature and Modelling FrameworkMethodology
Case Study
Conclusions and Future Study
A deterministic model
An evaluation module
An integrated modelSlide14
Mixed Integer Linear ProgrammingObjective function
ConstraintsInterference constraints
Methodology
Discussion of parameter
:
is a weight factor
The value of
depends on the number of buses passing intersection
using the synchronized phase.
A deterministic model
Taking each bus stop as a control
pointSlide15
Constraints
Progression constraintsFor links with bus stopsOutboundI
nbound
For other intersections
Outbound
Inbound
Methodology
A deterministic model
Average dwell time
Dwell time at bus stopsSlide16
Constraints (bus stop capacity)
Bandwidth limitOutbound
Inbound
These constraints are only for upstream intersections of bus stops
The center of a band
s
hould be either close to the start of green
or close to the end of green
t
o make sure that the potential band is realistic.
: a predetermined maximum bandwidth
: a big number
: a binary variable
Methodology
A deterministic model
Bus stop capacitySlide17
Other ConstraintsBandwidth equalityFor links without bus stops
Dwell time uncertaintyFor links with bus stops
Methodology
A deterministic model
For those buses passing the upstream intersection during
, if the dwell time uncertainty is within a specific range, the departing band should accommodate them.
: between 0 and 1
: indicating the tolerance of dwell time uncertainty
Slide18
Methodology
A deterministic model
Objective Function
Constraints
Interference constraints
For adjacent intersections between which that a stop is located
Progression constraints
Bandwidth constraints
Dwell time uncertainty
For other intersections
Progression constraints
Bandwidth equalitySlide19
Methodology
A deterministic model
An evaluation module
A progression model for buses
An enhanced deterministic model
An enhanced evaluation module
A integrated model for both buses and PC s
Integrating passenger car’s benefitsSlide20
Methodology
By adjusting
parameters in this
critical constraint, one may have multiple
sub-optimal solutions
.
They will be
evaluated and ranked
, fully taking the
stochastic nature
of bus dwell time into consideration.
Upstream
Downstream
An evaluation moduleSlide21
Methodology
An evaluation module
Computational complexity
Still describing the
relation
between the arriving bandwidth and the departing bandwidth
Still ensuring a relatively
large
departing
bandwidth
based
on its
arriving bandwidth
A
lthough
the
dwell time variance
is no longer considered in
the constraints, the
analysis to sub-optimal solutions applies a
more rigorous method
to assess the impact of dwell time variance
Discussion of parameter
:
Different values lead to different “optimal” solutionA Greater value for
ensures a higher probability of a bus to keep in the band
A Smaller value for
allows a larger arriving bandwidthA too Large value for leads to meaningless upstream bands. Slide22
Methodology
How effective a signal plan is highly depends on the relation between each pair of bands arriving to and departing from a bus stop.To evaluate the sub-optimal solutions, this module computes the expectation of the fraction of the arriving bandwidth which can be
effectively utilized
.
This expectation is called “
effective bandwidth
”.
An evaluation moduleSlide23
An evaluation module
Methodology
In order to compute the effective bandwidths, one first needs to calculate the probability of a bus to keep in the band.Slide24
An evaluation module
Methodology
P
robability for the bus coming at time
x
to stay in the downstream band
For outbound
For inbound
Calculate the “effective bandwidth”
is the “effective” part among a short period of time
The “effective bandwidth” can be calculated by
For outboundFor inbound
For an intersection that is not at upstream of a bus stop:
Dwell time uncertaintySlide25
A larger “effective bandwidth” indicates a higher fraction of the buses which can stay in
both the arriving and departing bands.Each solution from the deterministic model will generate
effective bandwidths, an outbound one and an inbound one for each intersection, where
is the number of intersections.
The solution giving the
maximum sum
of effective bandwidths can be considered as the optimal solution for the model.
An evaluation module
MethodologySlide26
An evaluation module
Methodology
Cycle length, green split, travel time, estimated bus dwell time….
Each solution has a set of bandwidths and offsets
Find the solution with the maximum total effective bandwidthsSlide27
Methodology
A deterministic model
An evaluation module
A progression model for buses
An enhanced deterministic model
An enhanced evaluation module
A integrated model for both buses and PC s
Integrating passenger car’s benefitsSlide28
Methodology
An integrated model
Designing bus bands causes
potential interruption
for passenger car movements.
Even with the same bus bands, the benefit for passenger cars can be
different among signal plans
.Slide29
Methodology
Therefore, the bus bands and the passenger car bands need to be optimized concurrently.
An integrated model
An enhanced deterministic model
An enhanced evaluation module
Revising the objective function to include
bands for both types of vehicles
.
Revising the constraints to
express passenger car bands
.
When comparing the sub-optimal solutions, both effective bandwidths for buses and
passenger car bandwidths are considered.Slide30
Objective functionAdditional constraintsTo balance the
bus bands and the passenger-car bands and avoid one dominating the other, Constraints to express passenger-car bands
Methodology
An integrated model
Ratio between numbers of passengers on two types of vehicles
Competition between buses and PCs
An enhanced deterministic model
k
<1: Passengers on PCs are less
k
>1: Passengers on buses are lessSlide31
Enhancement to the stochastic analysisThe ranking index of a sub-optimal solution includes both effective bandwidth of bus bands and passenger-car bands
Methodology
Total effective bandwidths
Total passenger-car bandwidths
An integrated model
An enhanced evaluation moduleSlide32
Methodology
Cycle length, green split, travel time, estimated bus dwell time….
Each solution has a set of bandwidths and offsets
Find the solution with the maximum ranking index
An integrated modelSlide33
Methodology
A deterministic model
An evaluation module
Following the concept of MAXBAND, a Mixed-Integer Linear Programming model is developed .
By adjusting a parameter in the MILP, multiple sub-optimal solutions will be produced and evaluated, accounting for the stochastic nature of bus dwell time.
A progression model for buses
An enhanced deterministic model
An enhanced evaluation modul
e
A integrated model for both buses and PC s
Integrating passenger car’s benefits
Benefits of both buses and passenger cars are considered.
Dwell time at bus stops
Bus stop capacity
Dwell time uncertainty
Competition between buses and PCsSlide34
Outline
Literature ReviewProblem Nature and Modelling FrameworkMethodology
Case Study
Conclusions and Future StudySlide35
Case Study
Case Design
Link
Link length (ft)
travel time
With bus stop?
I↔II
906
20
Yes
II↔III
948
21
No
III↔IV
1250
28
Yes
IV↔V
725
16
Yes
C
ycle length is
150 seconds;
G
reen times at intersections are 99 , 77 , 66, 75, and 60 seconds, respectively;The dwell time:
bus stop 1: N(30,9); bus stop 2: N(27,7); bus stop 3: (24,9);
The bus stop capacity is 2 buses at each direction, and the confidence parameter
p equals 0.95; then the maximal bus bandwidth could be computed as 50
seconds
For each direction along the arterial, the bus volume is 60
veh
/h, with an average headway of 1.0 minute and the passenger car volume is
750
veh
/h;Slide36
Case Study
Models to be evaluatedModel-1: MAXBAND with fixed phase sequencesModel-2: A direct extension of MAXBAND by adding the average bus dwell time to the travel time on the links having a bus stop.
Model-3:
The proposed deterministic model
Model-4: The proposed deterministic model with
the evaluation module
Model-5: The proposed integrated modelThe MILP is solved with LINGO. The evaluation module is conducted with R studio.Slide37
Case Study
Task 1: Bandwidths and performance measures generated by bus progression models will first be compared to verify the
necessity of the
evaluation module
.
Task 2:
Then the signal plans generated by all Models will be applied in the simulation software, VISSIM, and will be evaluated based on the average delays and number of stops.
Task 3: Sensitivity Analysis will then be conducted with respect to the number of passengers on buses to assess the stability of the proposed
integrated model.Slide38
Case Study
MAXBAND with extension
The deterministic model
The deterministic model + the evaluation stage
Fixed bandwidths
V
arying bandwidths
Bandwidths limited by the capacity constraintsSlide39
Case Study
Offsets (s) at Intersection No.
α
β
1
2
3
4
5
Model-3-1
0.3
1
0
102
101
40
38
Model-3-2
0.3
2
0107
104
3843
Model-3-3
0.5101059837
41Model-3-4
0
10
99
104
25
35
Model-3-5
0.1
2
0
104
99
41
40
The deterministic model + the evaluation stage
To verify the necessity of the evaluation module, several sets of parameters for Model-3 are tested. Slide40
Case study
Model-1: MAXBAND with fixed phase sequences
Model-2: A direct extension of MAXBAND
Model-4
: The proposed deterministic model with
the evaluation ranking stage
Model-5: The proposed integrated model
The models which take bus progression into consideration, are able to offer operational benefits to bus vehicles on the target arterial, evidenced by
reduction in the average bus delay.
Model-2 may yield a slight reduction in bus delay. This is due to that Model-2 has
ignored the stochastic nature
of bus dwell time at bus stops.
Model-2 and 4
outperform
Model-1, and Model-5 outperforms both Model-2 and Model-4Slide41
Case Study
Loading factor on buses
Passenger
ratio k
12
0.8
18
1.2
30
2
7.5
0.5
It can be expected that the integrated model
should be only applied when the
difference between numbers
passengers on
two types of vehicles is
small
When the number of passengers on buses dominates that on passenger cars, bus progression model may be preferred, and vice versa
.
The
system performance is quite sensitivity to the preference factor
k Slide42
Case Study
Model-5, an integrated progression model that accounts for
both buses and passenger cars
, performs better when the ratio between passengers on the two types of vehicles is
close to
1
,
as expected.
This may be because the constraints in the integrated guarantee both bus bands and passenger car bands which is unnecessary and may limit the bandwidth for the type of vehicle with significantly higher volume.Slide43
Outline
Literature ReviewProblem Nature and Modelling FrameworkMethodology
Case Study
Conclusions and Future StudySlide44
Conclusions
Due to the limited functions of the active transit signal priority control and the strengths of arterial signal progression, this study has developed a bus progression system to facilitate bus movements on an arterial.
The key features of the developed model
include:
1
) the impact of bus dwell time at a bus stop between intersections on the progression design;
2) the stochastic nature of bus dwell time;3
) the capacity of bus stops; and 4) the competition on the green band between buses and passenger cars
The simulation results demonstrate that the proposed model can reduce both bus passenger delays and average person delays for vehicles in the entire network, compared to the conventional progression models.Slide45
Future ResearchDeveloping
a set of rigorous criteria that can compute the trade-off between bus based and passenger-car-based progression models and select the proper one in real time based on the detected traffic conditionsAn extensive sensitivity analysis with field data and simulation experimentsSlide46
Thank youQuestions and CommentsSlide47
Methodology
How to determine
?
Probability of
buses being in a band
is
Where,
is bus arrival rate and
is bandwidth of band
The probability that the number of buses in a band does not exceed the capacity should be greater than a predetermined
, which can be expressed as,
Where,
is the bus stop capacity
Then
can be determined by
A deterministic modelSlide48
An evaluation module
How to determine
?
1) set a minimum band
and
2)
3)
4)
5) the number of different values of
is
A band smaller than that is meaningless operationally.
Based on the bandwidth resolution of 1 second
The smaller one among
and the green time
upper bound
lower bound
Minimum interval
Methodology