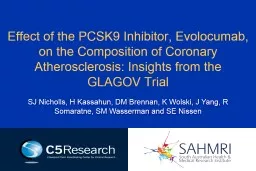
/
 Effect of the PCSK9 Inhibitor,  Effect of the PCSK9 Inhibitor,

Effect of the PCSK9 Inhibitor, - PowerPoint Presentation

giovanna-bartolotta
giovanna-bartolotta . @giovanna-bartolotta
Follow
346 views
Uploaded On 2020-04-03

Effect of the PCSK9 Inhibitor, - PPT Presentation

Evolocumab on the Composition of Coronary Atherosclerosis Insights from the GLAGOV Trial SJ Nicholls H Kassahun DM Brennan K Wolski J Yang R Somaratne SM Wasserman and SE Nissen ID: 774851

baseline evolocumab change plaque baseline evolocumab change plaque statin mm3 calcium compared ldl core volume analysis dense exploratory measures

Share:

Link:

Embed:

Download Presentation from below link

Download Presentation The PPT/PDF document " Effect of the PCSK9 Inhibitor, " is the property of its rightful owner. Permission is granted to download and print the materials on this web site for personal, non-commercial use only, and to display it on your personal computer provided you do not modify the materials and that you retain all copyright notices contained in the materials. By downloading content from our website, you accept the terms of this agreement.


Presentation Transcript

Slide1

Effect of the PCSK9 Inhibitor, Evolocumab, on the Composition of Coronary Atherosclerosis: Insights from the GLAGOV Trial

SJ Nicholls, H Kassahun, DM Brennan, K Wolski, J Yang, R Somaratne, SM Wasserman and SE Nissen

Slide2

Disclosures

Research support: AstraZeneca, Amgen,

Anthera

, Eli Lilly, Esperion, Novartis,

Cerenis

, The Medicines Company,

Resverlogix

,

InfraReDx

, Roche, Sanofi-Regeneron and

LipoScience

Consulting and honoraria: AstraZeneca, Eli Lilly,

Anthera

,

Omthera

, Merck, Takeda,

Resverlogix

,

Sanofi-Regeneron

, CSL Behring,

Esperion

,

Boehringer

Ingelheim

Slide3

Background

The

PCSK9 inhibitor,

evolocumab

, lowers LDL-C, induces plaque regression on IVUS and reduces CV events in statin-treated ASCVD patients

The impact of PCSK9 inhibition on the composition of coronary atheroma has not been investigated.

Virtual histology is an experimental technique which characterizes plaque composition and may have utility in assessing effects of anti-atherosclerotic therapies.

Slide4

Placebo SC monthly

Evolocumab

420 mg SC monthly

Randomization

End of Study IVUS

Up to 4 week lipid stabilization period

Screening, placebo run-in period

Coronary Angiogram

Baseline IVUS

2-4 weeks

Max. 6 weeks

0

4

12

24

36

52

64

70

76

80

Week

968 patients with angiographic CAD, stable statin dose and LDL-C

≥80 mg/

dL

OR 60-80 mg/

dL

and 1 major or 3 minor risk factors

GLAGOV Trial Schematic

Slide5

GLAGOV VH Substudy

Determine if

evolocumab

produced changes in VH-derived plaque components (dense calcium, fibrous,

fibrofatty

, necrotic core) compared with placebo in 331 patients with evaluable VH imaging.

The

prespecified

statistical plan sought to compare changes in volumetric measures, adjusting for baseline values and multiple comparisons.

The primary endpoint was the absolute change in dense calcium volume

from baseline to week 78.

Slide6

Baseline Demographics and Statin Usage

Characteristic

Placebo (n=167)

Evolocumab

(n=164)

Age

59.7

59.3

Male Gender

76.0%

70.7%

BMI (kg/m

2)

29.5

29.7

Diabetes

16.2%

18.9%

Smoking

22.2%

29.9%

Baseline statin use

99.4%

98.8%

High intensity

57.5%

59.8%

Moderate intensity

41.3%

37.8%

Baseline LDL-C (

mg/

dL

)

92.0

90.9

Baseline CRP (mg/L)

1.5

1.7

Slide7

Percent Change in Biochemical Parameters

CharacteristicPlacebo (n=167)Evolocumab (n=164)P ValueLDL Cholesterol+0.6%-62.8%***<0.0001HDL Cholesterol+7.5%***+11.6%***0.02Triglycerides+2.7%*-11.5%**0.0002CRP-21.4%-6.7%**0.11Lp(a)-2.5%-22.7%***<0.0001

* P<0.05, ** P<0.01 and *** P<0.0001 compared with baseline

Slide8

Change in Measures of Plaque Burden

CharacteristicPlacebo(n=167)Evolocumab (n=164)P ValuePAV (%)+0.17-1.20*<0.0001TAV (mm3)-0.8-3.6*0.04PAV regressors (%)46.168.3<0.0001TAV regressors (%)53.364.60.04

PAV: percent atheroma volume; TAV: total atheroma volume. * P<0.0001 compared with baseline

Slide9

Primary Endpoint: Change in Normalized Dense Calcium Volume

0.6*

1.0**

P=0.49***

Statin Monotherapy

Statin +

Evolocumab

* P<0.05 and ** P<0.001 compared with baseline (exploratory analysis). *** Hochberg adjusted p value

Slide10

Secondary Endpoint: Change in Volume of Other VH Parameters

* P<0.01 and ** P<0.001 compared with baseline (exploratory analysis). *** Hochberg adjusted p value

-3.0*

P=0.49***

P=0.49***

P=0.49***

-5.0**

-2.4**

-3.0**

-0.6

-0.1

Statin Monotherapy

Statin +

Evolocumab

Fibrofatty

Necrotic Core

Fibrous

Slide11

Secondary Endpoint: Absolute Change in VH-Derived Percentage Plaque Measures

CharacteristicPlacebo (n=167)Evolocumab (n=164)P Value**Dense calcium (%)+1.00.4*+2.20.4*0.10Fibrofatty (%)-0.91.1-1.61.10.67Fibrous (%)-0.60.8-1.40.80.67Necrotic core (%)+0.40.5+0.90.60.67

* P<0.01 compared with baseline (exploratory analysis) **Hochberg adjusted

Slide12

Correlation Between Change in VH Measures and Biochemical Parameters

Characteristic

Change LDL-C

Change CRP

Dense calcium

r =

-0.15

r =

0.07

Fibrofatty

r =

0.03

r =

-0.04

Fibrous

r =

0.06

r =

-0.01

Necrotic core

r =

-0.01

r =

0.07

Slide13

Exploratory Analysis: Change in VH-Derived Plaque Measures and Regression

CharacteristicTertiles of Change PAV (%)P Value<-1.57-1.57 – 0.57>0.57Dense calcium (mm3)0.50.30.90.3**1.00.3**0.65Fibrofatty (mm3)-6.31.2**-3.71.2**-2.01.20.03Fibrous (mm3)-6.30.7**-2.30.7**0.50.8<0.001Necrotic core (mm3)-2.60.6**0.10.61.30.6*<0.001

* P<0.05 and ** P<0.01 compared with baseline

Slide14

Exploratory Analysis: Baseline LDL-C <70 mg/dL

CharacteristicPlacebo (n=26)Evolocumab (n=35)P ValueDense calcium (mm3)+0.40.8-0.31.70.54Fibrofatty (mm3)-6.03.1-6.72.6**0.87Fibrous (mm3)-0.82.0-3.41.7*0.32Necrotic core (mm3)+0.41.4-2.91.2*0.08

* P<0.05 and ** P<0.01 compared with baseline

Slide15

Conclusion

Evolocumab

on a background of optimal statin therapy produced robust lowering of LDL cholesterol and plaque regression by conventional IVUS.

However, VH imaging failed to detect any difference between treatment groups for individual plaque components.

These findings further fuel uncertainty regarding the utility of VH imaging in drug development to assess the effect of anti-atherosclerotic therapies.

Slide16

Final Thoughts

The inverse correlation between changes in LDL cholesterol and plaque calcium supports prior reports in studies of high intensity statins.

While the underlying mechanism remains uncertain, it questions the use of serial calcium scoring to monitor responses to lipid lowering interventions.

VH yields predictable, but not incremental information, in the setting of plaque regression. It will be of interest to see if other modalities can provide better insights.