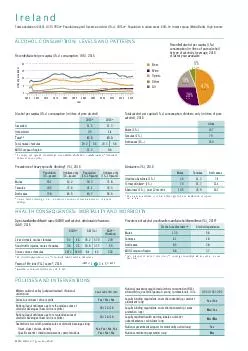
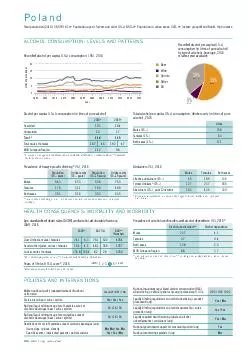
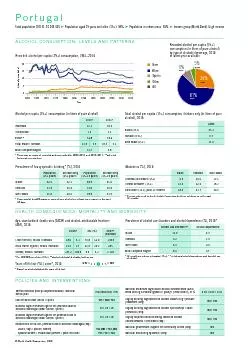
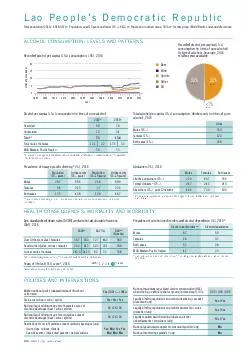
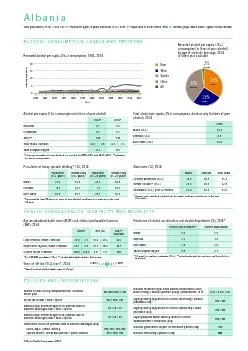
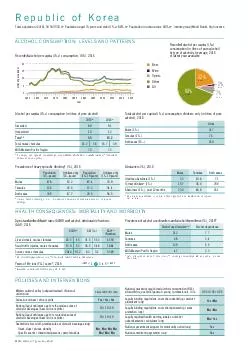
PDF-Q Beer Q Wine Q Spirits Q Other Q All Litres of pure alcohol Year Recorded

Author : giovanna-bartolotta | Published Date : 2014-10-15

57513 World Health Organization 2014 57513 World Health Organization 2014 Alcohol per capita 15 consumption in litres of pure alcohol Average 20032005 Average 20082010

Presentation Embed Code

Download Presentation

Download Presentation The PPT/PDF document "Q Beer Q Wine Q Spirits Q Other Q All ..." is the property of its rightful owner. Permission is granted to download and print the materials on this website for personal, non-commercial use only, and to display it on your personal computer provided you do not modify the materials and that you retain all copyright notices contained in the materials. By downloading content from our website, you accept the terms of this agreement.

Q Beer Q Wine Q Spirits Q Other Q All Litres of pure alcohol Year Recorded: Transcript


57513 World Health Organization 2014 57513 World Health Organization 2014 Alcohol per capita 15 consumption in litres of pure alcohol Average 20032005 Average 20082010 Change Recorded 114 115 Unrecorded 47 36 Total 161 151 Total males females 239 7. 2 22 Alaska 475298 49 513228 287 27 Arizona 4436917 14 4663900 295 25 Arkansas 1823822 34 2119568 267 37 California 22317858 27136252 255 44 Colorado 3628449 21 3743962 300 24 Connecticut 1883859 32 2637510 221 50 Delaware 727676 46 671947 336 14 Dis Beer Wine Spirits Other All 15 5 10 1960 1965 1975 1990 Year 1970 1980 2000 0 20 1995 1985 2005 2010 Alcohol per capita (15+) consumption (in litres of pure alcohol) Average 2003–2005 Average 2 Beer Wine Spirits Other All 15 5 10 1960 1965 1975 1990 Year 1970 1980 2000 0 20 1995 1985 2005 2010 Alcohol per capita (15+) consumption (in litres of pure alcohol) Average 2003–2005 Average 2 Beer Wine Spirits Other All 15 5 10 1960 1965 1975 1990 Year 1970 1980 2000 0 20 1995 1985 2005 2010 Alcohol per capita (15+) consumption (in litres of pure alcohol) Average 2003–2005 Average 2 …. . but . we . mean serious business. The . All India Brewers` . Association (AIBA) . is . an independent . body representing . the common face and voice . interests of brewing industry of . Beer Wine Spirits Other All 15 5 10 1960 1965 1975 1990 Year 1970 1980 2000 0 20 1995 1985 2005 2010 Alcohol per capita (15+) consumption (in litres of pure alcohol) Average 2003–2005 Average 2 Beer Wine Spirits Other All 15 5 10 1960 1965 1975 1990 Year 1970 1980 2000 0 20 1995 1985 2005 2010 Alcohol per capita (15+) consumption (in litres of pure alcohol) Average 2003–2005 Average 2 Beer Wine Spirits Other All 15 5 10 1960 1965 1975 1990 Year 1970 1980 2000 0 20 1995 1985 2005 2010 Alcohol per capita (15+) consumption (in litres of pure alcohol) Average 2003–2005 Average 2 Beer Wine Spirits Other All 15 5 10 1960 1965 1975 1990 Year 1970 1980 2000 0 20 1995 1985 2005 2010 Alcohol per capita (15+) consumption (in litres of pure alcohol) Average 2003–2005 Average 2 School of economics. 16-18 July 2014. Alcohol tax, price and consumption. Corné. van . Walbeek. Alcohol excise taxes. Alcohol taxation in South Africa. Beer and spirits: . Taxed since at least 1910. Adelaide | Australia. . 2015 Winegrowing Report. Peter Bailey – Wine Australia. WWTG November 2015 | Adelaide Australia. Presentation Outline. Content . Consumer Value of Wine. Vineyards. Grape Production. June 18, 2017. Thank You All. All our volunteers who helped with today’s meeting.. Set-up and Breakdown. . Ed and Barb . Raulsome. Food . Pairing . Jim and Kathy Hill.   . Future AWS/Chapter Events. . 2015 Winegrowing Report. Peter Bailey – Wine Australia. WWTG November 2015 | Adelaide Australia. Presentation Outline. Content . Consumer Value of Wine. Vineyards. Grape Production. Wine Production. Craft Beer Market report provides the future growth trend of the market based on in-depth research by industry experts.The global and regional market share along with market drivers and restraints are covered in the report. View More @ https://www.valuemarketresearch.com/report/craft-beer-market

Download Document

Here is the link to download the presentation.
"Q Beer Q Wine Q Spirits Q Other Q All Litres of pure alcohol Year Recorded"The content belongs to its owner. You may download and print it for personal use, without modification, and keep all copyright notices. By downloading, you agree to these terms.

Related Documents