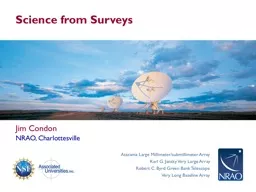
Jim Condon NRAO Charlottesville Why make radio surveys Detect most sources in fluxlimited populations Discover detect and recognize new source types and phenomena Characterize source populations ID: 539766
Download Presentation The PPT/PDF document "Science from Surveys" is the property of its rightful owner. Permission is granted to download and print the materials on this web site for personal, non-commercial use only, and to display it on your personal computer provided you do not modify the materials and that you retain all copyright notices contained in the materials. By downloading content from our website, you accept the terms of this agreement.
Slide1
Science from Surveys
Jim Condon
NRAO, CharlottesvilleSlide2
Why make radio surveys?Detect most sources in flux-limited populationsDiscover (detect and recognize) new source types and
phenomenaCharacterize source populations: Multiwavelength cross-identifications, redshifts, SEDs
Classify (AGNs, star-forming galaxies, cluster relics, pulsars, …) Radio spectrum, polarization, angular size, variability, transients, … Statistical properties (luminosity functions, size distributions,
evolution of AGNs and star formation, ...
Statistical cosmology: BAOs, weak lensing, EORStudy foregrounds (Galactic magnetic fields, cluster magnetic fields)Remove foregrounds (from EOR, CMB)Produce reference sky images and catalogs for others to use
Science at Low Frequencies III. 2016 Dec 7
2Slide3
The universe isnot empty
Most sourcesare extragalacticScience at Low Frequencies III. 2016 Dec 73
GalacticcenterSlide4
Science at Low Frequencies III. 2016 Dec 74
… very extragalactic Slide5
AGNs and star-forming galaxiesScience at Low Frequencies III. 2016 Dec 75
AGN
Star-forming galaxiesSlide6
Source counts and angular sizes?Science at Low Frequencies III. 2016 Dec 76Slide7
Science at Low Frequencies III. 2016 Dec 7
7Slide8
Science at Low Frequencies III. 2016 Dec 7
8Slide9
Science at Low Frequencies III. 2016 Dec 7
9Slide10
Easy Problems vs Hard ProblemsDetect 79 known pulsars with S > 2.5 mJy at 1.4 GHz in the NVSS (Kaplan et al. 1998, ApJS, 119, 75)
easyLocate the LMXB pulsar PSR J1123+0038 because it is bistable easy Discover all pulsars or stars with S > 2.5 mJy at 1.4 GHz in the NVSS hard
Science at Low Frequencies III. 2016 Dec 710Slide11
Survey frequency: How much does it matter scientifically? Science at Low Frequencies III. 2016 Dec 711
4CSlide12
Measuring and using spectral indicesScience at Low Frequencies III. 2016 Dec 7
12GLEAM internal
VLSSr / NVSSSlide13
Finding Known and Unknown Pulsars using TGSS/NVSS spectraAn image-based approach used in the past to find pulsars (e.g. B1937+21)Method selects without regard to period, dispersion measure, orbital parameters and interstellar scattering
Measure compactness, spectrum, polarization, and positionPromising candidates searched for pulsations in gamma-rays and/or radioHope is to find exotic PSRs missed by traditional pulsation search methods
TGSS-NVSS Spectral Index Image0.3% AGNα<-1.5
62% PSRs
α<-1.5Slide14
Summary:The universe is not a vacuum. Survey parameters (resolution, sensitivity, dynamic range, position accuracy, sky coverage, …) should be matched to source properties (surface brightness, redshift range, angular size, spectral index, sky density, confusion, optical/IR IDs
,…).Discovery = detection + recognitionSurvey frequency is not a strong spectral selector.Low- and high-frequency surveys complement each other.The
faster the survey speed, the sooner the survey hits the wall of systematic errors (confusion, dynamic range, primary beam errors, clean bias, ionospheric phase errors, …). Systematic errors dominate
,
especially at low frequencies, so
quality is needed to exploit quantity (be sure to get ground truth on clean bias, ionospheric calibration source suppression, …)Survey science = survey quality X number of scientists who use it
Science at Low Frequencies III. 2016 Dec 7
14Slide15
15
Science at Low Frequencies III. 2016 Dec 7
The National Radio Astronomy Observatory is a facility of the National Science Foundation
operated under cooperative agreement by Associated Universities, Inc.
www.nrao.edu • science.nrao.eduSlide16
Science at Low Frequencies III. 2016 Dec 716
TGSS = black stars7C = blue and green dotsDeep fields = red, black, yellow, magenta, grey dots Slide17
Science at Low Frequencies III. 2016 Dec 7
17Slide18
Science at Low Frequencies III. 2016 Dec 7
18
Data points and box: 160
μ
m
Herschel counts converted to
1.4 GHz by the FIR/radio ratio
q = log(S
160
μ
m
)/log(S
1.4 GHz
) = 2.5
96% of the radio source
background is resolved by
S
1.4 GHz
~ 1.7
μJySlide19
Science at Low Frequencies III. 2016 Dec 7
19Slide20
‘‘Classical’’ confusionScience at Low Frequencies III. 2016 Dec 7
20Slide21
The Case of the Steep Spectrum Pulsars
TGSS sample is biased toward steeper spectral indices (as expected)
S
teep spectrum PSRs are gamma-ray emitting MSPs (i.e.
MSPs and normal pulsars show no such tends in larger samples
What is going on here? Frail et al (2016)
All PSRs
TGSS PSRs