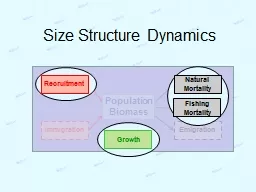
Immigration Emigration Population Biomass Growth Natural Mortality Fishing Mortality Recruitment Size Structure Methods Length frequencies Proportional Size Distribution PSD was Proportional Stock Density ID: 576034
Download Presentation The PPT/PDF document "Size Structure Dynamics" is the property of its rightful owner. Permission is granted to download and print the materials on this web site for personal, non-commercial use only, and to display it on your personal computer provided you do not modify the materials and that you retain all copyright notices contained in the materials. By downloading content from our website, you accept the terms of this agreement.
Slide1
Size Structure Dynamics
Immigration
Emigration
Population
Biomass
Growth
Natural Mortality
Fishing Mortality
RecruitmentSlide2
Size Structure Methods
Length frequenciesProportional Size Distribution (PSD)was “Proportional Stock Density”Proportional Size Distribution (PSD-X)was “Relative Stock Density”
Size Structure2Slide3
Length Frequency
Use “common” breaks depending on fish size and sample size2, 5, 10, or 25 mm0.1, 0.25,0.5,or 1 in
Size Structure3Slide4
Size Structure Concept
Size Structure4
5
10
15
20
25
Length
Frequency
Recruitment
Growth
Fishing Mortality
Natural Mortality
Recruitment
controls
…
numbers in smaller length bins
.
Growth
controls
… fish
“moving”
into
larger length bins.
Fishing mortality
controls … fish removal from
larger
length
bins
.
Natural mortality
controls …
fish
removal from
smaller
length
bins
and,
without compensatory mortality
, larger length bins.
Thus, size structure analysis provides insight on many aspects of population dynamics!
Natural MortalitySlide5
Length Frequency -- Example
Size Structure5
From Stone and Lott. 2002
. North American Journal of Fisheries Management 22:975–984Slide6
Length Frequency -- Example
Size Structure6
From
Paukert and Willis. 2001. Fisheries Management and Ecology 8:533-542Slide7
Length Frequency in R
Whittlesey Creek Case StudySize Structure
7Slide8
Why fewer 6” than 10” fish?
Size Structure8
5
10
15
20
25
Length
Frequency
Size structure summaries are heavily influenced by the relative selectivity of the gear used.Slide9
Size Structure
9Gillnet -- Selectivity
from Anderson, C.S. 1998. Partitioning total size selectivity of gill nets for walleye (Stizostedion vitreum) into encounter, contact, and retention components. Can. J. Fish. Aquat
. Sci. 55: 1854–1863.
Total selectivity is related to three parts of catch process
encounter
contactretentionSlide10
Case Study
Size Structure Gear Bias Case StudySize Structure
10Slide11
Size Structure Methods
Length frequenciesProportional Size Distribution (PSD)Proportional Size Distribution (P
SD-X)Size Structure
11Slide12
Size Structure
12Proportional Size Distribution (
PSD)
Stock
length
mature length; fully vulnerable length; or minimum size acceptable to anglers
.
Quality lengthminimum size anglers like to harvest.Slide13
PSD
Stock
(37)
Quality
(17)
Preferred
(5)
5
17
PSD-PQ =
= 0.29
37
17
PSD =
= 0.46Slide14
Size Structure
14
PSDSlide15
Size Structure
15PSD
Total Length (inches)
Number of LMB
5
10
15
20
0
20
40
60
80
100
8
773
12
253
= 0.327
Quality
StockSlide16
PSD -- Example
Size Structure16
From Stone and Lott. 2002
. North American Journal of Fisheries Management 22:975–984Slide17
PSD -- Example
Size Structure17
From
Paukert et al. 2002. North American Journal of Fisheries Management 22:86–95.Slide18
PSD -- Example
Size Structure18
From Pierce et al. 2003. North American Journal of Fisheries Management
23:331–339.Slide19
Size Structure Methods
Length frequenciesProportional Size Distribution (PSD)Proportional Size Distribution (PSD-X)
Size Structure19Slide20
Size Structure
20Size Structure – Summary Measure
Proportional Size Distribution (PSD):ExamplesPSD-P
numerator is “preferred” fish.PSD-15 numerator is >15 fish.Slide21
Size Structure
21PSD – Interpretation
Many authors suggest that values of 40-60 or 30-70 represent “balanced” populations.
May depend on management goals.Slide22
Size Structure
22To strengthen conclusions of PSD analysis:
Evaluate condition, growth, and mortality of target species and other species.Determine if PSD,
condition, growth, and mortality of all species are consistent with a single interpretation.Evaluate PSD of other prey or predator species in the fish community
.Size Structure – InterpretationSlide23
Size Structure
23Size Structure – Interpreting PSD
0
20
40
60
80
100
0
20
40
60
80
100
Predator PSD
Prey PSD
(
lmb,bg
)
(wae,yep)