/
SO254 SO254

SO254 - PowerPoint Presentation

giovanna-bartolotta
giovanna-bartolotta . @giovanna-bartolotta
Follow
393 views
Uploaded On 2017-07-12

SO254 - PPT Presentation

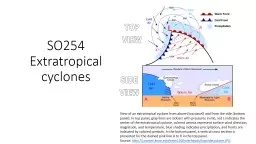
Extratropical cyclones View of an extratropical cyclone from above top panel and from the side bottom panel In top panel gray lines are isobars with pressures in mb red L indicates the center of the ID: 569274

level surface air upper surface level upper air advection vorticity step divergence stage east cold warm aloft temperature front

Share:

Link:

Embed:

Download Presentation from below link

Download Presentation The PPT/PDF document "SO254" is the property of its rightful owner. Permission is granted to download and print the materials on this web site for personal, non-commercial use only, and to display it on your personal computer provided you do not modify the materials and that you retain all copyright notices contained in the materials. By downloading content from our website, you accept the terms of this agreement.


Presentation Transcript

Slide1

SO254 Extratropical cyclones

View of an

extratropical

cyclone from above (top panel) and from the side (bottom panel). In top panel, gray lines are isobars with pressures in

mb

, red L indicates the center of the

extratropical

cyclone, colored arrows represent surface wind direction, magnitude, and temperature, blue shading indicates precipitation, and fronts are indicated by colored symbols. In the bottom panel, a vertical cross section is presented for the dashed pink line A to B in the top panel.

Source:

http://courses.knox.edu/envs150/overheads/topsidecyclone.JPG

Slide2

What is an extratropical cyclone?

An extratropical cyclone (ETC) is an area of low pressure, often migratory and with frontal boundaries, typical of the middle and high latitude regions of the world

ETCs develop as part of

cyclogenesis

:

During

cyclogenesis

, vorticity (spin) of low-level air increases, updrafts increase near the center, and surface pressure decreases

The life cycle of an

extratropical

cyclone typically lasts 4-8 days

Key processes that

favor

cyclogenesis

include: divergence aloft, surface air convergence, advection of cyclonic vorticity aloft, warm- and cold-air advection near the surface

Key processes that disrupt

cyclogenesis

include: surface friction, convergence aloft, advection of

anticyclonic

vorticity aloftSlide3

Life cycle of an ETC: Step 1

This stage is called the “spin up” stage

Surface front (stationary), clouds (gray shaded), temperatures (dashed lines) and isobars (solid black lines, in

kiloPascals

)

Upper-level jet stream (dashed arrow) and region of upper-level divergence (labeled “D”)

First step:

Region of upper-level divergence and/or upper-level vorticity advection moves overhead of a surface temperature gradient

Consequence of first step:

Air rises in the area beneath the divergence and/or the vorticity advection

Rising air

stretches

the air column, causing it to rotate

Surface convergenceSlide4

Life cycle of an ETC: Step 2

(First step still remains in place)Region of upper-level divergence and/or upper-level vorticity advection remains overhead of a surface temperature gradientSecond step:

Fronts develop. A warm front develops at the leading edge of the warm air moving north to the east of the ETC. A cold front develops at the leading edge of the cold air moving southeast to the west of the ETC.

Consequence of second step:

The wavelength of the upper-level jet trough and jet stream shortens. Divergence aloft and positive vorticity advection aloft both increase.

This stage is called the “frontal wave” stage

During “frontal wave” stage: a “wave” of low pressure develops along a stationary temperature gradient, in response to forcing from aloftSlide5

Life cycle of an ETC: Step 3

(First two steps still remain in place)Region of upper-level divergence and/or upper-level vorticity advection remains overhead of a surface temperature gradientWarm- and cold-air advection continue occurring in the lower atmosphere, acting to build a ridge ahead of the ETC and a trough behind it. Surface fronts are also becoming well defined

Third step:

Surface air pressures fall (sometimes quickly), at the core center of the ETC. Precipitation, sometimes heavy, develops along the frontal boundaries. Upper-level divergence and vorticity advection are maximized.

Consequence of third step:

Falling surface pressures promote intensification of surface temperature gradients, a process called

frontogenesis

This stage is called the “deepening” stage

During “deepening” stage: Air circulation around developing low pressure moves warm air north and cold air south, transforming stationary frontal boundary into a warm front and a cold frontSlide6

Life cycle of an ETC: Step 4

(First three steps still remain in place)Region of upper-level divergence and/or upper-level vorticity advection remains overhead of a surface temperature gradientWarm- and cold-air advection continue occurring in the lower atmosphere, acting to build a ridge ahead of the ETC and a trough behind it. Surface fronts are also becoming well defined

Surface pressures fall in the center of the low

Fourth step:

Precipitation and latent heat release promote quick deepening of surface low pressure. Cold air advances faster south and east than warm air advances north and west. Surface winds are maximized, upper-level trough is deepest, divergence aloft and vorticity advection aloft are strongest

Consequence of fourth step:

Surface pressures are lowest, precipitation rates greatest, winds strongest

This stage is called the “mature” stage

During “mature” stage: Lowest central pressure of the ETC, greatest surface wind speeds, heaviest precipitation, most intense fronts (most intense temperature gradients)Slide7

Life cycle of an ETC: Step 5

Fifth step: Cold front overtakes warm frontConsequences of fifth step:Surface temperature gradient weakens and shifts east of the ETC

Cold-air advection located east of the ETC causes upper-level trough to move east, with axis of upper-level trough now east of surface low

Upper-level convergence and

anticyclonic

vorticity advection are now present overhead of the surface low

Both promote sinking air in the column over the surface low

Cyclolysis

(weakening) occurs, until eventual dissipation of the ETC

This stage is called the “decay” stage

During “decay” stages: Cold front overtakes warm front, shifts greatest temperature gradients east of ETC center. Cold-air advection shifts east, helping upper-level trough to move east, and replacing upper-level divergence/cyclonic vorticity advection with upper-level

convergence

and anticyclonic vorticity advection over the surface low.Slide8

Evolution of frontal boundaries during ETC life cycle

Frontal wave (a)Stationary front still (little circulation around surface low)Mature cyclone (b)

Strong winds around surface low

Cold front nearly overtakes warm front

Decay (c)

Cold front overtakes warm front

Surface low pressure separated from strong temperature gradientsSlide9

Another view of ETC development

View from top: surface low located to the east of trough axis, ideally beneath area of greatest divergence aloft and area of maximum cyclonic vorticity advectionIt’s possible, in the real atmosphere, that the area of greatest divergence aloft doesn’t align with the area of maximum cyclonic vorticity advection

“Warm air conveyor belt” typically occurs between 850

mb

(at the entrance region of the gray arrow) and 200

mb

(the exit region of the gray arrow). It is responsible for providing latent energy for the developing ETCSlide10

Extratropical anticyclones

Just like surface extratropical cyclones develop as areas of low pressure to the east of an upper-level trough axis, surface extratropical

anticyclones can develop as areas of high pressure to the east of an upper-level ridge axisSlide11

Relative importance of different processes to ETC cycle

To conclude this lesson, let’s look at the approximate relative importance of each type of process to the ETC life cycle:Upper-level divergence and vorticity advection (blue curve)Latent heat release from water vapor forming liquid and ice particles (brown curve)

Friction (green curve)

Net effect of all: dashed purple curveSlide12

Where are the ETCs in this analysis of the Pacific Ocean, provided by NOAA Ocean Prediction Center?

What stages are they in? Finally, how do we read/interpret the surface station model?