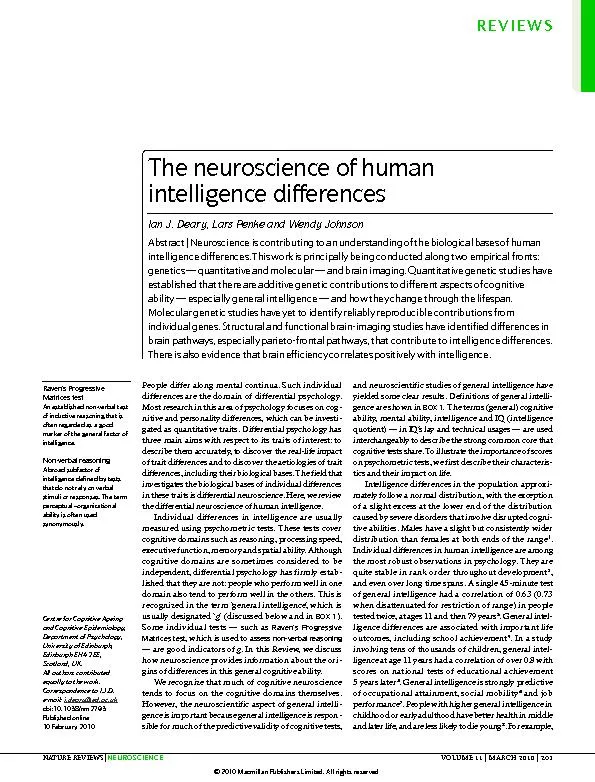
/
The neuroscience of human intelligence differences The neuroscience of human intelligence differences

The neuroscience of human intelligence differences - PDF document

giovanna-bartolotta
giovanna-bartolotta . @giovanna-bartolotta
Follow
408 views
Uploaded On 2017-04-03

The neuroscience of human intelligence differences - PPT Presentation

differences are the domain of differential psychology Most research in this area of psychology focuses on cog nitive and personality differences which can be investi gated as quantitative trait ID: 334991

differences are the domain

Share:

Link:

Embed:

Download Presentation from below link

Download Pdf The PPT/PDF document "The neuroscience of human intelligence d..." is the property of its rightful owner. Permission is granted to download and print the materials on this web site for personal, non-commercial use only, and to display it on your personal computer provided you do not modify the materials and that you retain all copyright notices contained in the materials. By downloading content from our website, you accept the terms of this agreement.


Presentation Transcript

People differ along mental continua. Such individual differences are the domain of differential psychology. Most research in this area of psychology focuses on cog - nitive and personality differences, which can be investi - gated as quantitative traits. Differential psychology has three main aims with respect to its traits of interest: to describe them accurately, to discover the real-life impact of trait differences and to discover the aetiologies of trait differences, including their biological bases. The field that investigates the biological bases of individual differences in these traits is differential neuroscience. Here, we review the differential neuroscience of human intelligence. Individual differences in intelligence are usually measured using psychometric tests. These tests cover executive function, memory and spatial ability. Although cognitive domains are sometimes considered to be independent, differential psychology has firmly estab - lished that they are not: people who perform well in one domain also tend to perform well in the others. This is recognized in the term ‘general intelligence’, which is usually designated ‘ g ’ (discussed below and in BOX 1 ). Some individual tests — such as Raven’s Progressive Matrices test , which is used to assess non-verbal reasoning — are good indicators of g . In this Review, we discuss how neuroscience provides information about the ori - gins of differences in this general cognitive ability. tends to focus on the cognitive domains themselves. However, the neuroscientific aspect of general intelli - gence is important because general intelligence is respon - sible for much of the predictive validity of cognitive tests, and neuroscientific studies of general intelligence have yielded some clear results. Definitions of general intelli - gence are shown in BOX 1. The terms (general) cognitive ability, mental ability, intelligence and IQ (intelligence quotient) — in IQ’s lay and technical usages — are used interchangeably to describe the strong common core that cognitive tests share. To illustrate the importance of scores on psychometric tests, we first describe their characteris - tics and their impact on life. - mately follow a normal distribution, with the exception of a slight excess at the lower end of the distribution caused by severe disorders that involve disrupted cogni - tive abilities. Males have a slight but consistently wider distribution than females at both ends of the range 1 . Individual differences in human intelligence are among the most robust observations in psychology. They are quite stable in rank order throughout development 2 , and even over long time spans. A single 45-minute test of general intelligence had a correlation of 0.63 (0.73 when disattenuated for restriction of range) in people tested twice, at ages 11 and then 79 years 3 . General intel - outcomes, including school achievement 4 . In a study involving tens of thousands of children, general intel - ligence at age 11 years had a correlation of over 0.8 with scores on national tests of educational achievement 5 years later 5 . General intelligence is strongly predictive of occupational attainment, social mobility 6 and job performance 7 . People with higher general intelligence in childhood or early adulthood have better health in middle and later life, and are less likely to die young 8 . For example, Centre for Cognitive Ageing and Cognitive Epidemiology, Department of Psychology, University of Edinburgh, Edinburgh EH4 2EE, All authors contributed equally to the work. Correspondence to I.J.D. e-mail: i.deary@ed.ac.u k doi:10.1038/nrn2793 Published online 10 February 2010 Raven’s Progressive Matrices test An established non-verbal test of inductive reasoning that is often regarded as a good marker of the general factor of intelligence. Non-verbal reasoning A broad subfactor of intelligence defined by tests that do not rely on verbal stimuli or responses. The term perceptual–organizational ability is often used synonymously. The neuroscience of human intelligence differences Ian J. Deary, Lars Penke and Wendy Johnson intelligence differences. This work is principally being conducted along two empirical fronts: genetics — quantitative and molecular — and brain imaging. Quantitative genetic studies have established that there are additive genetic contributions to different aspects of cognitive ability — especially general intelligence — and how they change through the lifespan. Molecular genetic studies have yet to identify reliably reproducible contributions from individual genes. Structural and functional brain-imaging studies have identified differences in brain pathways, especially parieto-frontal pathways, that contribute to intelligence differences. There is also evidence that brain efficiency correlates positively with intelligence. REVIEWS N AT U R E R EV I E WS | NEUROSCIE N CE V OLU M E 11 | MAR C H 2010 | 201 © 2 0 M a c m i l l a n P u b l i s h e r s L i m i t e d . A l l r i g h t s r e s e r v e d 10 among one million men followed for approximately 20 years after taking intelligence tests at about the age of 20, an advantage in general intelligence of one stand - ard deviation was associated with a 32% reduction in mortality 9 . Intelligence is also important in everyday decision-making 7 . The psychometric properties of intelligence Well-established results from differential psychology studies have shown that it is inappropriate to assume that performing any cognitive task involves only one relevant mental module (or faculty). C onsider the individual differences that are seen in a test of arithmetic involving fractions. Do some people perform better than others because they differ on general intelligence, which we know contributes to all cognitive tasks, irrespective of their content? O r is there some cognitive faculty that contributes to tasks involving mathematical tasks in general, but not to other activities such as verbal and spatial tasks? O r do people differ on the specific ability involved in doing fractional arithmetic in ways that have nothing to do with ability on any other cognitive task, even other mathematical tasks? O r is it simply that people differ in their exposure to and practice with fractional arithmetic tasks? E ach of these possibilities is correct to some degree, for the following reasons. First, scores on cognitive abil - ity tasks of all kinds are positively correlated. This is known as the positive manifold. In typical test batteries consisting of 10–15 different cognitive tasks involving a wide range of materials and content, a g factor almost always accounts for 40% or more of the total variance. Second, each individual cognitive test also shows a sub - stantial amount of more specific variance, generally ranging from 20 to 50% of the total variance. Some of this is attributable to error variance or variance resulting from factors such as fatigue and low mood and moti - vation. However, some represents systematic variance specific to each test, and therefore reflects the particular abilities involved in the test. Third, tests that are more similar in content are more closely correlated with each other than with tests that have different content. That is, people tend to have areas of relative strength and weak - ness in certain broad domains of cognitive ability. For example, some are very good at solving various problems involving spatial manipulation but not quite as good at verbal problems, whereas others show the opposite pat - tern. These individual differences in broad cognitive domains — though given much attention in cognitive neuroscience — contribute a small amount of variance compared with g and the specific tests. Fourth, some of the variance also reflects individual differences in expo - sure to testing in general and exposure to the specific tests involved in particular. An example of how the hierarchical structure of intelli - gence variance emerges from test scores is shown in FIG. 1 . This general, hierarchical pattern of the components of cognitive ability variance has been known for about a cen - tury 10 , and has been replicated in hundreds of datasets 11 . Spearman proposed that the general intelligence (mental ability) factor reflects a general cognitive ability that is applicable to any kind of cognitive problem 10 . He termed it g , intending to avoid value judgements and arguments by using a character that was free from prior connota - tions and misunderstandings. Despite this, g has been the subject of controversy ever since (BOX 2) . It is important to emphasise g : it accounts for a substantial large amount of variance, it is the source of most of the predictive power of cognitive tests and, as discussed below, it is the locus of most of the genetic variance. From differential psychology to neuroscience The neuroscience of intelligence is constrained by — and must explain — the following established facts about cognitive test performance: about half of the vari - ance across varied cognitive tests is contained in gen - eral cognitive ability; much less variance is contained within broad domains of capability; there is some vari - ance in specific abilities; and there are distinct ageing patterns for so-called fluid and crystallized aspects of cognitive ability. The existence of g creates a complicated situation for neuroscience. The fact that g contributes substantial variance to all specific cognitive ability tests is gener - ally thought to indicate that g contributes directly in some way to performance on those tests. That is, when Box 1 | Definitions of intelligence An early and seemingly circular definition of intelligence came from the American psychologist E. G. Boring in 1923, when he stated, “Intelligence is what the tests test” 105 . Although this definition is often criticized by detractors of IQ (intelligence quotient)-type tests, it was taken out of context. The apparently dismissive comment came after a summary of strong empirical findings — for example, that the tests showed marked individual differences, that the differences were stable over time, that children developed greater intelligence over time but tended to maintain the same rank order. The sentence immediately following the famous quote was that the famously glib definition “is only the point of departure for a rigorous discussion of the tests.” Boring was simply stating that the psychometric data had to be good and then linked to other evidence about the origins and outcomes of intelligence. A broader definition was agreed by 52 prominent researchers on intelligence: “Intelligence is a very general capability that, among other things, involves the ability to reason, plan, solve problems, think abstractly, comprehend complex ideas, learn quickly and learn from experience. It is not merely book learning, a narrow academic skill, or test - taking smarts. Rather, it reflects a broader and deeper capability for comprehending our surroundings—‘catching on’, ‘making sense’ of things, or ‘figuring out’ what to do. Intelligence, so defined, can be measured, and intelligence tests measure it well” 106 . Intelligence tests generally consist of either complex tasks that involve different aspects of reasoning, such as the Ravens Progressive Matrices, or batteries of tasks that require different kinds of cognitive performance, such as providing definitions of words or visualizing three - dimensional objects from two - dimensional diagrams. Two properties of these kinds of tests are important. First, all intelligence tests — whether of single, unitary tasks or complex, multi - faceted tasks — are correlated and tend to generate a strong general factor when applied to a large sample of people. Second, whatever our definition, intelligence should be assessed by its construct validity, meaning the accumulated evidence that the tests measure something of relevance: evidence on practical outcomes of intelligence differences, consistency of psychometric structure, and relationships with biological structures and processes. By that criterion, intelligence is a core and valid facet of individual differences among humans. As this article shows, irrespective of definition and test used, data from brain - imaging and genetic studies show strong correlates with results from intelligence tests. This provides validity for psychometric intelligence measures, contrary to criticisms that such test scores (often expressed as IQ) are meaningless numbers. REVIEWS 202 | MAR C H 2010 | V OLU M E 11 www.nature.com/reviews/neuro © 2 0 M a c m i l l a n P u b l i s h e r s L i m i t e d . A l l r i g h t s r e s e r v e d 10 Na tur e Re vie ws | Neur oscienc e g 0. 97 0.8 9 0.86 0.80 0. 91 0.66 0.60 0. 73 Reasoning Spa tial abilit y Memory Pr oc essing speed Vo ca bulary 1 2 3 4 5 6 7 8 9 10 11 12 13 14 15 16 0. 91 0.8 3 0.80 0. 75 0. 78 0. 72 0. 77 0.80 0.8 20 .78 0.8 90 .9 0 0.85 g Ag e Reasoning Spa tial abilit y Memory Pr oc essing speed Vo ca bulary a b –0. 48 –0. 15 –0.31 0.6 3 domains of thinking skill (such as executive func - tion and memory) or specific tasks (such as mental arithmetic and non-verbal reasoning on the Raven’s Progressive Matrices test) are studied, neuroscientists are observing brain activity related to g as well as the specific task activities. This undermines the ability to determine localized brain activities that are specific to the task at hand. That is, cognitive task and cogni - tive ability are not isomorphic: cognitive tasks draw on multiple abilities, some of which are unique to the specific task and others which can also be applied to other tasks. Moreover, studies that investigate biologi - cal associations with intelligence are rarely conducted using a statistically derived g factor or psychometrically validated factors representing the major cognitive domains that are more specific than g . Instead, the studies generally rely on total IQ scores from a battery of tests, or single tests thought to load highly on the general cognitive ability factor. Fortunately, this has a surprisingly small effect: results are similar whichever measure is used. This accentuates the complications of studying the neural correlates of intelligence. In differential psychology there has been a tradition of seeking fundamental parameters of cognitive process - ing or single biological variables that might account for intelligence differences. The results have been sparse 12 , but two biological findings have persisted and accumu - lated: general intelligence differences are substantially heritable 13 ; and general intelligence and brain size show modest, positive correlations 14 . O f course, finding corre - lations does not explain how one variable affects another, and explaining such correlations is considerably more difficult than identifying them. N evertheless, these two persistent findings were the basis for the two principal approaches to the present-day neuroscience of general intelligence: genetics and brain imaging. Basic genetic influences on intelligence Investigation of the presence of genetic influences on general intelligence dates back to the nineteenth century, when Francis Galton published two papers concluding that mental abilities were transmitted by heredity from one generation to another 15 . Despite an intermittently hostile political reception, many stud - ies since then — based principally on twin and adop - tion samples — have replicated this observation, and none has contradicted it 16 . E stimates of how much of the total variance in general intelligence can be attributed to genetic influences range from 30 to 80%. General intelligence factors, in the form of latent traits from which measurement error has been removed, fall at the high end of this range. Broad domains of cognitive ability — such as verbal and perceptual– organizational abilities — generally show similar amounts of genetic influence 1 7 –20 , although the genetic influence on memory tends to be somewhat smaller 1 7 –21 . However, much of the heritability of these domains is due to genetic effects on general intelligence, with which they are highly correlated. C onsistent with the presence of measurement error in variance that is unique to specific tests, genetic influences on specific abilities are generally substantially lower. The heritability of general intelligence increases with age 22–24 , from about 30% in early childhood 25 to as much as 70–80% in adulthood 1 7 ,26 , 27 . Because this is now well established, recent studies have shifted to investigating how genetic influences on various mental abilities are related and how they change with development. For example, in a Dutch twin study, the same individuals were given mental test batteries repeatedly to assess gen - eral intelligence from 5–12 years of age 28 . The heritabil - ity of general intelligence was 26% at age 5, 39% at age 7, 54% at age 10, and 64% at age 12. Rank order of general intelligence showed high stability over time, which is largely due to the genetic influences on g (BOX 3) . Figure 1 | The hierarchy of intelligence differences. a | This figure is constructed from analyses conducted by Salthouse 120 . They were based on 33 of his own studies, with almost 7,000 subjects 18–95 years of age. The small squares represent 16 different cognitive ability tests. The 16 tests coalesce into five factors representing broad domains of mental ability. Each test has a high loading on one group factor; the numbers may be thought of as the correlation between the individual test and the higher-order latent trait or ability domain. All five domains have high associations with the general intelligence factor ( g ). Correlations among the broad domains are high (not shown), refuting the idea that there might be independent ‘primary mental abilities’ at this broad domain level. Given that the factors representing broad domains are strongly associated with g , it follows that much of the variance apparently arriving at the 16 individual tests from the broad domains actually comes from g . Take the example of test number 1. Its correlation with the ‘Reasoning’ domain is 0.89. But this domain has a loading of 0.97 on g , which is shared with all four other cognitive domains. By simply squaring the correlations (or loadings), which is not always appropriate, one finds that about 74% of the variance in Test Number 1 is due to g and only about 5% is due to the domain of ‘Reasoning’. b | The main effect of age is on g , with additional, cognitive domain-specific influences on memory and processing speed 120 . Age effects below 0.1 are not shown, nor are effects of gender, education and health. There is a direct positive effect of age on vocabulary. This is tempered by the negative effect of age on g , with which vocabulary is highly associated, and results in an overall modest positive effect of age on vocabulary. Such a hierarchy of intelligence differences is found in almost all of the hundreds of large datasets that have applied multiple cognitive tests to large samples 11 . The hierarchy is important in genetic studies, because the major additive genetic influence is on g , and the major source of genetic variance on the individual tests is typically through g 20 . This finding holds into old age: even at age 80, the additive genetic contribution to g is still high, and broad cognitive domains still have high correlations with g 121 . The domain with the strongest non - g genetic influence is memory, although even here the largest source of genetic variance comes from the genetic influence on g . Figures are based on data from REF. 120 . REVIEWS N AT U R E R EV I E WS | NEUROSCIE N CE V OLU M E 11 | MAR C H 2010 | 203 © 2 0 M a c m i l l a n P u b l i s h e r s L i m i t e d . A l l r i g h t s r e s e r v e d 10 Endophenotype A quantifiable phenotype with an assumed intermediate role in the pathway from genes to complex phenotypes. It is thought that the action of the endophenotype is easier to understand biologically and genetically than the action of the complex phenotype of primary interest. Shared genetic influences between brain structure– function and intelligence? In adults, there are strong genetic influences on many brain structures and regions — including on the density and the volume of grey and white matter in corpus callosum, superior frontal and temporal cortex, medial frontal cortex, amygdala, hippocampus, Broca’s area, anterior cingulate cortex, Heschl’s gyrus and postcentral gyrus — and on overall brain volume; this explains 70–90% of the vari - ance in these measures 29–33 . This is also true of aspects of brain functioning, such as the dynamic complexity of brain oscillations thought to be involved in executive function 34 , and information processing capacity and efficiency as measured in tests of executive function 35 and inspection time 26 . V ariations in these structures and functions may be endophenotypes for intelligence — that is, they might be intermediate physiological markers that contribute directly to intelligence. Therefore, genes involved in intelligence might be more closely linked to these variations in brain structure and function than to intelligence itself. In fact, in all studies to date, the genetic influences on these structures and functions were highly correlated with those on general intelli - gence 29,31 , 32,36 . This important result — that at least some Box 2 | Controversies in intelligence and criticisms of g C ontroversies involving intelligence Two types of controversy surround the measurement of intelligence: in some cases, empirical intelligence - related data exist but have been missed, unappreciated, ignored or even rejected; in other cases, no definitive intelligence - related data are yet available. Examples of the first type include arguments about whether there are ‘multiple intelligences’; whether genetic factors contribute to intelligence differences; and whether brain size is related to intelligence. The data on these issues are substantial and there are few to no contradictory data. Examples of the second type of controversy include debates about whether and to what extent intelligence tests may be biased for or against specific groups; the existence and causes of sex and ethnic differences in intelligence; the causes of the well - known correlations among intelligence, education and social class; and the cause of the population - level increases in IQ (intelligence quotient) test scores throughout the twentieth century in Western societies (known as the Flynn effect). The tools that are currently available to address these issues, such as tests of measurement invariance, are inadequate to resolve them. This is because, at present, we can only measure intelligent performance, which develops over time. Its development in an individual is therefore embedded in the individual’s environment of origin. C riticisms of g g has been criticized on two major grounds. First, several theorists have proposed that domains of cognitive ability might be independent of one another. The best known of these are Thurstone’s ‘Primary Mental Abilities’ (PMA) and Gardner’s ‘Multiple Intelligences’ (MI). However, these theories have not held up well. Even Thurstone’s own PMA data contained a strong g factor 107 . Gardner has intentionally avoided empirical tests of his theory, but those that have been made show most of his MI to be correlated with one another 108 ; and some of the MI, such as kinaesthetic ability, are not what psychologists would think of as ‘cognitive’ abilities at all. Second, Cattell and Horn suggested that, however robust it may be statistically, g might have no real importance in the brain because different batteries of ability test could give different values of g , resulting in different rank orders among individuals 109 . This is incorrect. As long as test batteries are reasonably diverse, g factors from different test batteries are almost perfectly correlated 110 . That is, as long as one administers enough tests, the general intelligence factor from one group of tests will agree closely in ranking with the general intelligence factor from any other group of tests. For more than a century, many people have dismissed the concept of g , but the near - universal positive covariation among cognitive tests is a fact. The theories that do not accommodate this finding — such as those of Thurstone, Guilford, Sternberg and Gardner — fail the most basic empirical tests. Prominent accounts arguing that g is a necessary artefact of the statistical analyses — such as principal components analysis — are incorrect 111 . But there are more subtle and effective ways in which g has been questioned than the mere denial of the positive manifold, two of which deserve attention. First is the continuous and often heated debate between Spearman and Godfrey Thomson. Thomson suggested that the positive associations among cognitive tests might be explained not by individual differences in a single property — whatever g represented, such as the ‘mental energy’ proposed by Spearman himself — but by individual differences in the number or efficiency of ‘bonds’ in people’s brains. Thomson’s idea, borrowed from his friend R. L. Thorndike, was that brains were composed of a very large number of biological units (bonds) and that, when a person attempted to solve mental test items, each item sampled a number of these bonds. The degree to which tests overlapped in the bonds they sampled accounted for their correlation. Thomson could not specify what the brain’s units were — although guesses such as “neural arcs” suggest effective connections — but the theory implied that intelligence differences could lie in the number and/or efficiency of the bonds. Recent re - evaluation of Thomson’s ideas has found that his and Spearman’s models of intelligence can both account for the psychometric patterning of tests’ intercorrelations, and that current neuroimaging, genetic and psychophysiological evidence cannot distinguish between them 112 . A computationally and conceptually modern version of this argument based on the supposition of mutual interactions between cognitive processes has also been proposed recently 113 . Second, one must recognize the success of at least one aspect of the Cattell–Horn theory of fluid and crystallized intelligence 109 . Fluid intelligence ( g f ) is intelligence - as - process, and is typically assessed using tests that require on - the - spot processing. Crystallized intelligence ( g c ) is intelligence - as - product, and is typically measured using tests that assess stored knowledge, such as vocabulary and general facts. Although the two are highly correlated, there is a marked difference in the extent to which they change with age: fluid intelligence changes like other physical abilities, whereas crystallized ability shows little age - related decline. A neuroscientific account of intelligence differences must explain these differential trajectories. REVIEWS 204 | MAR C H 2010 | V OLU M E 11 www.nature.com/reviews/neuro © 2 0 M a c m i l l a n P u b l i s h e r s L i m i t e d . A l l r i g h t s r e s e r v e d 10 neural correlates of intelligence owe their associations to shared genetic influences — is drawn from multivari - ate genetic studies (BOX 4) . Brain development in childhood clearly involves morphological change, which is under some form of genetic control 3 7 ,38 . A longitudinal brain imaging study of children and adolescents examined twins and sin - gletons ranging from 5 to 18 years of age 39 . They were recruited in 2001, and have been assessed at approxi - mately 2 - year intervals. In this sample, developmen - tal trajectories of cortical thickness more accurately predicted IQ at age 20 than did differences in cortical thickness at age 20 ( REF . 39) . There were strong genetic influences (77–88% of the variance) on the thickness of the mid-sagittal area of the corpus callosum, the volume of the caudate nucleus, and grey and white matter vol - umes of the total cerebrum, parietal lobes and temporal lobes. Genetic influences on the volumes of the cere - bellum and lateral ventricles were smaller (both 49%). Again, these data point to a distributed pattern of brain correlates of general intelligence, which is addressed below. C omplicating the situation for brain-imaging studies, genetic influences on general intelligence that were shared across brain regions were stronger than those specific to any one region 39 . Genetic influences on brain regions tended to be strongest when brain regions were under greatest development: for example, the pri - mary sensory motor cortex, which develops early in childhood, showed stronger genetic influences during early childhood, and the dorsal prefrontal cortex and temporal lobes, which develop rapidly in adolescence, showed stronger genetic influences during adolescence 40 . Total variance in overall brain morphology generally increased with age; however, for white matter, genetic variance increased over time, whereas environmental variance increased for grey matter. Molecular genetic studies. Despite the high heritability of intelligence, it is difficult to name even one genetic locus that is reliably associated with normal-range intelligence in young, healthy adults, although some 300 genes are known to be associated with mental retardation 41 . After a thorough survey of more than 200 published studies on the 50 or so genes that have been implicated in dif - ferences in cognitive abilities, the author concluded that, after 14 years of cognitive genetic research, there are no genes that we can conclusively say are responsible for the variation in cognition or its decline with age in healthy, normal individuals 42 . Most of the genes that have been investigated in studies to date are associated with neurotransmitters (two-thirds of the studies), disease, development or metabolism. Many studies have reported associations between particular polymorphisms and cognitive per - formance, but the associations were often small and most could not be replicated in other samples 13,42 . There are, however, reliable associations, largely limited to older people, between apolipoprotein E ( APO E ) polymorph - isms and general cognitive ability, episodic memory, processing speed and executive function, with the first two of these showing an increasing effect with age 43 . The increased effect with age is possibly due to the fact that AP OE has a role in neuronal repair 44 . There may be faint signals in the noise among molecu - lar genetic studies of intelligence that have been conducted so far. For example, a meta-analysis of 16 studies (total n �9,000) found that a common polymorphism in the gene that codes for catechol - O -methyltransferase ( COM T ) was significantly and robustly associated with IQ scores (taken to represent general intelligence) 45 . However, the polymorphism accounted for only 0.1% of variance. Further evidence for a contribution of the COMT poly - morphism to intelligence has been provided by brain- imaging studies in humans, pharmacological studies in animals, and transgenic and gene-knockout studies in animals 46 . The valine-to-methionine amino-acid substitution involved in this polymorphism reduces the activity of this dopamine-degrading enzyme, and the polymorphism is thought to affect dopamine function in the prefrontal cortex. The V al66Met polymorphism in the gene encoding brain-derived neurotrophic factor ( BDN F ) is another genetic variant commonly studied in association with cognitive abilities. Most studies report significant effects of this polymorphism on intelligence 42,47 ; however, the studies differ with respect to which allele is associated with better cognitive performance. O verall, candidate- gene studies of intelligence and specific cognitive abilities have been criticized on a number of grounds: “Inadequate sample size, population stratification, environmental exposure, publication bias, variation in Box 3 | Measuring genetic influences on intelligence Many studies investigating genetic and environmental contributions to intelligence have been performed using monozygotic and dizygotic twins, but studies have also made use of samples of adoptive and biological siblings, as well as parents and their adoptive or biological offspring, with consistent results across different types of relationship groups 114 . There have also been systematic reviews of the genetic contribution to general intelligence 115 . The basic logic of such studies is straightforward: genetic influences can be inferred when closer biological relatives (identical twins, for example) are more similar for the trait of interest than less closely related pairs (ordinary siblings, for example). Shared environmental influences, by contrast, are indicated by greater similarity between pairs of family members than would be predicted on the basis of their biological relationship. Kinship studies to determine the proportion of variance that can be attributed to genetic compared with environmental influences rely on the validity of some crucial assumptions. From a quantitative genetic perspective, arguably the most fundamental of these is the assumption that genetic and environmental influences are independent, but this assumption is often false. An example that is relevant to the development of intelligence is the association of socioeconomic status (SES) with intelligence. There is some evidence that, in childhood, genetic influences on IQ (intelligence quotient) but not on SES are stronger in higher SES environments 116 (but see also REF. 117 ) , possibly indicating that some genes involved in IQ tend to be expressed only in higher SES environments (gene–environment interaction). But IQ and SES are generally correlated 118 , suggesting that one’s intelligence can influence one’s SES or vice versa. Moreover, parents pass both their genes for intelligence and the associated SES environment on to their offspring (gene–environment correlation). Understanding how genes are involved in this correlation would help in interpreting the biological meaning of intelligence’s high heritability. Of note, the issue of gene–environment correlation has not been addressed in the interaction studies conducted to date. Statistical designs exist to capture gene–environment interactions and correlations simultaneously in behaviour–genetic analyses 119 , but the techniques currently available are not applicable to situations such as childhood SES, which is identical for twin offspring. REVIEWS N AT U R E R EV I E WS | NEUROSCIE N CE V OLU M E 11 | MAR C H 2010 | 205 © 2 0 M a c m i l l a n P u b l i s h e r s L i m i t e d . A l l r i g h t s r e s e r v e d 10 Mutation–selection balance An evolutionary genetic explanation for the maintenance of genetic variance in a trait, based on an equilibrium between novel detrimental mutations and purifying selection. classification and measurements are all examples that may make one group’s findings different from those of another” 42 . At this point, it seems unlikely that single genetic loci have major effects on normal-range intelligence. For example, a modestly sized genome-wide study of the general intelligence factor derived from ten separate test scores in the C A N TAB cognitive test battery did not find any important genome-wide single nucleotide polymorphisms or copy number variants, and did not replicate genetic variants that had previously been asso - ciated with cognitive ability 48 . It is possible that genetic variance in intelligence results from a mutation–selection balance , which is the cross-generational accumulation of many mildly harmful mutations that natural selection has not yet removed from the population 49,50 . Because such variants would be rare, and our primary methods of identifying genetic association require that variants be common, this possibility would be consistent with the fact that we can isolate genetic variants involved in mental retardation but not variants involved in normal- range intelligence. It would be easy to fill this Review with data from studies that apparently show gene–intelligence asso - ciations 13,42 , 48 . However, most of these studies’ findings have not been replicable. E ven the associations between genetic variations such as those in COMT and BDNF and intelligence in the normal range — for which the studies are quite numerous — are still equivocal. The emerging view of genetic influences on intel - ligence (and many other complex phenotypes that have been studied so far, particularly quantitative traits such as height 51 ) is that a large number of genetic vari - ants have small effects. There might also be roles for copy number variations and for rare variants in indi - vidual differences in intelligence. C onsortia formed to produce genome-wide scans will, in the near future , report genetic associations with cognitive functions based on subject samples of 10,000 and more. The reliability of the results from these studies remains to be seen. Brain imaging and intelligence differences Bigger is better. Historically, the central working hypoth - esis in the neuroscience of human intelligence differ - ences has been that size matters 52,53 . E mpirical research in this tradition began in the nineteenth century, when scholars such as Paul Broca and Francis Galton studied intellectual ability and achievement in relation to brain size. Brain size was mostly approximated by measures of head size, sometimes validated by post-mortem infor - mation. C urrent data indicate that intelligence is corre - lated with head size (r ~0.20) 54 and intracranial volume (r ~0.40) 55 . The clearest single body of evidence is that, in healthy people, total brain volume (measured using structural MRI) is moderately correlated with intelli - gence (r ~0.30–0.40) 14,54 . However, this does not mean that the basis of this correlation is understood. With the advent of MRI technology, it became pos - sible to extend the study of intelligence–size relations to individual brain regions in vivo . These studies found associations between intelligence and volumes of fron - tal, parietal and temporal cortices as well as the hippo - campus, all seldom larger than r = 0.25 ( REF S 14,55 – 58) . U sing MRI, it is also possible to separate volumes of Box 4 | Multivariate genetic studies The methods used to estimate the proportions of variance that are attributable to genetic and environmental influences on one trait can be extended to estimate the genetic and environmental influences on the co - variances among multiple traits. For example, is the correlation between intelligence and brain size due to genes that influence both traits, or is it due to environmental conditions that affect both? To what degree do the genetic and/or environmental influences on brain size also contribute to intelligence? Developing answers to these questions relies on comparing the cross - relative co - variance between the two traits. That is, we might measure the degree to which intelligence in one member of each twin pair in a sample co - varies with the brain size in the other member of each twin pair, and compare the results in mono - and dizygotic twins. Genetic influences that are common to intelligence and brain size would be indicated when there is greater cross - pair similarity in more closely biologically related pairs, and shared environmental influences would be indicated when there is greater similarity between pairs of family members than would be indicated by their biological relationship. Such comparisons result in two kinds of statistics. First, genetic and environmental correlations, like ordinary correlations, range from –1 to +1 and document the extent to which genetic and/or environmental influences on one trait, such as brain size, also influence the other trait, such as intelligence. Second, we can also estimate the extent to which the observed correlation between, for example, brain size and intelligence can be attributed to genetic and/or environmental influences. Results from one study indicated that various measures of brain size were correlated 0.24–0.29 with various measures of intelligence, and genetic influences on the measures of brain size were correlated 0.24–0.38 with genetic influences on intelligence. All of the observed correlations, however, could be attributed to genetic influences 32 . This emphasizes that genetic and environmental correlations are independent of the extent of genetic and/or environmental influences on the traits. One trait can be under strong genetic influence, but those genetic influences may not be related to those on another trait, even if that trait is also under strong genetic influence, and vice versa. Genetic and environmental correlations, like estimates of genetic and environmental influences, are statistical measures that quantify co - variance and variance. They cannot, therefore, identify the specific genes involved, and provide little information about whether we should expect to be able to find any specific genes of measurable effect. Moreover, genetic and environmental correlations do not specify causes. It is certainly possible that a common set of genes may contribute directly to both traits, but genetic correlations may arise for other reasons as well. In particular, when one genetically influenced trait affects the development of another trait by influencing the (gene’s, brain’s or individual’s) environment, those genetic influences will also contribute to the genetic influences on the second trait. And specific genes that are of major importance to one trait may be of only minor importance to the other. REVIEWS 206 | MAR C H 2010 | V OLU M E 11 www.nature.com/reviews/neuro © 2 0 M a c m i l l a n P u b l i s h e r s L i m i t e d . A l l r i g h t s r e s e r v e d 10 Small-world network A network characterized by high levels of local clustering among nodes and short paths that globally link all nodes, resulting in all nodes being linked through few intermediate steps despite few connections per node. grey matter (that is, mostly nerve cell bodies, but also dendrites and supportive glia cells) from those of white matter (that is, nerve cell axons). This approach usually yields slightly higher correlations between intelligence and overall grey matter (r ~0.31) than between intelli - gence and overall white matter (r ~0.27), although dif - ferences are usually small 59 . Several studies have used voxel-based morphometry on MRI scans to measure the volume of grey matter (and less frequently white matter) in specific brain regions, and to relate this to measures of intelligence. Most of this work has been summarized by Jung and Haier 60 , who assigned the existing results to Brodmann areas (BAs) and concluded that a network of brain regions — includ - ing areas in the dorsolateral prefrontal cortex, parietal lobe, anterior cingulate cortex and specific regions in the temporal and occipital lobe — relate to individual differ - ences in intelligence (FIG. 2) . According to this parieto-frontal integration theory of intelligence (P-FIT), the extrastriate cortex (BAs 18–19) and fusiform gyrus (BA 37) are involved in intel - ligence test performance because they contribute to the recognition, imagery and elaboration of visual input, just as Wernicke’s area (BA 22) does for syntactic auditory input. Information captured through these pathways is then processed in the supramarginal (BA 40), superior parietal (BA 7), and angular (BA 39) gyri of the pari - etal lobe, in which structural symbolism, abstraction and elaboration are thought to emerge. These parietal regions may then interact with parts of the frontal lobe (especially BAs 6, 9, 10, 45, 46 and 47) to form a working memory network that compares different possible task responses. O nce a task response is selected, the anterior cingulate cortex (BA 32) supports response engagement and inhibition of alternative responses. These interac - tions among brain regions are dependent on the white matter fibres that connect them, such as the arcuate fas - ciculus. For most of these brain regions, the left hemi - sphere seems to be more important to cognitive task performance than the right hemisphere. As subsequent studies 61,62 , and also studies using different methodolo - gies (see below), have generally confirmed this theory (but see also REF. 63 ) , P - FIT can be considered the best available answer to the question of where in the brain intelligence resides. C ortical thickness, which more accurately reflects the cytoarchitectural characteristics of the neuropil than measures of grey matter volume 59 , has been related to intelligence in four studies so far 29,59 , 64,65 . They all found generally (though not exclusively 29,59 ) positive correlations between intelligence and cortical thickness, especially in the prefrontal cortex 29,59 , 64 and temporal lobes 29,59 , 65 , as well as clustered around areas of multimodal association 64 . All of these studies on (sometimes extremely fine- grained) measures of brain size and intelligence are correlational; the exact relation between the quantity of brain tissue and the quality of cognitive functions is largely unknown 66,67 . Although larger brains, greater grey matter volumes and thicker cortices usually are associ - ated with more neurons, it is unclear how and why this should lead to better intellectual performance, especially as brain development — and presumably intelligence development — involves substantial neuronal pruning 68 . This issue is also relevant in macroencephaly, in which pathologically enlarged brains are associated with decreased rather than increased cognitive function. Related questions were raised in a longitudinal study by Shaw and colleagues 37 . They showed that the trajec - tories of development of cortical thickness in children differed for groups of different intelligence. C hildren with the highest intelligence scores had comparatively thin cortices in early childhood, but showed more rapid increases in thickness in the prefrontal and temporal lobes until puberty, when all cortices slowly thinned. Thus, it is possible that differences in brain development have an underappreciated role in intelligence differences. A different, more direct way to test whether a brain area is crucially involved in intelligence differences is provided by studies of people with brain lesions. L esion studies have a long history in the neuroscience of intel - ligence. However, it was only recently that the limited applicability and specificity of case or small-sample stud - ies of focal brain damage were overcome by Gläscher and colleagues, who collected cognitive data from a large sample of 241 patients with brain lesions 69 . U sing voxel-based lesion mapping, they found highly specific lesion–deficit relations in left frontal and parietal cortex for working memory efficiency, in the left inferior fron - tal cortex for verbal comprehension and in right parietal cortex for perceptual organization — all subfactors of general intelligence. The (dis)connected mind. There is an emerging con - sensus that intelligence does not reside in a single, nar - rowly circumscribed brain region such as the frontal lobe. Rather, intelligence seems to be best described as a small-world network 70–73 . This model implies that high intelligence probably requires undisrupted information transfer among the involved brain regions along white matter fibres. O ne way to study white matter in relation to intel - ligence is to quantify white matter lesions on MRI or computed tomography scans. Because white matter is especially prone to age-related decline, these lesions have been studied mainly in elderly subjects. These studies found weak but consistent relationships indicating that people with more white matter lesions have lower cog - nitive ability 74,75 . The small effect sizes reported in this literature are probably partly due to the fact that most studies rely on lesion rating scales that allow for a con - siderable degree of subjectivity. Improving these by using multiple raters increased the association 76 . So far, 11 studies across a range of age groups have applied 1 H-magnetic resonance spectroscopy to exam - ine white matter integrity in relation to intelligence 77 . Although methods and results were heterogeneous, the studies generally found positive correlations between intelligence and concentrations of N - acetyl aspartate, a metabolite of the oligodendrocytes that form the myelin sheath around nerve fibres, and various white and grey matter areas in the brain, supporting the proposed role of white matter in intelligence. REVIEWS N AT U R E R EV I E WS | NEUROSCIE N CE V OLU M E 11 | MAR C H 2010 | 207 © 2 0 M a c m i l l a n P u b l i s h e r s L i m i t e d . A l l r i g h t s r e s e r v e d 10 Na tur e Re vie ws | Neur oscienc e 6, 9 32 10 45, 46, 47 39 , 40 7 18, 19 37 21 Long association fibre A member of a set of axonal tracks connecting distant brain areas in the same hemisphere. Network efficiency Describes short mean path lengths for parallel information transfer — as provided by a small-world network structure, for example. Functional connectivity Correlations between the activation patterns of different brain areas. Studies using diffusion tensor (DT)-MRI showed significant correlations between water diffusion para - meters that quantify white matter integrity and intel - ligence in children 78,79 , young adults 80 and old adults 78,81 , especially in the centrum semiovale. C onsistent with these findings, two studies that applied tractography on DT - MRI data to calculate integrity indices for specific white matter tracts found positive correlations between cognitive ability and white matter integrity, especially for long association fibres , such as the arcuate and unci - nate fasciculi 75,82 . O ne study using cognitive data span - ning several decades found a significant association between childhood IQ and white matter integrity in old age 78 . This suggests that, in addition to the probably direct contribution of white matter integrity to intel - ligence, higher intelligence might result in behaviours across the life-course that promote white matter integ - rity. Alternatively, it is possible that intelligence and white matter integrity have, from an early age, overlap - ping sets of genetic and/or environmental inputs. In a resourceful use of the 79 healthy adults from REF. 82 , L i and colleagues combined DT - MRI tracto - graphy and MRI with graph analysis to construct a glo - bal brain network 71 . They found significant correlations between intelligence and parameters that reflect white matter network efficiency , indicating that not only the integrity, but also the organizational efficiency, of white matter is important for higher intelligence. Efficient processing. E arly functional studies of intelli - gence used behavioural measures of reaction and inspec - tion time 12 and correlated them with various measures of cognitive ability. The well-established finding is that more intelligent people react to and inspect visual and auditory stimuli more rapidly than less intelligent people. However, although such chronometric tasks are gener - ally thought to be endophenotypes of intelligence, it has yet to be established whether they are more biologically tractable than is intelligence itself. More recently, electroencephalography ( EE G), posi - tron emission tomography (P E T), regional cerebral blood flow (r C BF) analysis and functional MRI (fMRI) have been used extensively on individuals performing intelligence-related tasks such as matrix reasoning, men - tal rotation or playing the video game Tetris. The indices of brain functional activity provided by these methods were interpreted as measures of neuronal efficiency and related to performance on the current task and/or on intelligence tests taken before or afterwards. This lit - erature has recently been reviewed in detail 60,83 , and two basic conclusions were drawn: first, similar to structural studies, functional studies support a distributed network perspective on intelligence, largely overlapping with the one shown in FIG. 2 and discussed above 60 . Second, functional neuroimaging findings are generally consist - ent with the hypothesis that intelligent brains process information more efficiently (that is, use fewer brain resources when performing cognitive tasks) than less intelligent brains 84 , provided that the cognitive task is difficult enough to discriminate between intelligent and less intelligent individuals, but not so difficult that even the most intelligent individuals have to recruit all their brain resources to solve it. In the case of these more dif - ficult tests, less intelligent individuals usually give up, resulting in a positive correlation between brain resource usage and intelligence 83 . The notion that brain efficiency has a role in intelli - gence is also supported by a study by van den Heuvel and colleagues 85 . Similar to the approach of L i et al. for white matter networks 71 , they used graph analysis to assess the efficiency of a global brain network constructed using a voxel-wise approach based on fMRI data obtained at rest. They found significant links between functional efficiency and IQ, especially in frontal and parietal regions. This is consistent with another fMRI study which reported significant correlations between IQ and the resting-state functional connectivity of an ‘exploratory’ network involving the frontal and the parietal, occipital and limbic lobes 86 . The brain areas that were activated as an efficient network during resting periods (with less activity in more intelligent individuals) in these two stud - ies matched the frontal and parietal regions that were found to be activated in intelligent subjects under high cognitive demand 60,83 . This indicates that brain activ - ity can be used to distinguish more and less intelligent people even when they are not cognitively challenged. Many neuronal roads to intelligence. Many studies on the neuroscience of intelligence have shown sex differences, sometimes to a striking degree, Figure 2 | The loci of intelligence differences. Based on a review of all the structural and functional neuroimaging literature that was available, Jung and Haier proposed the parieto-frontal integration theory of intelligence (P-FIT), which is arguably the best available description of how intelligence is distributed in the brain. The figure shows Brodmann Areas (BAs) involved in intelligence, as well as the arcuate fasciculus (shown in yellow) as a promising candidate for a white matter tract that connects the involved brain regions. BAs shown in green indicate predominantly left-hemispheric correlations and BAs shown in pink indicate predominantly right-hemispheric correlations with intelligence. Figure is modified, with permission, from REF. 60 �¡ (2007) Cambridge University Press. REVIEWS 208 | MAR C H 2010 | V OLU M E 11 www.nature.com/reviews/neuro © 2 0 M a c m i l l a n P u b l i s h e r s L i m i t e d . A l l r i g h t s r e s e r v e d 10 with respect to which brain features correlate with intelligence. For example, in males, intelligence is more strongly correlated with fronto-parietal grey matter volume whereas, in females, intelligence shows stronger correlations with white matter volume and grey matter volume in Broca’s area 87 . C ortical thick - ness in frontal regions correlates more strongly with intelligence in females, whereas temporal-occipital cortical thickness shows a stronger correlation with intelligence in males 59 . White matter integrity seems to be more important for intelligence in females than in males: males sometimes even show negative rela - tions between intelligence and DT - MRI integrity measures of fronto-parietal fibres after puberty. This suggests that, in males, cognitive functions are based on fewer, but thicker and more tightly packed fibres than in females 88 . Males also seem to be more neuron - ally efficient (that is, they show less brain activation) than females during spatial cognitive tasks with intermediate difficulty levels, whereas females seem to be more neuronally efficient than males during verbal tasks of medium difficulty 89 . This is consist - ent with established sex differences showing better spatial abilities in males and better verbal abilities in females 83,90 . These patterns are interesting because males and females show marked differences in brain size 54 and structure 91–93 , but negligible differences in general intelligence 94 . Apparently, males and females can achieve similar levels of overall intellectual performance by using differently structured brains in different ways 84 . Sex differences are a peculiar form of individual dif - ferences, because the two sexes are the only qualitatively different ‘morphs’ of the human species 95 . This makes it easy to group subjects by this variable. However, it is likely that there is within-sex variation in how indi - viduals use their brain. Two individuals might achieve identical intelligence test scores through different neu - ronal routes because they have different brain structures or different expertise and training, or they might have used different cognitive strategies 63,83 , 96,97 . Similarly, people seem to be able to compensate for cognitive deficits (or respond to cognitive challenges) by recruiting brain areas with hitherto only indirect rela - tions to intelligence, especially frontal and correspond - ing contralateral areas 98 . Such compensation results in a more distributed processing of information in the brain and therefore more widespread activation patterns. This is of particular interest in (but probably not exclusive to) cognitive ageing 98,99 . Although certain brain struc - tures and functional pathways seem more likely to be involved in intelligence than others, there is also con - siderable heterogeneity 63,65 , 9 7 , which might be related to individual differences in strategies when solving cogni - tive tasks 100 . Individual differences in strategy are also indicated by studies in which part of the variance in the fMRI activation patterns 101,102 was linked to genetic vari - ation 103 . There therefore seems to be substantial room for differences in how individuals use their brains for intelligent performance. This should be explored in future studies. Conclusions Results from genetic and brain-imaging studies performed to date can inform the design of the next phase of neuro - science-based studies of intelligence. Such studies should have large samples and a developmental perspective, include brain imaging and genetic testing, and be driven by theories about the brain underpinnings of intelligence differences. They should be psychometrically minded, which means that they should have subjects who are tested on adequate batteries of psychometric tests, and that the brain measurements should have due regard to the reliability and validity of their measures. The first adequately powered genome-wide studies of intelligence are in progress. We anticipate that, like some other highly polygenic phenotypes such as height, there will be much missing heritability 104 . That is, we expect some small effects from a large number of com - mon genetic variants, but they will account for little of intelligence’s high heritability. This means that other sources of genetic variation will need to be examined. Studies using genetic sequencing — which will detect rare genetic variants — and the study of copy-number variations will be important. Results from these are predicted by the ‘rare variant–common disease’ and mutation load hypotheses. Rare genetic variants might be population specific and therefore might not always be represented across samples. Studies that combine genetic analysis with brain imaging will be increasingly useful. There is a welcome trend towards larger samples in neu - roimaging and genetics, allowing for much more defi - nite results than those comprising most of the literature so far. However, it is still important to avoid statistical pitfalls — both genetic and imaging studies have been prone to type I and type II statistical errors. In addition to studies of the association between intelligence and genetic structure differences, there will also be a need to examine individual differences in epi - genetic changes (for example, D N A methylation), gene expression, proteomics, metabolomics, and gene–gene and gene–environment interactions that might account for individual differences in intelligence. Studies of the biological functioning of intelligence must recognize that people do not differ only in their general cognitive ability, but probably also in how they use their brain to reach particular levels of perform - ance. To understand the neuroscience of intelligence, we need to learn more about how brains can be used differently for the same tasks, both within and across age and sex groups. We have little understanding of how intelligence, as we recognize it, develops. Intelligence is clearly a combination of the ability to ‘figure things out on the spot’ and the abil - ity to retain and repeat things that have been figured out in the past. N euroimaging could help by comparing brain structure and activity in people with and without experi - ence in solving cognitive test problems such as Raven’s non-verbal reasoning test. Studies of the biology of intel - ligence will be most useful if they have a developmental perspective, running from infancy to old age — not least because there is both continuity and change in the indi - vidual differences across most of the course of a lifetime. REVIEWS N AT U R E R EV I E WS | NEUROSCIE N CE V OLU M E 11 | MAR C H 2010 | 209 © 2 0 M a c m i l l a n P u b l i s h e r s L i m i t e d . A l l r i g h t s r e s e r v e d 10 Performance on all of the cognitive tasks and abilities studied in neuroscience and genetics are confounded by general intelligence. Therefore, if researchers are prima - rily interested in the brain areas or genes for a specific cognitive ability, it might be helpful to statistically con - trol for g , which should isolate as well as possible what is unique to a single task (see REF. 97 ). The brains of some people are more efficient than those of others. The biological foundations of these differences are of great interest to basic and applied neuroscience. There are already some well-replicated general findings. The differential neuroscience of human intelligence therefore has a strong mandate and a firm foundation from which to proceed. 1. Johnson, W., Carothers, A. & Deary, I. J. Sex differences in variability in general intelligence: a new look at the old question. Perspect. Psychol. Sci. 3 , 518–531 (2008). 2. Moffitt, T. E., Caspi, A., Harkness, A. R. & Silva, P. A. The natural history of change in intellectual performance: Who changes? How much? Is it meaningful? J. Child Psychol. Psychiatry 3 , 455–506 (1993). 3. Deary, I. J., Whalley, L. J., Lemmon, H., Crawford, J. R. & Starr, J. M. The stability of individual differences in mental ability from childhood to old age: follow-up of the 1932 Scottish Mental Survey. Intelligence 28 , 49–55 (2000). 4. Johnson, W., McGue, M. & Iacono, W. G. Genetic and environmental influences on academic achievement trajectories during adolescence. Dev. Psychol. 42 , 513–542 (2006). 5. Deary, I. J., Strand, S., Smith, P. & Fernandes, C. Intelligence and educational achievement. Intelligence 35 , 13–21 (2007). 6. Strenze, T. Intelligence and socioeconomic success: a meta-analytic review of longitudinal research. Intelligence 35 , 401–426 (2007). 7. Gottfredson, L. Why g matters: the complexity of everyday life. Intelligence 24 , 79–132 (1997). A thorough documentation of the findings relating general intelligence to life outcomes, including a theoretical exposition of the reasons for the associations. 8. Batty, G. D., Deary, I. J. & Gottfredson, L. S. Premorbid (early life) IQ and later mortality risk: systematic review. Ann. Epidemiol. 17 , 278–288 (2007). 9. Batty, G. D. et al. IQ in late adolescence/early adulthood and mortality by middle age: cohort study of one million Swedish men. Epidemiology 20 , 100–109 (2009). 10. Spearman, C. General intelligence, objectively determined and measured. Am. J. Psychol. 15 , 201–293 (1904). 11. Carroll, J. B. Human Cognitive Abilities: A Survey of Factor Analytic Studies. (Cambridge Univ. Press, Cambridge, 1993). A careful re-analysis of over 460 correlation matrices of cognitive ability tests, indicating a three-stratum hierarchical structure of intelligence with the g factor at the top. 12. Deary, I. J. Looking Down on Human Intelligence: From Psychometrics to the Brain . (Oxford Univ. Press, Oxford, 2000). 13. Deary, I. J., Johnson, W. & Houlihan, L. M. Genetic foundations of human intelligence. Hum. Genet. 126 , 215–232 (2009). A detailed review of the quantitative and molecular genetic literature on intelligence, indicating that intelligence is heritable even though no robust association with a genetic variant has been found so far. 14. McDaniel, M. A. Big-brained people are smarter: a meta-analysis of the relationship between in vivo brain volume and intelligence. Intelligence 33 , 337–346 (2005). A meta-analysis of the relationship between structural MRI measures of full brain size and intelligence, showing a robust positive relationship. 15. Galton, F. Heredity, talent, and character. Macmillan’s Magazine 12 , 157–166; 318–327 (1865). 16. Plomin, R., DeFries, J. C., McClearn, G. E. & McGuffin, P. Behavioral Genetics 5th edn (Worth, New York, 2007). 17. Johnson, W. et al. Genetic and environmental influences on the Verbal - Perceptual - Image Rotation (VPR) model of the structure of mental abilities in the Minnesota Study of Twins Reared Apart. Intelligence 35 , 542–562 (2007). 18. Posthuma, D., de Geus, E. J. & Boomsma, D. I. Perceptual speed and IQ are associated through common genetic factors. Behav. Genet. 31 , 593–602 (2001). 19. Posthuma, D. et al. Genetic correlations between brain volumes and the WAIS-III dimensions of verbal comprehension, working memory, perceptual organization, and processing speed. Twin Res. 6 , 131–139 (2003). 20. Rijsdijk, F. V., Vernon, P. A. & Boomsma, D. I. Application of hierarchical genetic models to Raven and WAIS subtests: a Dutch twin study. Behav. Genet. 32 , 199–210 (2002). 21. Finkel, D., Pedersen, N. L., McGue, M. & McClearn, G. E. Heritability of cognitive abilities in adult twins: comparison of Minnesota and Swedish data. Behav. Genet. 25 , 421–431 (1995). 22. McCartney, K., Harris, M. J. & Bernieri, F. Growing up and growing apart: a developmental meta-analysis of twin studies. Psychol. Bull. 107 , 226–237 (1990). 23. McGue, M., Bouchard, T. J., Iacono, W. G. & Lykken, D. T. in Nature, Nurture, and Psychology (eds Plomin, R. & McClearn, G. E.) 59–76 (American Psychological Association, Washington DC, 1993). 24. Wilson, R. S. Synchronies in mental development: an epigenetic perspective. Science 202 , 939–948 (1978). 25. Spinath, F., Ronald, A., Harlaar, N., Price, T. S. & Plomin, R. Phenotypic g early in life: on the etiology of general cognitive ability in a large population sample of twin children aged 2–4 years. Intelligence 31 , 195–210 (2003). 26. Edmonds, C. J. et al. Inspection time and cognitive abilities in twins aged 7 to 17 years: age-related changes, heritability, and genetic covariance. Intelligence 36 , 210–225 (2008). 27. Jacobs, N., van Os, J., Derom, C. & Thiery, E. Heritability of intelligence. Twin Res. Hum. Genet. 10 , 11–14 (2007). 28. Bartels, M., Rietveld, M. J. H., Van Baal, G. C. M. & Boomsma, D. I. Genetic and environmental influences on the development of intelligence. Behav. Genet. 32 , 237–249 (2002). 29. Hulshoff Pol, H. E. et al. Genetic contributions to human brain morphology and intelligence. J. Neurosci. 26 , 10235–10242 (2006). 30. Pennington, B. F. et al. A twin study of size variations in the human brain. J. Cogn. Neurosci. 12 , 223–232 (2000). 31. Peper, J. S., Brouwer, R. M., Boomsma, D. I., Kahn, R. S. & Hulshoff Pol, H. E. Genetic influences on human brain structure: a review of brain imaging studies in twins. Hum. Brain Mapp. 28 , 464–473 (2007). 32. Posthuma, D. et al . The association between brain volume and intelligence is of genetic origin. Nature Neurosci. 5 , 83–84 (2002). The first empirical demonstration, using a twin study design and structural MRI, that the correlation between brain size and intelligence is genetically mediated. 33. Thompson, P. M. et al. Genetic influences on brain structure. Nature Neurosci. 4 , 1253–1258 (2001). 34. Anokhin, A. P., Muller, V., Lindenberger, U., Heath, A. C. & Meyers, E. Genetic influences on dynamic complexity of brain oscillations. Neurosci. Lett. 397 , 93–98 (2006). 35. Friedman, N. P. et al. Individual differences in executive function are almost entirely genetic in origin. J. Exp. Psychol. Gen. 137 , 201–225 (2008). 36. Miller, G. F. & Penke, L. The evolution of human intelligence and the coefficient of additive genetic variance in human brain size. Intelligence 35 , 97–114 (2007). 37. Shaw, P. et al. Intellectual ability and cortical development in children and adolescents. Nature 440 , 676–679 (2006). A groundbreaking study showing that developmental plasticity in cortical thickness showed a stronger association with intelligence than cortical thickness per se. 38. Sowell, E. R., Thompson, P. M., Holmes, C. J., Jernigan, T. L. & Toga, A. W. In vivo evidence for post- adolescence brain maturation in frontal and striatal regions. Nature Neurosci. 2 , 859–861 (1999). 39. Giedd, J. N., Schmitt, J. E. & Neale, M. C. Structural brain magnetic imaging of pediatric twins. Hum. Brain Mapp. 28 , 474–481 (2007). 40. Lenroot, R. K. et al. Differences in genetic and environmental influences on the human cerebral cortex associated with development in childhood and adolescence. Hum. Brain Mapp. 30 , 163–174 (2009). 41. Chelly, J., Khelfaoui, M., Francis, F., Cherif, B. & Bienvenu, T. Genetics and pathophysiology of mental retardation. Eur. J. Hum. Genet. 14 , 701–713 (2006). 42. Payton, A. The impact of genetic research on our understanding of normal cognitive ageing: 1995 to 2009. Neuropsychol. Rev. 19 , 451–477 (2009). 43. Wisdom, N. M., Callahan, J. L. & Hawkins, K. A. The effects of apolipoprotein E on non-impaired cognitive functioning: a meta-analysis. Neurobiol. Aging 12 Mar 2009 (doi:10.1016/j.neurobiolaging.2009.02.003). 44. Bu, G. Apolipoprotein E and its receptors in Alzheimer’s disease: pathways, pathogenesis and therapy. Nature Rev. Neurosci. 10 , 333–344 (2009). 45. Barnett, J. H., Scoriels, L. & Munafo, M. R. Meta- analysis of the cognitive effects of the catechol - O - transferase gene Val158/108Met polymorphism. Biol. Psychiatry 64 , 137–144 (2008). 46. Goldman, D., Weinberger, D. R., Malhotra, A. K. & Goldberg, T. E. The role of COMT Val158Met in cognition. Biol. Psychiatry 65 , e1–2 (2009). 47. Miyajima, F. et al. Brain-derived neurotrophic factor polymorphism Val66Met influences cognitive abilities in the elderly. Genes Brain Behav. 7 , 411–417 (2007). 48. Need, A. C. et al. A genome-wide study of common SNPs and CNVs in cognitive performance in the CANTAB. Hum. Mol. Genet. 18 , 4650–4661 (2009). 49. Penke, L., Denissen, J. J. A. & Miller, G. F. The evolutionary genetics of personality. Eur. J. Pers. 21 , 549–587 (2007). A theoretical argument that intergenerationally accumulated rare variants (mutation load) underlie much of the genetic variance in intelligence. 50. Penke, L., Denissen, J. J. A. & Miller, G . F. Evolution, genes, and inter-disciplinary personality research. Eur. J. Pers. 21 , 639–665 (2007). 51. Visscher, P. M. Sizing up human height variation. Nature Genet. 40 , 489–490 (2008). 52. Galton, F. Head growth in students at the University of Cambridge. Nature 38 , 14–15 (1888). 53. Spitzka, E. A. A study of the brains of six eminent scientists belonging to the American Anthropometric Society: together with a description of the skull of Professor, E. D. Cope. Trans. Am. Philos. Soc. 21 , 175–308 (1907). 54. Rushton, J. P. & Ankney, C. D. Whole brain size and general mental ability: a review. Int. J. Neurosci. 119 , 691–731 (2009). 55. MacLullich, A. M. et al. Intracranial capacity and brain volumes are associated with cognition in healthy elderly men. Neurology 59 , 169–174 (2002). 56. Witelson, S. F., Beresh, H. & Kigar, D. L. Intelligence and brain size in 100 post-mortem brains: sex, lateralization and age factors. Brain 129 , 386–398 (2006). 57. Andreasen, N. C. et al. Intelligence and brain structure in normal individuals. Am. J. Psychiatry 150 , 130–134 (1993). 58. Flashman, L. A., Andreasen, N. C., Flaum, M. & Swayze, V. W. Intelligence and regional brain volumes in normal controls. Intelligence 25 , 149–160 (1997). 59. Narr, K. L. et al. Relationships between IQ and regional cortical gray matter thickness in healthy adults. Cereb. Cortex 17 , 2163–2171 (2007). REVIEWS 210 | MAR C H 2010 | V OLU M E 11 www.nature.com/reviews/neuro © 2 0 M a c m i l l a n P u b l i s h e r s L i m i t e d . A l l r i g h t s r e s e r v e d 10 60. Jung, R. E. & Haier, R. J. The Parieto-Frontal Integration Theory (P-FIT) of intelligence: converging neuroimaging evidence. Behav. Brain Sci. 30 , 135–154; discussion 154–187 (2007). A detailed review of structural neuroimaging correlates of intelligence supporting the conclusion that, in addition to frontal areas, a network of frontal and posterior brain areas are involved in general cognitive functions. 61. Colom, R., Jung, R. E. & Haier, R. J. General intelligence and memory span: evidence for a common neuroanatomic framework. Cogn. Neuropsychol. 24 , 867–878 (2007). 62. Colom, R. et al. Gray matter correlates of fluid, crystallized, and spatial intelligence: testing the P - FIT model. Intelligence 37 , 124–135 (2009). 63. Haier, R. J. et al. Gray matter and intelligence factors: is there a neuro - g ? Intelligence 37 , 136–144 (2009). 64. Karama, S. et al. Positive association between cognitive ability and cortical thickness in a representative US sample of healthy 6 to 18 year-olds. Intelligence 37 , 145–155 (2009). 65. Choi, Y. Y. et al. Multiple bases of human intelligence revealed by cortical thickness and neural activation. J. Neurosci. 28 , 10323–10329 (2008). 66. Luders, E., Narr, K. L., Thompson, P. M. & Toga, A. W. Neuroanatomical correlates of intelligence. Intelligence 37 , 156–163 (2009). 67. Nachev, P., Mah, Y. H. & Husain, M. Functional neuroanatomy: the locus of human intelligence. Curr. Biol. 19 , R418–R420 (2009). 68. Luo, L. & O’Leary, D. D. M. Axon retraction and degeneration in development and disease. Annu. Rev. Neurosci. 28 , 127–156 (2005). 69. Gläscher, J. et al. Lesion mapping of cognitive abilities linked to intelligence. Neuron 61 , 681–691 (2009). The first brain-wide lesion study on intelligence based on a large sample, which allowed stronger inferences on the necessity of brain regions for general cognitive functions than other structural neuroimaging studies. 70. Sporns, O., Chialvo, D., Kaiser, M. & Hilgetag, C. C. Organization, development and function of complex brain networks. Trends Cogn. Sci. 8 , 418–425 (2004). 71. Li, Y. et al. Brain anatomical network and intelligence. PLoS Comput. Biol. 5 , e1000395 (2009). 72. Achard, S., Salvador, R., Whitcher, B., Suckling, J. & Bullmore, E. A resilient, low-frequency, small-world human brain functional network with highly connected association cortical hubs. J. Neurosci. 26 , 63–72 (2006). 73. Bullmore, E. & Sporns, O. Complex brain networks: graph theoretical analysis of structural and functional systems. Nature Rev. Neurosci. 10 , 186–198 (2009). 74. Frisoni, G. B., Galluzzi, S., Pantoni, L. & Filippi, M. The effect of white matter lesions on cognition in the elderly: small but detectable. Nature Clin. Pract. Neurol. 3 , 620–627 (2007). 75. Turken, A. et al. Cognitive processing speed and the structure of white matter pathways: convergent evidence from normal variation and lesion studies. Neuroimage 42 , 1032–1044 (2008). 76. Deary, I. J., Leaper, S. A., Murray, A. D., Staff, R. T. & Whalley, L. J. Cerebral white matter abnormalities and lifetime cognitive change: a 67 year follow up of the Scottish Mental Survey 1932. Psychol. Aging 18 , 140–148 (2003). 77. Jung, R. E. et al. Imaging intelligence with proton magnetic resonance spectroscopy. Intelligence 37 , 192–198 (2009). 78. Deary, I. J. et al. White matter integrity and cognition in childhood and old age. Neurology 66 , 505–512 (2006). 79. Schmithorst, V. J., Wilke, M., Dardzinski, B. J. & Holland, S. K. Cognitive functions correlate with white matter architecture in a normal pediatric population: a diffusion tensor MRI study. Hum. Brain Mapp. 26 , 139–147 (2005). 80. Chiang, M. C. et al. Genetics of brain fiber architecture and intellectual performance. J. Neurosci. 29 , 2212–2224 (2009). 81. Charlton, R. A., McIntyre, D. J., Howe, F. A., Morris, R. G. & Markus, H. S. The relationship between white matter brain metabolites and cognition in normal aging: the GENIE study. Brain Res. 1164 , 108–116 (2007). 82. Yu, C. et al. White matter tract integrity and intelligence in patients with mental retardation and healthy adults. Neuroimage 40 , 1533–1541 (2008). 83. Neubauer, A. C. & Fink, A. Intelligence and neural efficiency. Neurosci. Biobehav. Rev. 33 , 1004–1023 (2009). A detailed and critical review of the neural efficiency hypothesis of intelligence based on functional neuroimaging data. 84. Haier, R. J. et al. Cortical glucose metabolic-rate correlates of abstract reasoning and attention studied with positron emission tomography. Intelligence 12 , 199–217 (1988). 85. van den Heuvel, M. P., Stam, C. J., Kahn, R. S. & Hulshoff Pol, H. E. Efficiency of functional brain networks and intellectual performance. J. Neurosci. 29 , 7619–7624 (2009). 86. Song, M. et al. Brain spontaneous functional connectivity and intelligence. Neuroimage 41 , 1168–1176 (2008). 87. Haier, R. J., Jung, R. E., Yeo, R. A., Head, K. & Alkire, M. T. The neuroanatomy of general intelligence: sex matters. Neuroimage 25 , 320–327 (2005). 88. Schmithorst, V. J. Developmental sex differences in the relation of neuroanatomical connectivity to intelligence. Intelligence 37 , 164–173 (2009). 89. Neubauer, A. C., Grabner, R. H., Fink, A. & Neuper, C. Intelligence and neural efficiency: further evidence of the influence of task content and sex on the brain–IQ relationship. Brain Res. Cogn. Brain Res. 25 , 217–225 (2005). 90. Johnson, W. & Bouchard, T. J. Sex differences in mental abilities: g masks the dimensions on which they lie. Intelligence 35 , 23–39 (2007). 91. Chen, X., Sachdev, P. S., Wen, W. & Ansteyc, K. J. Sex differences in regional gray matter in healthy individuals aged 44–48 years: a voxel-based morphometric study. Neuroimage 36 , 691–699 (2007). 92. de Courten-Myers, G. M. The human cerebral cortex: gender differences in structure and function. J. Neuropathol. Exp. Neurol. 58 , 217–226 (1999). 93. Luders, E. et al. Gender differences in cortical complexity. Nature Neurosci. 7 , 799–800 (2004). 94. Dykiert, D., Gale, C. G. & Deary, I. J. Are apparent sex differences in mean IQ scores created in part by sample restriction and increased male variance? Intelligence 37 , 42–47 (2009). 95. Penke, L. in The Evolution of Personality and Individual Differences (eds Buss, D. M. & Hawley, P. H.) (Oxford Univ. Press, New York, in the press). 96. Johnson, W. & Bouchard, T. J. Sex differences in mental ability: a proposed means to link them to brain structure and function. Intelligence 35 , 197–209 (2007). 97. Johnson, W., Jung, R. E., Colom, R. & Haier, R. J. Cognitive abilities independent of IQ correlate with regional brain structure. Intelligence 36 , 18–28 (2008). 98. Park, D. C. & Reuter-Lorenz, P. The adaptive brain: aging and neurocognitive scaffolding. Annu. Rev. Psychol. 60 , 173–196 (2009). 99. Cabeza, R. Hemispheric asymmetry reduction in older adults: the HAROLD model. Psychol. Aging 17 , 85–100 (2002). 100. Lohman, D. in Handbook of Intelligence (ed. Sternberg, R. J.) 285–340 (Cambridge Univ. Press, New York, 2000). 101. Iaria, G., Petrides, M., Dagher, A., Pike, B. & Bohbot, V. D. Cognitive strategies dependent on the hippocampus and caudate nucleus in human navigation: variability and change with practice. J. Neurosci. 23 , 5945–5952 (2003). 102. Rypma, B., Berger, J. S., Genova, H. M., Rebbechi, D. & D’Esposito, M. Dissociating age-related changes in cognitive strategy and neural efficiency using event- related fMRI. Cortex 41 , 582–594 (2005). 103. Koten, J. W. et al . Genetic contribution to variation in cognitive function: an fMRI study in twins. Science 323 , 1737–1740 (2009). An empirical demonstration of heritable individual differences in fMRI activation patterns underlying distinct cognitive strategies to solve a working memory task in remembering exposure to digits. 104. Manolio, T. A. et al. Finding the missing heritability of complex diseases. Nature 461 , 747–753 (2009). 105. Boring, E. G. Intelligence as the tests test it. New Republic 35 , 35–37 (1923). 106. Gottfredson, L. S. Mainstream science on intelligence: an editorial with 52 signatories, history, and bibliography. Intelligence 24 , 13–23 (1997). 107. Johnson, W. & Bouchard, T. J. The structure of human intelligence: it is verbal, perceptual, and image rotation (VPR) not fluid and crystallized. Intelligence 33 , 393–416 (2005). 108. Visser, B. A., Ashton, M. C. & Vernon, P. A. Beyond g : putting multiple intelligence theory to the test. Intelligence 34 , 487–502 (2006). 109. Horn, J. L. in Intelligence: Measurement, Theory, and Public Policy (ed. Linn, R. L.) 29–73 (Univ. Illinois Press, Urbana, 1989). 110. Johnson, W., te Nijenhuis, J. & Bouchard, T. J. Still just one g : consistent results from five test batteries. Intelligence 32 , 81–95 (2008). An empirical demonstration that g is not dependent on specific cognitive test batteries as long as there is sufficient variety in the tests. 111. Gould, S. J. The Mismeasure of Man (Penguin, Harmondsworth, 1981). 112. Bartholomew, D. J., Deary, I. J. & Lawn, M. A new lease of life for Thomson’s bonds model of intelligence. Psychol. Rev. 116 , 567–579 (2009). 113. van der Maas, H. L. J. et al. A dynamical model of general intelligence: the positive manifold of intelligence by mutualism. Psychol. Rev. 113 , 842–861 (2006). 114. Bouchard, T. J. Genetic influence on human intelligence (Spearman’s g ): how much? Ann. Hum. Biol. 36 , 527–544 (2009). 115. Bouchard, T. J. & McGue, M. Familial studies of intelligence: a review. Science 212 , 1055–1059 (1981). 116. Turkheimer, E., Haley, A., Waldron, M., D’Onofrio, B. M. & Gottesman, I. I. Socioeconomic status modifies heritability of IQ in young children. Psychol. Sci. 14 , 623–628 (2003). 117. van den Oord, E. J. & Rowe, D. C. An examination of genotype-environment interactions for academic achievement in a US national longitudinal survey. Intelligence 25 , 205–228 (1998). 118. Deary, I. J. et al. Intergenerational social mobility and mid-life status attainment: influences of childhood intelligence, childhood social factors, and education. Intelligence 33 , 455–472 (2005). 119. Johnson, W. Genetic and environmental influences on behavior: capturing all the interplay. Psychol. Rev. 114 , 423–440 (2007). 120. Salthouse, T. A. Localizing age-related individual differences in a hierarchical structure. Intelligence 32 , 541–561 (2004). 121. Petrill, A. A. et al. The genetic and environmental relationship between general and specific cognitive abilities in twins age 80 and older. Psychol. Sci. 9 , 183–189 (1998). Acknowledgement The work was undertaken by The University of Edinburgh Centre for Cognitive Ageing and Cognitive Epidemiology, part of the cross-council Lifelong Health and Wellbeing Initiative. Funding from the Biotechnology and Biological Sciences Research Council, Engineering and Physical Sciences Research Council, Economic and Social Research Council and Medical Research Council is gratefully acknowledged. Competing interests statement The authors declare no competing financial interests. DATABASES Entrez Gene: http://www.ncbi.nlm.nih.gov/gen e APOE | BDNF | COMT FURTHER INFORMATION Ian J. Deary’s homepage: http://www.psy.ed.ac.uk/people/iand Lars Penke’s homepage: http://www.larspenke.eu/english.html Wendy Johnson’s homepage: http://www.psy.ed.ac.uk/people/wjohnson/ ALL LI N KS A RE A C T IVE I N T HE O N LI N E PDF REVIEWS N AT U R E R EV I E WS | NEUROSCIE N CE V OLU M E 11 | MAR C H 2010 | 211 © 2 0 M a c m i l l a n P u b l i s h e r s L i m i t e d . A l l r i g h t s r e s e r v e d 10 About the authors Ian J. Deary trained in medicine and psychology. He has been Professor of Differential Psychology at the U niversity of E dinburgh, U K, since 1995 and Director of the U niversity of E dinburgh C entre for C ognitive Ageing and C ognitive E pidemiology since 2008. He studies the origins, nature and implications of human intelligence and per - sonality differences. He studies the determinants of cognitive ageing and reciprocal associations between intelligence and health through the lifespan (cognitive epidemiology). He leads The Disconnected Mind project at the U niversity of E dinburgh, which includes cogni - tive- and health-based follow-up studies of people who took part in the Scottish Mental Surveys of 1932 and 1947. L ars Penke received his doctoral degree from Humboldt U niversity of Berlin, Germany, in 2007 and has since worked in the Disconnected Mind project at the U niversity of E dinburgh’s C entre for C ognitive Ageing and C ognitive E pidemiology. He studies the neurobiological underpinnings of intelligence and cognitive ageing, especially those related to white matter integrity. He also works on an evolutionary conceptualization of psychological differences, especially the selection processes that maintain genetic variation in intelligence and personal - ity. Furthermore, he is interested in the evolutionary psychology of human mating and romantic relationships, which he studies using behavioural observation designs such as speed dating. Wendy Johnson transitioned from consulting actuary to research psychologist from 1995–2005. She now pursues research involving the structure and nature of general intelligence and special mental abilities, personality structure and development, antecedents of indi - vidual and sex differences in academic achievement, psychological antecedents of later-life health and psychological well-being, and con - tributions of cognitive ability to later-life outcomes. Her particular emphasis is on understanding the underlying transactions between genetic and environmental influences. She is currently a Fellow of the Research C ouncil of the U nited Kingdom in the Department of Psychology at the U niversity of E dinburgh. At-a - glance summary �u More than 100 years of empirical research provide conclusive evi - dence that a general factor of intelligence (also known as g , gen - eral cognitive ability, mental ability and IQ (intelligence quotient)) exists, despite some claims to the contrary. Intelligence can be reli - ably measured, is stable in rank-order across the lifespan, and is predictive of many important life outcomes, including educational and occupational success, health and longevity. �u Intelligence shows high heritability in quantitative genetic stud - ies; this heritability increases across the lifespan to mid-adulthood and partly overlaps with genetic variance that influences brain structure. �u As with many other highly heritable complex traits, the genetic polymorphisms underlying normal-range intelligence differences remain elusive. O ne possible explanation is that many mildly harmful, lineage-specific, rare genetic variants (‘mutation load’) might be responsible for the heritability of intelligence. �u The most robust finding in the neuroscience of intelligence is that larger brains, and a greater volume of grey matter in various regions in the brain, are associated with higher intelligence. �u Intelligence does not reside in a single localized area in the brain. The available evidence suggests a widely distributed network of parieto-frontal brain areas underlies intelligence. �u The distributed nature of intelligence in the brain suggests a crucial role of white matter integrity and an efficient neurological network structure. Both hypotheses have initial empirical support. �u Functional efficiency (that is, low energy consumption in task- relevant brain areas) is also related to higher intelligence, especially when task difficulty is neither particularly high nor particularly low. �u V arious lines of evidence suggest that men and women might use their brains differently to achieve similar levels of cognitive per - formance. These sex differences might extend to individual differ - ences: people might differ in how they use their brains to solve the same cognitive tasks. 000 The neuroscience of human intelligence �F�K-�G�T�G�P�E�G�U Ian J. Deary, Lars Penke and Wendy Johnson The biological bases of individual differences in intelligence are largely unknown. Deary and colleagues discuss why, despite its high heritability, the molecular underpinnings of intelligence remain elusive, and show that variations in the structure and efficiency of brain pathways might contribute to intelligence differences. ON LI N E ON L Y © 2 0 M a c m i l l a n P u b l i s h e r s L i m i t e d . A l l r i g h t s r e s e r v e d 10