/
ENERGY PROFILE ENERGY PROFILE

ENERGY PROFILE - PDF document

harmony
harmony . @harmony
Follow
344 views
Uploaded On 2021-07-03

ENERGY PROFILE - PPT Presentation

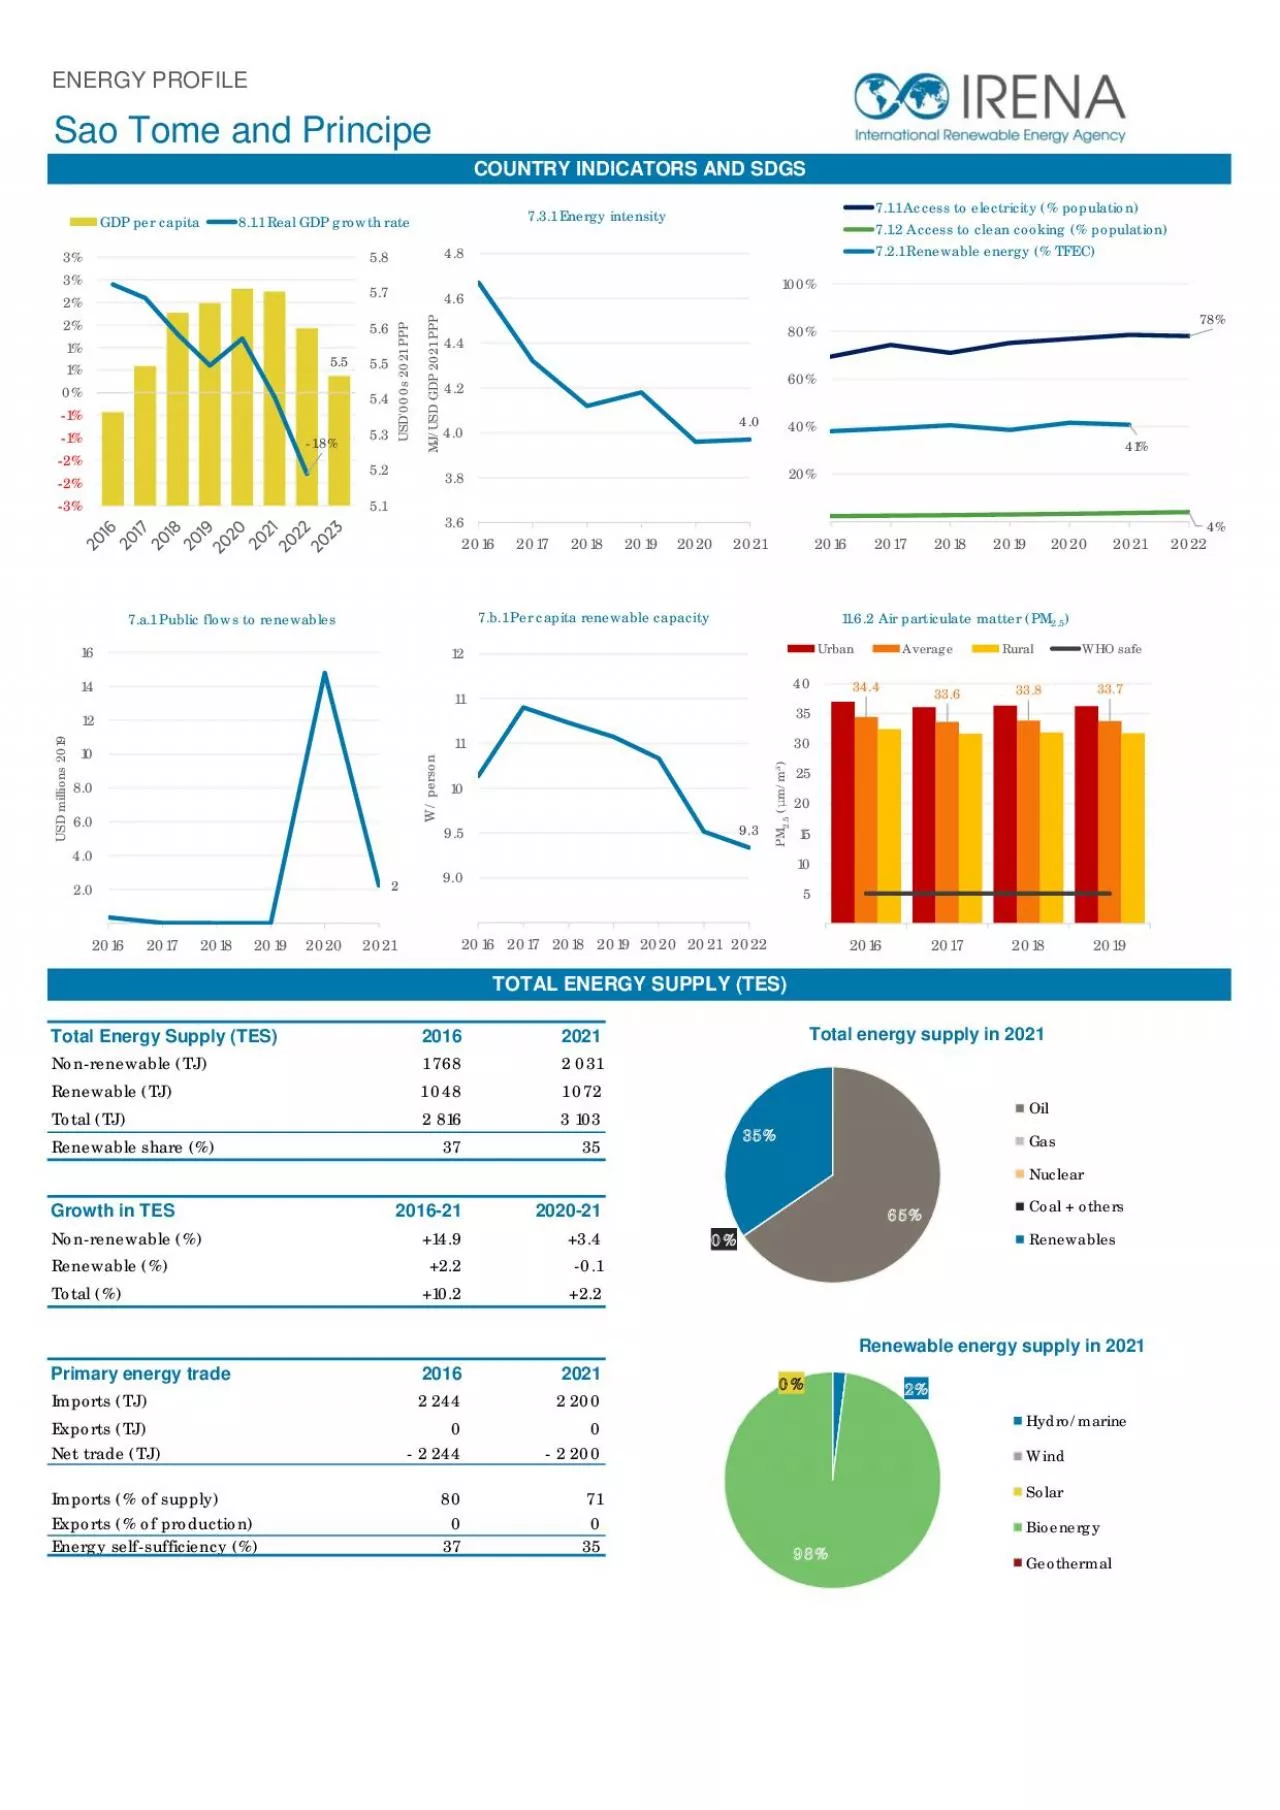
Renewable energy of TFEC 384 Access to electricity of population 725 Energy efficiency MJ per 1 of GDP 45 Access to clean cooking of population Public flows renewables 2017 USD M 0 ID: 852719

energy renewable wind 2017 renewable energy 2017 wind solar capacity total emissions generation electricity 2018 geothermal irena power hydro

Share:

Link:

Embed:

Download Presentation from below link

Download Pdf The PPT/PDF document "ENERGY PROFILE" is the property of its rightful owner. Permission is granted to download and print the materials on this web site for personal, non-commercial use only, and to display it on your personal computer provided you do not modify the materials and that you retain all copyright notices contained in the materials. By downloading content from our website, you accept the terms of this agreement.


Presentation Transcript

1 ENERGY PROFILE Renewable energy (% of TF
ENERGY PROFILE Renewable energy (% of TFEC) 38.4 Access to electricity (% of population) 72.5 Energy efficiency (MJ per $1 of GDP) 4.5 Access to clean cooking (% of population) Public flows renewables (2017 USD M) 0.0 Per capita renewable capacity (W/person) 12.7 TPES 2012 2017 Non-renewable (TJ) 1 571 1 771 Renewable (TJ) 944 1 056 Total (TJ) 2 515 2 827 Renewable share (%) 38 37 Growth in TPES 2012-17 2016-17 Non-renewable (%) +12.7 +4.2 Renewable (%) +11.8 +0.5 Total (%) +12.4 +2.8 Primary energy trade 2012 2017 Imports (TJ) 2 012 2 269 Exports (TJ) 0 0 Net trade (TJ) - 2 012 - 2 269 Imports (% of supply) 80 80 Exports (% of production) 0 0 Energy self-sufficiency (%) 38 37 Net trade (USD million) - 37 - 29 Net trade (% of GDP) -14.5 -7.6 Consumption by source 2012 2017 Electricity (TJ) 14 18 Heat (TJ) 0 0 Bioenergy (TJ) 692 788 Solar + geothermal (TJ) 0 0 Total (TJ) 706 806 Electricity share (%) 2 2 Consumption growth 2012-17 2016-17 Renewable electricity (%) +27.7 +0.3 Other renewables (%) +13.9 +0.4 Total (%) +14.2 +0.4 Consumption by sector 2012 2017 Industry (TJ) 0 0 Transport (TJ) 0 0 Households (TJ) 699 797 Other (TJ) 7 9 Renewable share of TFEC 38.4 SUSTAINABLE DEVELOPMENT GOAL 7: ENERGY INDICATORS (2017) TOTAL PRIMARY ENERGY SUPPLY (TPES) Total primary energy supply in 2017 RENEWABLE ENERGY CONSUMPTION Renewable energy supply in 2017 Renewable energy consumption in 2017 Sao Tome and Principe 63% 37% Oil Gas Nuclear Coal + others Renewables 2% 0% 98% Hydro/marine Wind Solar Bioenergy Geothermal 2% 98% Electricity Heat Bioenergy Solar + geothermal 99% 1% Industry Transport Households Other Capacity in 2019 MW % Non-renewable 45 94 Renewable 3 6 Hydro/marine 2 5 Solar 0 1 Wind 0 0 Bioenergy 0 0 Geothermal 0 0 Total 48 100 Capacity change (%) 2014-19 2018-19 Non-renewable + 38 0.0 Renewable + 9 0.0 Hydro/marine 0 0

2 .0 Solar + 222 0.0 Wind 0 0.0
.0 Solar + 222 0.0 Wind 0 0.0 Bioenergy 0 0.0 Geothermal 0 0.0 Total + 36 0.0 Generation in 2018 GWh % Non-renewable 96 94 Renewable 6 6 Hydro and marine 6 6 Solar 0 0 Wind 0 0 Bioenergy 0 0 Geothermal 0 0 Total 102 100 Per capita electricity generation (kWh) Geothermal Capacity utilisation in 2018 (%) Renewable generation (GWh) ELECTRICITY CAPACITY AND GENERATION 0 Hydro and marine 0 Net capacity change (MW) Net capacity change in 2019 (MW) Solar 0 Bioenergy 0 Wind 0 0 Renewable capacity in 2019 Non-renewable 0 1 2 3 4 5 6 7 8 9 10 2014 2015 2016 2017 2018 2019 Non-renewable Renewable 14 29 24 0 20 40 60 80 100 Geo Bio Wind Solar Hydro/Mar Nuclear Fossil 6 6 6 6 6 2013 2014 2015 2016 2017 2018 Hydro/marine Solar Wind Bio Geo 0 200 400 600 2013 2014 2015 2016 2017 2018 Total Renewable 88% 12% Hydro/marine Solar Wind Bioenergy Geothermal 3 7 4 Most immediate clean energy targets & NDCs year target unit Renewable energy: Renewable electricity: 2030 47 % Renewable capacity: Renewable transport: Liquid Biofuel blending mandate: Other transport targets: Renewable heating/cooling: Renewable Hydropower 2030 34 % Off-grid renewable technologies: Energy efficiency (Energy): Energy efficiency (Electricity): Latest policies, programmes and legislation References to sustainable energy in Nationally Determined Contribution (NDC) Conditional Unconditional unit - Renewable energy - electricity 47 % - transport - heating/cooling - Energy efficiency 2018 Avoided emissions based on fossil fuel mix used for power Calculated by dividing power sector emissions by elec. + heat gen. Avoided emissions from renewable elec. & heat ENERGY AND EMISSIONS Energy-related CO 2 emissions by sector Elec. & heat generation CO 2 emissions in TARGETS, POLICIES AND MEASURES CO 2 emission factor for elec. & heat generation 0.0 0.1 0.1 0.2 0.2 2013 2014 2015 2016

3 2017 2018 Mt CO 2 Emissions Elec. & hea
2017 2018 Mt CO 2 Emissions Elec. & heat Other Industrial Transport Other Buildings 0% 0% 100% Coal + others Gas Oil 0.0 0.0 0.0 0.0 0.0 2013 2014 2015 2016 2017 2018 Mt CO 2 Emissions Emitted CO2 RE Avoided CO2 360 343 0.0 200 400 600 800 2013 2014 2015 2016 2017 2018 tCO 2 /GWh STP Africa World World RENEWABLE RESOURCE POTENTIAL Biomass potential: net primary production IRENA Headquarters Masdar City P.O. Box 236, Abu Dhabi United Arab Emirates www.irena.org Indicators of renewable resource potential Sources: IRENA statistics , plus data from the following sources: UN SDG Database (original sources: WHO; World Bank; IEA; IRENA; and UNSD); UN World Population Prospects; UNSD Energy Balances; UN COMTRADE; World Bank World Development Indicators; EDGAR; REN21 Global Status Report; IEA- IRENA Joint Policies and Measures Database; IRENA Global Atlas; and World Bank Global Solar Atlas and Global Wind Atlas. Additional notes: Capacity per capita and public investments SDGs only apply to developing areas. Energy self-sufficiency has been defined as total primary energy production divided by total primary energy supply. Energy trade includes all commodities in Chapter 27 of the Harmonised System (HS). Capacity utilisation is calculated as annual generation divided by year-end capacity x 8,760h/year. Avoided emissions from renewable power is calculated as renewable generation divided by fossil fuel generation multiplied by reported emissions from the power sector. This assumes that, if renewable power did not exist, fossil fuels would be used in its place to generate the same amount of power and using the same mix of fossil fuels. In countries and years where no fossil fuel generation occurs, an average fossil fuel emission factor has been used to calculate

4 the avoided emissions. These profiles h
the avoided emissions. These profiles have been produced to provide an overview of developments in renewable energy in different countries and areas. The IRENA statistics team would welcome comments and feedback on its structure and content, which can be sent to statistics@irena.org . Sao Tome Prn Sao Tome Prn World Distribution of solar potential Distribution of wind potential 0% 20% 40% 60% 80% 100% Proportion of land area 260 260 - 420 420 - 560 560 - 670 670 - 820 820 - 1060 �1060 Wind power density at 100m height (W/m 2 ) 0 1 2 3 4 5 6 7 8 9 10 11 0% 20% 40% 60% 80% 100% Proportion of land area 1200 1200 - 1400 1400 - 1600 1600 - 1800 1800 - 1900 1900 - 2000 �2000 Annual generation per unit of installed PV capacity (kWh/kWp/yr) 1.5 tC/ha/yr Solar PV: Solar resource potential has been divided into seven classes, each representing a range of annual PV output per unit of capacity (kWh/kWp/yr). The bar chart shows the proportion of a country's land area in each of these classes and the global distribution of land area across the classes (for comparison). Onshore wind: Potential wind power density (W/m2) is shown in the seven classes used by NREL, measured at a height of 100m. The bar chart shows the distribution of the country's land area in each of these classes compared to the global distribution of wind resources. Areas in the third class or above are considered to be a good wind resource. Biomass: Net primary production (NPP) is the amount of carbon fixed by plants and accumulated as biomass each year. It is a basic measure of biomass productivity. The chart shows the average NPP in the country (tC/ha/yr), compared to the global average NPP of 3 - 4 tonnes of carbon per year. = Global average of 3 - 4 tC/ha/yr