/
PIBOEMPPACFISH INFISH BIOLOGICAL OPINIONEFFECTIVENESS MONITORING PROGR PIBOEMPPACFISH INFISH BIOLOGICAL OPINIONEFFECTIVENESS MONITORING PROGR

PIBOEMPPACFISH INFISH BIOLOGICAL OPINIONEFFECTIVENESS MONITORING PROGR - PDF document

holly
holly . @holly
Follow
342 views
Uploaded On 2021-08-26

PIBOEMPPACFISH INFISH BIOLOGICAL OPINIONEFFECTIVENESS MONITORING PROGR - PPT Presentation

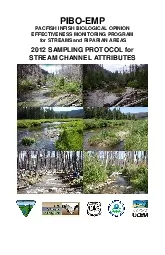
iii2012SAMPLING PROTOCOL FOR STREAM CHANNEL ATTRIBUTESPACFISHINFISH Biological Opinion Effectiveness Monitoring Program PIBOEMP StaffMultifederal Agency Monitoring ProgramLogan UTArcher Eric KScully ID: 872187

reach 146 pool bank 146 reach bank pool 145 water channel bankfull measure elevation beaver figure stream record location

Share:

Link:

Embed:

Download Presentation from below link

Download Pdf The PPT/PDF document "PIBOEMPPACFISH INFISH BIOLOGICAL OPINION..." is the property of its rightful owner. Permission is granted to download and print the materials on this web site for personal, non-commercial use only, and to display it on your personal computer provided you do not modify the materials and that you retain all copyright notices contained in the materials. By downloading content from our website, you accept the terms of this agreement.


Presentation Transcript

1 PIBOEMPPACFISH INFISH BIOLOGICAL OPINION
PIBOEMPPACFISH INFISH BIOLOGICAL OPINIONEFFECTIVENESS MONITORING PROGRAMfor STREAMS and RIPARIAN AREASSAMPLING PROTOCOL forSTREAM CHANNEL ATTRIBUTES ii i 2012SAMPLING PROTOCOL FOR STREAM CHANNEL ATTRIBUTESPACFISH/INFISH Biological Opinion Effectiveness Monitoring Program (PIBOEMP) StaffMultifederal Agency Monitoring Program;Logan, UT Archer, Eric K.;Scully, Rebecca A.; Henderson, RichardRoper, Brett B. and Heitke, Jeremiah D.. Effectiveness monitoring for streams and riparian areas: sampling protocol for stream channel attributes. Unpublished paper on file athttp://www.fs.fed.us/biology/fishecology/emp For Information about PIBO Effectiveness Monitoring,contact Eric Archer, PIBO project leader, atACKNOWLEDGEMENTSThe authors wish to thank everyone who helped develop this sampling protocol.We especially appreciate the critical input from hundreds of summer technicians and staff members who were invaluable in refining, clarifying, and evaluating the methods. We thank Ann Carlson, Tim Burton, Charles Hawkins, Phil Kaufman, Kerry Overton, David Peck, John Potyondy, Gordy Reeves, Jack Schmidt, Rick Henderson, Jeff Kershner and many others for their advice an

2 d review of the various drafts. We also
d review of the various drafts. We also thank Kate Dircksen, Emily Hall, Deanna Vinson and Jeremiah Heitke for their artistic diagrams. Thanks to the U.S. Forest Service (FS) Regions 1, 4, and 6 and the Idaho and Oregon/Washington State Offices of the Bureau of Land Management (BLM). Finally, we thank the Aquatic and Riparian Effectiveness Monitoring Program (AREMP) who we have cooperated with to standardize a core set of sampling methods. ii iii INTRODUCTIONThe PACFISH/INFISH Effectiveness Monitoring (PIBOEM) Program for aquatic and riparian resources was developed in 1998 in response to monitoring needs addressed in the Biological Opinions for bull trout (USFWS 1998) and steelhead (NMFS 1995). The primary objective is to determine whether priority biological and physical attributes, processes, and functions of riparian and aquatic systems are being degraded, maintained, or restoredin the PIBOEM area. The program samples within the interior Columbia River basin on lands managed by U.S. Forest Service (FS) Regions 1, 4, and 6 and the Idaho and Oregon/Washington State Offices of the Bureau of Land Management (BLM).This document describes the sampling

3 methods used bythe PIBOEM program durin
methods used bythe PIBOEM program during 20. The methods are a result of 1years of use, evaluation, and peer review. We worked with the Aquatic and Riparian Effectiveness Monitoring Program to standardize methods, which resulted in a document titled “Effectiveness Monitoring for Streams and Riparian Areas within the Pacific Northwest: Stream Channel Methods for Core Attributes” (USDA 2006). The PIBOEM protocol incorporates all methods described in this document. In addition, we would like to recognize the following authors and acknowledge the original citations for each method, while recognizing that numerous modification have been made.Harrelson et al. (1994) Reach layout, bankfull elevation, gradient, and sinuosity.Wolman (1954) and Lazorchak et al. (1998) Streambed particle countsBauer and Burton (1993) and USFS R5 SCI Guidebook (1998) Pool tail finesBauer and Burton (1993) and Platts et al. (1987) Bank stabilityKershner et al. (2004) Defining habitat units Lisle (1987) Residual pool depthsPlatts et al. (1987) Bank angle and undercut banksRosgen (1996) Channel crosssectionsHawkins et al. (2003) Macroinvertebrates Moore et al. (2002) and Hankin and

4 Reeves (1988) Large woodFinally, the pr
Reeves (1988) Large woodFinally, the protocol and the individual methods were designed and tested specifically to sample a stream reach and to monitor the effects of management activities. Reach lengths are a minimum of 20 bankfull channel widths, range from 160 to 480 meters, and are wadeable. iv v SAMPLING ORDER.....................................................................................BANKFULL..................................................................................................WHERE STREAMBED AND STREAMBANK MEET..................................SCOUR LINE................................................................................................THALWEG....................................................................................................WIDTH CATEGORY.....................................................................................SETTING UP YOUR REACH: GETTING STARTED...................................OLD SITE:Setting Up Your Reach........................................................NEW SITE:Setting Up Your Reach.....................................................SIDE CHANNELS..........................

5 ........................................
............................................................UTM COORDINATES................................................................................RECORD DISTURBANCE.........................................................................RECORDING STREAM FLO..................................................................SITE MARKERS.........................................................................................MACROINVERTEBRAT........................................................................WATER CHEMISTRY................................................................................Photos........................................................................................................HABITAT UNITS: POOLS vs. RIFFLE / RUNS.........................................POOL TAIL FINES.....................................................................................CROSS SECTIONS: INTRO......................................................................CROSS SECTIONS: Water....................................................................CROSSSECTIONS: BF.........................................................................PEBBLE C

6 OUNTS...................................
OUNTS.....................................................................................BANKFULL WIDTH....................................................................................BANK ANGLE............................................................................................Bank Angle: Depositional Features.....................................................Bank Angle: Slump Blocks, Logs, Rocks............................................Bank Angle Key......................................................................................Bank Stability............................................................................................Streambank Stability Classification Key..................................................BANK TYPE...............................................................................................LARGE WOOD...........................................................................................REACH MAP.............................................................................................. MEASURING CHANGE IN REACH ELEVATION.....................................REFERENCES........................................

7 ........................................
...................................................APPENDIX A: Stream Data Logger Troubleshooting............................APPENDIX B: Sampling Sites with Beaver Activity...............................APPENDIX C: Sampling When There Isn’t Flowing Water throughout the Site.....................................................................................................APPENDIX D: UnScouted DMA Site....................................................Appendix E: Placing Instruments (Hobo and Cow Cam)....................Appendix F: Aquatic Invasive Protocol................................................Appendix G: Gear Decontamination.....................................................Equipment List........................................................................................Checklist for Crew.................................................................................. vi Figure Overview of reach layout showing locations of BR / TR, BR / TR markers, habitat units, large wood, islands, and transects. 1 SAMPLING ORDERNavigate tothe site using all information (drivingdirections, hiking directions, UTMs, etc) Pinpoint BR location and es

8 tablish transect 1Determine bankfull ele
tablish transect 1Determine bankfull elevation, scour line, and where streambed and stream bank meetas a groupstream and vegtechsWhileat the BRtechnician collects macroinvertebratesndtechnician:Begin filling out forms 1,2, and 4 (you can do this while driving to site)Work with the Veg tech to validatetheBR and BR marker informationWork with the Veg tech to collect UTMs Take RchID / Date photoTake BR photosFinish setting up the reach: Place additionaltransect flags and pinpoint TRWhile you’re at the TR:Calculate reach lengthValidate TR marker infoand the TR location communicate this information to your veg techWater chemistryRecord disturbanceTake TR photosQuantify habitat units(pools vs. riffle / runand count wood in each habitat uniteasure channel crosssectionsbankfull widths, and pebblesMeasure streambanks (bank angle, bank stability, bank typessess andmeasurelarge woodDraw reach mapeasure the elevation changeBefore leaving the reach:Review allforms for completenessview entries in the data loggerCheck to make sure you have all equipment and formsMake sure UTMs are collected in the Veg PDAAfter returning to the truckecontaminate gear before going to the next

9 siteackup loggerNOTE: Take photos durin
siteackup loggerNOTE: Take photos during favorable light conditions, not directly into the sun or when it’s too dark*Only draw a new reach map in the special cases listed in the reach map 2 BANKFULLObjective:Examine bankfull indicators throughout the reach and determine dominant bankfull height. Do not sample until you are confident of the bankfull height! Do this as agroup(all crew members) Bankfull Indicatorsll six indicators may not be presentExamine streambanks for an active floodplain.This is a relatively flat, depositional area that is commonly vegetated and above the current water level unless there is a large amount of spring runoff or there has been a substantial rain event (i.e. stream running at bankfull stage).Examine depositional features such as point bars.The highest elevation of a point bar usually indicates the lowest possible elevation for bankfull stage. However, depositional features can form both above and below the bankfull elevation when unusual flows occur during years preceding the survey. Large floods can form bars that extend above bankfull whereas several years of low flows can result in bars forming below bankfull elevation

10 .A break in slope of the banks andor cha
.A break in slope of the banks andor change in the particle size distributionfrom coarser bed load particles to finer particles deposited during bank overflow conditions.Define an elevation where mature key riparian woody vegetation exists. The lowest elevation of birch, alder, and dogwood can be useful, whereas willows are often found below the bankfull elevation.Examine the ceiling of undercut banks.This elevation is normally below the bankfull elevation.Stream channels actively attempt to reform bankfull features such as floodplains after shifts or down cutting in the channel.Be careful not to confuse old floodplains and terraces with the present indicators.Measuring Bankfull HeightAfter you identify bankfull, measure the vertical distance from the water’s surface to the dominant bankfull elevation measured throughout the reach.This vertical distance can be used when bankfull indicators are not present at a particular point along the streambank.Bankfull height is needed for streambank measurements, bankfull widths, pebble counts, large wood, and crosssections. 3 WHERE STREAMBED ANDSTREAMBANK MEETThe location where the streambed and bank meet can be id

11 entified by:Break in the relatively stee
entified by:Break in the relatively steep streambank slope to a more gently sloping streambed.Associated with a rapid fining of particles from relatively coarse streambed particles to the finer streambank particles.Normally (but not always) below the current water level.The streambed has 50% terrestrial vegetative cover.The streambank is usually consolidated, the streambed is usually unconsolidated.In a few situations, it can be difficult to determine differences between the streambed and streambank in reaches with cobble or bedrock substrate. Begin assessing all streambank measurements at the scour line in these situations.SCOUR LINE Use these indicators identify the lowest consistent scour line within your reach, and measure how far above the water’s surface it occurs Lowest consistent imit of sod forming vegetationLowest consistent imit of perennial vegetationThe ceiling of undercut banksin straight sections of stream channelOn depositional features such as point bars, the scour lineis often defined by the limit of perennial vegetation, or by an indentation in the bar (locally steep area). Where to look: the best place to identify scour line is in a strai

12 ght, wellvegetated section of the strea
ght, wellvegetated section of the stream channel. If you cannot identify the scour line at a specific location or transect, then use the average scour line elevation measured throughout the reach.If flows are above scourline we generally don’t sample.f this is the case, call prior to sampling. 4 THALWEG s the line connecting the deepest part of the channel. It is almost always the fasteflow in any river The thalweg moves back and forth across a channel River right (RR) and river left (RL) are always relativeto theobservelooking down stream iver right(RR) is to the right of an observer looking downstream.River left (RL) to the left of the observer looking downstream.WIDTH CATEGORY Width category= transect spacing interval, or the distance between transectsmeasured along the thalweg Use the width category provided to you on Site Information Sheet.Width categories are even numbers that increase by multiples of 2 (6m, 8m, 10m, 12m, 14m, etc) in proportion to bankfull width.If info is missingor misleading: Call hotline! 5 SETTING UP YOUR REACGETTING STARTEDBackground:The PIBOEM sample design consists of a 5year rotation of sitessites sampled in 200were

13 resampled in, and will be sampled again
resampled in, and will be sampled again in 201It is absolutely vital that you sample the same section of stream that was previously sampled.Your data is not useful if it is not collected from the same location!What is a BR or TR?Bottom of Reach (BR)is the starting point / downstream boundaryfor collecting dataTop of Reach (TR)is the ending point / upstream boundaryfor collecting dataNOTE: Your BR R will be in the same precise BR/ TRlocation of previoussample(s)ObjectiveDeterminethe precise location of and TRet up your reach using one of the 2procedures below.Scouted or unscouted OLD SITEScouted NEWSITEBefore setting up your reach, locate the following as a crew:Bankfull elevationpage Where streambed and streambankmeet page Scour linepage It is unlikely, but you may encounter:Beaver activity within siteSee Appendix Bpg . High water.If the water is above the scour line(pg , call before you sample. Stream flows through a different channel. Carefully read about ‘channel shiftin the Disturbance section(pg 19). Site is on private land. Do not sampleif you are sure it is on private land, call hotline. If you cannot call, go to next site, and call. 6 At

14 the first reach each hitch you must cre
the first reach each hitch you must create a dataset in the logger. Turn on the handheld device.Load DPP: Once the device boots, double click on the icon for DataPlusCE.DPP Option: Click on the Word Data with your stylus. Choose to Collect Data, and press enter.Dataset: Now you are asked to choose between an Old or New Dataset. Select New Dataset for thefirst reach of each hitch. Use the same dataset throughouteach hitch. Dataset names consist of 4 characters and should follow the same format: 2 character CrewCode + 2 character Hitch CodeMonth + 2 character Day. For example: M1H1Once a particular dataset is selected, the logger takes you to the first reach in that set, at which time you are ready to enter data. Note: If you don’t enter a reach (reach ID, Group, Order, Type, etc… ) when you first create the new dataset the dataset will not be saved and you will have to start again by recreating the datasetlater. 7 OLD SITE:Setting Up Your Reachemember: it is absolutely vital that you sample the same section of stream that was previously sampledour data is not useful if it is not collected fromthe same location!mportantet up transectas quickly as

15 possible when arriving at a reach. The
possible when arriving at a reach. The vegetation technician cannot begin working until you do so.OLD SITEShaveeen sampled beforehotographs from a prior sample‘Site Information Sheet’ with UTM coordinates for BR, BR marker, marker& Reach overviewite marker informationScouted OLD SITESWere visited by a scout earlier in the field seasonHave orange flagging labeled ‘PIBO BR / PIBO TRat or near the BR and TRHave a ‘Site Revisit’ form with specific information about where to precisely establish BR and TRin relation to flaggingUnscouted OLD SITESDon’t have orange flagging at BR / TRHave a blank ‘Site Revisit’ form that you fill outThe only real difference between a scouted and unscouted site is that there is flagging hung at the BR and TR witch the crew confirms is in the correct location. Navigate to the siteusingall available information:riving and hiking directionsUTM coordinatesPhotosTopographic mapeach map 8 Determine the precise location of the BRIf site was scouted:efully read the ‘Site Revisit Formto determine where the BR is relative to the BR flagging.Be careful not to confuse BR and TR flagging, they will be l

16 abeled ‘PIBO BR’ and ‘PIB
abeled ‘PIBO BR’ and ‘PIBO TR’ respectively. Question: the ‘Site Revisit Formindicates that flagging was hung, but I cannot find it. What do I do? Answer: confirm with 100% certainty that you correctly navigated to the otosare best for doing this. Site was not scouted:Take your time and carefully pinpoint the precise BR location;be diligent, careful, and detailed.Photos are the best piece of informationAlso use: site marker, UTMs, reach map, hiking directionsMark BR with a cluster of multicolored flags on both banksPlace flagsperpendicular to channel (NOT thalweg)You do not collect data at BR!4. Use the ‘width category’ on ‘Site Information Sheet’ to establish transect 1Identify where the thalweg crosses the BR. Technician 1 holds the ‘dumb end’ of the measuring tape there.Technician 2 will measure upstream, along the thalweg, a distance equal to the width category.Establish transect 1 by placinga flag on each bank, perpendicular to the channel (not the thalweg)Before moving to step technician:Collect macroinvertebrate(don’t walk where you’ll collect bugs!)see ‘Macroinvertebratestechnicianegi

17 n filling out forms 1,2, and 4Take RchID
n filling out forms 1,2, and 4Take RchIDDate, and BRphotosee ‘Photos’ pg With Veg TechValidate BR markerinfo see ‘Site Markers’ pg Record BR UTMs see ‘UTM Coordinates’ pg 9 NOTE:Setting up your reach is a 2person job.Usingthe same procedure, place additional transects moving upstream.Identify where the thalweg crosses transect 1. Technician 1 holds the‘dumb end’ of the measuring tape there.Technician 2 will measure upstream, along the thalweg, a distance equal to the width category.Placea flag on each bank, perpendicular to the channel (not the thalweg). Place additional transectmoving upstream until you reach the Using the same procedure, continue placing transectpstream until you reach the TR. Question: what if I encounter side channels? Answersee ‘ide hannels’ Determine precise location of Scoutedsitelocate TR relative to laggingCarefully read the ‘Site Revisit’ form to determine where the TR is relative to the TR flagging.Your last transect is the last one that will fit before you pass upstream of the TR. The distance upstream from youlast transect to the TR will be less than the width cate

18 gory.Unscoutedsitelocate TRYour last tra
gory.Unscoutedsitelocate TRYour last transect is the last one that will fit before you pass upstream of the TR. The distance upstream from youlast transect to the TR will be less than the width category.TR photos are your best piece of info for locating the TR;amiliarize yourself with theso that you have a good idea of what it looks like. Other helpful pieces of information:TR site marker infoTR UTMs(use ‘go to’ function of GPS)Reach map. Mark your R with a cluster of multicolored flags on both Place flags perpendicular to channel (NOT thalweg) 10 . Calculate reach lengthusing the formula on Form 1The reach length is distance from BR to TR measured along the thalwegRecord the data on Form 1and in the data logger. Question: What if my reach length is different that the old one? Answer: That is OK. Reach length is measured along the thalweg, whichchanges due to water level, channel shifts, creation of oxbows, etc. What’s next?While you’re at the TR:Water chemistrysee ‘Water Chemistry’ Take photossee ‘Photos’ Validate TR marker info see ‘Site Marker’ pg WithVeg TechRecord TR UTMs see ‘UTM Coordinates

19 6; pg Record TR Marker UTMs see ‘Si
6; pg Record TR Marker UTMs see ‘Site Marker’ pg Update any ‘Sitearkerinformation pg 11 NEW SITE:Setting Up Your ReachIMPORTANT:et up transect1 as quickly as possible when arriving at a reach. The vegetation technician cannot begin working until you do so.NEW SITEhaveever been sampledeen visited by a scout earlier in the field seasonOrange flagging hanging at / near the BR‘Site Information Sheet’ with BR UTMsDo not have BR / TR site markersNavigate to the siteusing the following information:Driving directionsHiking directionsUTM coordinates (BR and Temp Probe)Locate the orange flagging hung at the BR Question: I cannot find the flagging, what do I do? Answeravigate to the site using all available information. Remember to e Probe information. There are UTMs and a map showing BR. Determine the precise location of your BR relative to the scout’s flaggingCarefully read the ‘Site Information Sheetand follow the scout’s instructions for placing theBR relative to the BR flaggingIf the scout did not write specific instructions:BR will be a pool tail within 10mUS / DS of flaggingIf there isn’t a pool tail 10m US / DS of

20 flagging, the BR will be in line with t
flagging, the BR will be in line with the BR flagging Questionhat if the pooltail identified by the scout doesn’t meet pool criteria? Answerstablish the BR at a qualifying pool tail US / DS from flagging, if there isn’t one, start at flagged location 12 Mark BR with a cluster of multicolored flags on both banksPlace flags perpendicular to channel (NOT thalweg)You do not collect data at BR!Use the ‘width category’ on ‘Site Information Sheet’ to establish transect 1Identify where the thalweg crosses the BR. Technician 1 holds the ‘dumb end’ of the measuring tape there.Technician 2 will measure upstream, along the thalweg, a distance equal to the width category.Establish transect 1 by placing a flag on each bank, erpendicular to the channel (not the thalweg).Before moving to step 6technician:Collect macroinvertebrates (don’t walk where you’ll collect bugs!)see ‘Macroinvertebrates’ pg technicianBegin filling out forms 1,2, and 4Take RchID / Date photoand BR photossee ‘Photos’ pgWith Veg TechPlace BR marker and record marker information see ‘Site Markers’ Record BR and BR marker

21 UTMs see ‘UTM Coordinates’ NOT
UTMs see ‘UTM Coordinates’ NOTE:Setting up your reach is a 2person job.6. Using the same procedure place additional transects moving upstream.Identify where the thalweg crosses transect 1. Technician 1 holds the ‘dumb end’ of the measuring tape there.Technician 2 will measure upstream, along the thalweg, a distance equal to the width category.Placea flag on each bank, perpendicular to the channel (not the thalweg) Questionhat if I encounter side channels? Answeree ‘Side Channels’ pg 13 Establish TR, you will have 25 transects.Your TR will be located at the first pool tail upstream of transect 21;If the pool tail falls on a transectabove 21then you must collect data at that transect.If the pool tail does not fall on a transect no data is collected at the TR.f no pool tail is found US of 21 yourTR will be at transect . In thscenario where no pool tail is found US of 21 you willcollect data at the 25transect. If the stream is dry, stop at transect 25and collect data at the transect.. Mark TR with a cluster of multicolored flags on both banksPlace flags perpendicular to channel (NOT thalweg). Calculate reach length using the formu

22 la on Form 1The reach length is distance
la on Form 1The reach length is distance from BR to TR measured along the thalweg.Record the data on Form 1and in the data logger.. What’s next? While you’re at the TR:Place TR marker and record marker informationsee ‘Site Markers’ pg Record TR and TR marker UTMssee ‘UTM Coordinates’ Meaure water chemistry see ‘Water Chemistry’ pg Take TR photossee ‘Photos’ pg 14 SIDE CHANNELSIn this section you will find informationabout how to place transectsand what data to collect whenyou encounter side channelsSide ChannelsThe main channel (MC) has the most volume of water flowing through it; additional channels are referred to as side channels.A side channel (SC) is any channel separated directly from the main channel by an islandbar with an elevation above bankfull(A Figure Channels that are separated from the main channel by islands bankfull elevation are considered partof the main channel (E Figure Place flags in all side channels that have flowing water through their entire courseFigure Do not sample in tributaries (FFigure Dry Side ChannelsThe following criteria must be met in order for a nonflowing side channel (wa

23 ter is not flowing through entire channe
ter is not flowing through entire channel) to be included in yoursurvey: Include it ifthe side channel is a continuous feature whose thalweg is bankfull of the main channel (D Figure ). Determine the thalweg location by envisioning where water would flow through the side channel. Don’t include it ifat any location (normally at the upstream end) the side channel’s thalweg is ≥bankfull elevation (B & C Figure ), unless at that transect the island is below bankfull; then the flag will be placed on the outside bank of the side channel (transect 12 inFigure Data Collected in Qualifying Side ChannelsRecord the widths of side channels duringbankfull widthsInclude side channels in cross sections, use the BF method Measure win side channelsMeasure pebblesMeasure streambank measurements Data not collected in QualifyingSide ChannelsPools and Habitat Units 15 Figure ransect placement when side channels are encountered.Place transects across all flowing channels (A & E), nd across nonflowing side channels that are entirelybelow bankfull elevation (D).DO NOT place transects across side channels whose thalwegs are at any point ≥bankfull elevation (B & C), nles

24 sat that transect the island is below ba
sat that transect the island is below bankfull; then the flag will be placed on the outside bank of the side channel (RL transect 12). T10T11T12T13T14T15T16 Tributary Bankfull Bankfull Water TransectTransect flag Thalweg BCDAEF T10T11T12T13T14T15T16 Tributary Bankfull Bankfull Water TransectTransect flag Thalweg BCDAEF 16 UTM COORDINATESObjective:Use theVEG PDAs to record the Universal Transverse Mercator (UTM) coordinatesUTMs are used toidentify these ocationsBR markerTR markerReach overview photoTemperature probe(collect if crew is placing, if not the scout has done this already)The temp probe UTMs are collected with the handheld GPS. When to record UTMs?Record UTMs at all reachesin the Veg PDAecord the location of a temperature probeon the instrument formif you are askedto place itUse the handheld GPS to collect this UTM.Appendix : Placing a Temp ProbeProcedure:Collecting UTMs with the Archer (Veg) PDAFrom the main screen (press the home button, bottom left with a house icon) click the start menu (top left corner, or windows button); select “GPS info” from the drop down menu. GPS info is a program with two tabs (which show at the bottom): S

25 etup and GPS infoIn the setup tab, selec
etup and GPS infoIn the setup tab, select “start GPS” and lots of numbers and codes should show up in the main screen. This is continuous you don’t have to let it “load”.In the GPS info tab you can see if you have a signal by looking at the Lat: and Long: readings. If those coordinates are blank, you might be indoors or without coverage. Blue circles and blue bars equal good satellite connections.Once you have a signal, go back to the “Setup” tab and select “Close GPS” (You can close the “GPS info” program at this point) 17 From the main screen (press the home button, bottom left with a house icon) click the start menu go to “Forms 5.1” This will open Pendragon Forms and give a menu. Highlight Reach and select “New” or “Review” if you have already started the reach in the PDA. If you have a veg tech sampling with you the Reach information should be filled out by them. If you are sampling a stream without a veg tech enter the following:In the Reach information click on one of the two page ons next to Data collection. Highlight “UTMs”.Click “Add” to c

26 ollect a new UTM. Select a location fro
ollect a new UTM. Select a location from the list to review a UTM. On the resulting page hit “Lookup…” and select the UTM reading you are recording (ex. Bottom of Reach).If you collect information for a marker and the marker information; (bearing, distance, and description) has changed or are new you must type them in. If the current information is correct you can leave these three fields blank. You still must collect UTMs hit “Next” DateAutomaticVeg TechnicianEnter "X Tech"Stream nameEnter from site info formReach IDEnter from site info formGroupEnter from site info formOrderEnter from site info formReach TypeEnter from site info formCrewEnter from site info formVeg XS angleEnter 0Valley widthEnter "50 m"Flags set up by stream techsEnter "Yes, stream techs set up…"2 PDAs, or 2nd CardEnter "No"2nd Veg TechnicianLeave BlankCommentEnter a comment if needed 18 collect UTMs hit “Acquire” and wait for some coordinates to show, this may take a few seconds and display Time out and Errors be patient and wait at least 1 minute. When Hdop is 10 select “Fix”. It is important that you don not walk around between hit

27 ting “Acquire” and “Fix&#
ting “Acquire” and “Fix”.To solve Error codes lasting over 1 minute see Troubleshooting below.If you “Fix” the UTMs in the wrong spot:You can go back one page in the program to before the acquire page and proceed from there. The Hdop number will usually change if you collect in a different location.The other option is to go to review and work through the UTM you want to change from the starting menu.Now select “End” or “Next” This will return you to the UTMs subform.To record another coordinate, begin again on step six; If the PDA was shut down start at the first step. (You do not have to turn off the GPS info program in between collecting UTMs to save battery life. This program has a very minimal power drain.)Whenyou are done with the stream hold the power button down and select Power Off to turn off the PDA.Troubleshooting:Error (0301): This means the GPS is not turned on. To solve start the GPS see step 1 and continue from there.Error (0302): This means theGPS is collecting data in the “GPS info” program. To solve Close the GPS see step 5 and continue from there.Primary Key Conflict: This means tha

28 t you have attempted to entered a unique
t you have attempted to entered a unique location more than once such as 2 BR Markers. 19 RECORD DISTURBANCEObjective:Record disturbanceForm 1and in the logger Disturbance Evidence of Beaver Low Medium High Y * = evidence of beaver, but no dams within reach Grazing % Low Medium High Cows Present in reach N Y Channel Shift: one of the two lengths must be ≥15m Length of old main channel that is now abandoned: ________m Length of new main channel: _____________m Figure Depiction of where to assess disturbanceand excerpt from Form 1Area of consideration is between the BR and TR, and extends 10m from the stream channel(blue line)on both banks. In this example you would assess all disturbances within the dotted shape.Record disturbances found within the area depicted above.Beaver:N = no beaver dams within reach, and no evidence of beavers within the reach, 10m from stream channel on either bank Y*= evidence of beaver within the area in Figure 3no dams alter the flowLow about 1040% of the area in Figure 3is impacted by beaver i.e. dams, pools, beaver glides. Medium

29 about 4060 % of area in Figure 3is impa
about 4060 % of area in Figure 3is impacted by beaver Highabout 60100% of area in Figure 3is impacted by impactedby beaver Always draw a reach map if your site is impacted by beaversSee Appendix B for sampling instructions at beaver sites 20 GrazingN= No evidence of grazingIndicators include: trampling (evidence of hoof prints), trailing, grazed vegetation, cow pies, etc.Low about 1040 % of the area in Figure 3 shows evidence of grazing livestock Medium about 4060 % of the area in Figure 3 shows evidence of grazing livestockHigh about 60100 % of the area in Figure 3 shows evidence of grazing livestockCowsPresent: = there are cow in the reach orclose to the reach, meaning they have access to the reachImplyingthat cowsare around and there isbarrierpreventing the cows moving into the reachN = There are no cows in the reach Other disturbances?If you see other disturbances within the area depicted above, make a comment in the logger and on Form 1Examples include: Fire, Mining, Timber Harvest, other?Channel Shift:ompared with past visits, has the main channel has shifted?If a main channel shift has occurredis ≥, measureand record the following on Form 1 and in t

30 he loggerLength of the old main channel
he loggerLength of the old main channel that is now abandoned(80m in Figure Length of the new main channel(50m in Figure Continued on following page. 21 Visit 1: BR looking USVisit 2Figure The main channel has shifted and the BR is in a dry channel.If your site has a channel shift ≥15m:Record channel shift on Form 1 and in logger, AND make a detailed commentDraw a new map. Label ‘new / old main channel’PhotosRepeat any photos in old main channelTake new misc stream photos in the new main channTake new misc stream photos of where new and old main channels meet (starred location in Figure 5Take new misc. stream photos showing the change 22 Figure Since 2006, the main channel has shifted and the old BR is now in a drychannel.Move BR to new main channel, perpendicular to valley. Take new misc. stream photos of where the old and new main channels split(starred location). Repeat any photos in the old mainchannel, and take new ones of the new main channel.If BR / TR are no longer in a main channel:Move BR / TR (perpendicular to the valley) into the new main channelLook for a pool tail within 5m of the perpendicular location Move BR / TR marker and

31 update information on Form 1 and in the
update information on Form 1 and in the Veg PDARip out old site marker that is not in useRecord new UTMs (BR, BR marker, TR, TR marker)Repeat photos of BR / TRand label them ‘OLD BR / TR’Take new BR / TR photos uestionDo I sample the old main channel nswerIf it is a qualifying channel see ‘Side Channels’ pg 14 23 RECORDING STREAMFLOWStream Flow(circle one) Flow (whole reach) No flow (completely dry) Other (make detailed comment) Ex: trickle of flowing water transects 1 7, water in pools transect 8 - 17, rest reach dry Figure Excerpt from Form 1showing flow categoriesand an example of a detailed comment.Objective:describe flow conditions throughout your reach. After you have walked the entirereach, circle the appropriate flow category: Flow (whole reach):there is continuous flow of water throughout the entire reach No flow (completely dry):there is no water within your reachit is ‘bone dry’ Other (make detailed comment):this can describe a wide variety of flow conditions, so please write a thorough, detailed comment on Form 1and in the logger. Examples of flow comments: No flowing water within reach, but there i

32 s water in poolsFlow whole reach, but it
s water in poolsFlow whole reach, but it is just a trickleTrickle of flowing water transect 17, water in pools transects 8 17, restof the reach is dry”If the flow at your reach is ‘no flow’ or ‘other’consult‘Appendix C: Sampling When There Isn’t Flowing Water throughout the Site’pg for additional sampling instructions 24 SITE MARKERSBackground:Bottom of reach (BR) and top of reach (TR) markers are used to monument the site location and determine where to start and stop sampling. Nearly all of the sites you sample will already have BR and TR arkers placedWilderness: Site markers will not beplaced in designated wilderness areas. Rather, a distinctive feature (largespanner, snag, rock or tree) near the BR and TR will be used to monument the site in wilderness areas.Some sites have markers, some don’t:Old Sites have should have and TRmarkers, BUT some may be missing (the tree it was on fell over, the wire attaching it broke, etc)New sites have no markersObjectiveWe want to have 1 marker at the BR and 1 marker at the TR. Determine if yousite has markers at the BR andTR.If rker(s) were placed, validate them, if there i

33 sn’t a marker at the BR and / or TR
sn’t a marker at the BR and / or TR, place it.Validate OLD BR / TR MarkersLocate OLD markerHave the Veg Tech collect UTM at BR/TR markerin the Veg PDAValidate marker information.We want to maintain the OLDEST marker info, because we always want to go back to the original R / TR. CORRECT the following information, DO NOT UPDATE IT.Descriptionoes it accurately describe markerlocation, if not update it.Bearing does the old compass bearing seem reasonable, or was the crew off by 180°?Distance was the old distance reasonable?If making changes to these record the changes on Form 1 and have the Veg tech enter the new marker information into the Veg PDAReplace the marker if you don’t think it will last another 5 years. 25 Always take a new photo of the marker. The purpose of this photo is to help you quickly locate the marker. Always strive to take a better photo. Take thephoto from a new location if the old locationis unsuitable (zoomed in too much, poor angle, can’t see BR in picture, etc). Recording marker dataIf you update any marker info:Circle ‘Y’ in the ‘Marker Info / Info Collected’ column on the back of Form 1Write mark

34 er info on the front of Form 1Havethe Ve
er info on the front of Form 1Havethe Veg Tech update the Marker information in their PDA. If you didn’t update marker info circle ‘N’ in the ‘Info Collected’ column on the back of Form 1and don’t recorded anything in the Veg PDA. QuestionWhat if the marker is gone? Answer: Confirm that you are 100% in the correct spot and that the marker is gone, then follow the‘Placing new BR / TR marker’ procedure. Question: “What if a wilderness site has markers? Should I take them out Answer: Yes, take them out. Select a distinctive featureto use as a surrogate. Record new marker info on Form 1and circle ‘Y’ in the ‘Marker Info / Info Collected’ column on the back of Form 1. 26 lacing new BR / TRmarkersLocate an easily identifiable feature near the BR / TR to attach the markerTry to place the maker parallel to the BR/TR. Use something relatively permanentlike a tree nearthe / TR Use something distinctivFor example a lone cottonwood tree near the BR, or a large stump with a burn mark. Make sure the BR marker has ‘PIBOBR’ indented into itand the TR marker has ‘PIBOTR’ inden

35 ted intoit.Attach the markerto your chos
ted intoit.Attach the markerto your chosen spotswith a nail orwireRecord the following information Form 1 rief description of the site marker location(eg. US of BR 5m on RL attached to trunk of large juniper). Compassbearingfrom the BR marker to the BR and from the TR marker to the TR Measure thedistancefrom the marker to the thalweg at BR and TR Make sure your Veg tech records UTM coordinates of the site markers location in their PDAGive Form 1 to the Veg tech to enter the description, bearing, and distance into the Veg PDARemember, if you are replacing markers atan OLD site, we want thedirections to point ofthe original BR / TR! 27 MACROINVERTEBRATEObjectiveDescribe the composition and health of the macroinvertebrate community.If there is an aquatic invasive in the samplecollectan additional sample of the invasiveseeAppendix F: Aquatic Invasive Protocolor specific instructions on creating a label and the scriptions of invasive species. Special situations: Yes, ollect macroinvertebrates (bugsin sites with beaver dams, see Appendix B: Sampling Sites with Beaver Activity’ simply stated we want bugs collected DS from dams Yes, collect bugs in sites with

36 partial flow. The rule is, if there is
partial flow. The rule is, if there is enough water in any part of the reach to move bugs into the net, collect them in those areassee Appendix C: Sampling When There Isn’t Flowing Water throughout the Site’ Sampling Overview Collect bugs from the first riffle / runs(fastwater habitat) upstream from your BR. Collect bugs at 2 locations in within each riffle / runs,for a total of 8 samples Determine each bug net placement using random numbers.Generate pairs of random numbers 9 on the data logger.The first number in each pair (multiplied by 10) represents the percent upstream along the habitat unit’s length.The second number in each pair represents the percent of the stream’s width from riverleft (RL) looking downstream.Repeat this process to locate the second sampling location.Take samples where the length and width distanceintersect (estimate by eye).If it is not possible to collect bugs at one ofthese locations (log in the way, too deep, cannot seal bottom of net, etc.), generate an additional set of random numbers and sample the new location.NOTE: If no fastwater habitats occur, take the samples from shallow, slowwater habitat units. 28

37 How to collect bugs at each net place
How to collect bugs at each net placementCollect samples using a Fixed Area Design (0.72 m) 500 mesh netfrom fast water habitatsPlace the kick net so the mouth if acing into the flow of water. If there is no detectable flow, orient the net to most easily facilitate washing benthic material into the netCollect invertebrates from within the sampling frame in front of the net.Work from the upstream edge of the sampling plot backward and carefully pick up and rub stones directly in front of the net to remove attached organisms.Quickly inspect each stoneto make sure you have dislodged everything and then set it aside. If a rock is lodged in the stream bottom, rub it a few times concentrating on any cracks or indentations.After removing all large stones, disturb small substrates (i.e. sand or gravel) toa depth of about 10 cm by rakingand stirring with your hands.Continue this process until you can see no additional organisms or organic matter being washed into the net.After completing the sample, hold the net vertically (cup down!) and rinse materiinto the bottom of the cup.If a substantial amount of material is in the net, empty the net into the 14liter bucket for

38 processing before continuing to the next
processing before continuing to the next sample location. Otherwise, move to the next sample location and repeat the above procedureto create a composite sample. Field processing requires a 14liter bucket, a white plastic washtub, and a 500 m sieve. Use the bucket to decant organisms from inorganic substrates into the sieve. Use the washtub to transfer stream water into the bucket and then to visually inspect inorganic residue for heavy organisms that were not decanted.Continue this process until all 8 samples have been collected and placed in the bucket. Make sure you thoroughly wash organisms from the net by vigorously pouring water down the net and into the cup. If the net has a cup at the end, remove the cup over the top of the bucket and wash it out.Remove and release all vertebrates, including fishamphibians. 29 Collect allaquatic invasive in a separate jar. See the species of interest and collection protocol on pg Add water to the bucket and decant invertebrates and organic matter from the sample by stirring the contents of the bucket and then pouring suspended material through the 500µm sieve. Repeat this process until no additional material can

39 be decanted. Transfer the material in
be decanted. Transfer the material in the sieve (invertebrates and organic matter) into the 2liter sample jar with a small spoon and then wash any remaining material in the sieve into the jar with a squirt bottle. Place the inorganic residue remaining in the bucket into the plastic washtub and cover with water to a depth of 1 cm. Inspect the gravel on the bottom of e tub for any cased caddis flies or other organisms that might remain. Remove any remaining organisms by hand and place in the sample jar.Once all samples have been processed, fill the jars with 95% EtOH. Immediately label the jars inside and outside. Preserve this composite sample in 1 or more sample jars depending on the amount of material collected. If there are multiple jars, label them as 1 of 2 and 2 of 2, etc. and then tape them together.Record the number of bug jars on Form 1and in the data gger.Figure Example of macroinvertebrate label. Reach ID: Jar # Stream Name:Big Ramey Cr Date:06/15/05 30 WATER CHEMISTRYConductivityMeasure conductivity once at the TR using ahand held conductivity meter.Measure the first time you are at the TR. Don’t take samples where channel sedi

40 ment has been disturbed, i.e. don’t
ment has been disturbed, i.e. don’t measure water chemistry where you’ve walked.Take the reading in flowing water, near the center of the channel, and record on Form 1and in the data logger. Recalibrate the conductivity meter at the beginning ofeach 8day sampling period.Special situations: Partial flow: measure water chemistryin sites with partial flow. The rule is, if there is anywater in any part of the reachmeasure it. Describe flow conditions on Form 1and in logger. Beaver: measure water chemistry at the bottom of the reach not the top of reach. If there is a beaver dam / pool at BR, measure water chemistry below the dam / pool even if it is downstream from the reach. 31 PhotosBackground:Photos are important for relocating sites detecting change through time. They are included annual reports and presentations, and used by others outside of our program. Photos are one of the easier tasks that you will perform, please relax, take your time and take quality photos.General photo do’s and dont’ Do not take photos displaying unprofessional behavior. You must be wearing a shirt and bootsshoes no sandalsif you are in a photo o not zo

41 omat all. Avoid takingphotos looking int
omat all. Avoid takingphotos looking into the sun, take photos with the sun at your back.ry to avoid takingphotographs where part of the frame is in the shadows and part in the sun.Hold the camera 1.5 meters from the ground (use a depth rod as a guide).A depth rod should be in the following photos: R, misc. streamIf your camera is broken or lost, se apersonal camera if one is available, and download photos with supervisor at the end of the hitchecording details about each photoon Form 4 and in the data loggerNOTE: Don’t fill in grayed out boxes on Form 4 or equivalent info in the logger hoto Numberecord the number in the display screen on the back of the cameraafter you take the photo. Description: select appropriate description on Form 4 and in logger. Rod Locationrod should be in BR, TR, and misc. stream photos StreambankRecord whether the rod is on River Right (RR) or River Left (RL).Transect Number (misc. stream only) List the number of the closest stream transect to the depth rod.Direction from Transect Circle whether the depth rod is upstream or downstream ofthe transect. 32 Distance Measure the distance from the rod to the transect. Camera Loc

42 ation Camera Facing Circle whether the c
ation Camera Facing Circle whether the camera is facing upstream (US), downstream (DS).Distance to Rod Distance from camera to depth rod. Bearing to Rod Use acompass and record the bearing from the photo point to the depth rod.NOTE:Record reach overviewUTMswith the Veg tech in the Veg PDA Reach IDDatePhoto Always take this photo first. Remainingphotos can be taken in any order. Include stream name, reach name (group order site type crew code year), reach ID(four digit # given on the site info sheet), and date using the format below.BR & TR Marker PhotosTakethese photos at every siteThe purpose is to help you locate the marker.Always strive totake the best photo possible (don’t repeat an old photo unless it is from the best location)Don’tzoom in too close (see example below)he photo should include the marker and the BR (see examplebelow) Elk Creek 123–07–I–M2–07 5144 June 11, 2007 33 Above are bad reach marker photo. Imagine you are sampling the reach in the photograph on the left. Doesthis marker photo help you locate which willow the marker is attached to? No, it is zoomed in too closely.There are 2 differ

43 ent scenarios for shooting BR, TR, Misc.
ent scenarios for shooting BR, TR, Misc. Stream, and Reach Overview photos1. Duplicating photos from OLD SITES, and2. Taking photos atNEW SITEwhich havenot been sampled.Photos at OLD SITESObjective:uplicate BR, TR, misc. stream,beaver photosand reachoverview photos as closely as possibleTake more photostream changedOld photos do not depict the entire reachou think you can take a better photo that will be easier to repeat in 5 years.Repeating BR,, Misc. Stream, and Reach OverviewhotosYour primary goal is to duplicate old photos as closely as possibleExamples of good repeat photos are on the coverOld photos will be provided when you sample an old site.Use an old photo’s description telp locate where it was taken.Beware that many old photo descriptions have errors.Your transects won’t necessarily be in the same location as past samples 34 After relocating where the old photowas taken from, visualcompare the old photo with what you are seeing through the camera’s viewfinder.Pay particular attention to the corners of the old photo, does your photo have the same features in each corner?Does your photo look like it is too close or too far away? If so

44 move.Is the horizon the same? For examp
move.Is the horizon the same? For example, is the meadow behind the stream towards the top of the old photo, but near the middle of yours? If so make the necessary adjustments.Once you take the new photo, compare it to the old version. If they don’t match, shoot it again.Repeatinghotos, Special Circumstances NOTE about 200photos: You may be given BR / TR fromthese pictures were taken standing on the BRnot standing back looking at the BRDo not repeat TR photos. Take new photos standing at least meters back from BR / TR (as far back as necessary to include both banks) Channel shifts (read Recording Disturbancefor more details)Repeat any photos in old main channel, even if it is dryTake new misc stream photos in the new main channelTake new misc stream photos of where new and old main channels meet (starred location inFigure Take new misc. stream photos showing the changeIf BR / TR are no longer in main channel:Repeat photos of BR / TRand label them ‘OLD BRTR’Take new BR / TR photosBeaver sites read ppendix B 35 Poor repeat photos. When repeatingphotos use both foreground and background indicators to match the original.The horizon matches in t

45 hese photos, but the left photo was take
hese photos, but the left photo was taken from the middle of the stream while the right photo was taken near the RR bank. Notice how the large conifer isnot framed in the photo on the right?and that the mountain is not in the same position?Take a new photo, rather than repeating the old one if:You are instructed not to repeat itOLD photo is missingOLDphoto is horriblyout of focusOLD photo was taken from incorrect / unsuitable location There should be a minimum of 5 miscstream photos/ reach. Take additional misc stream photos if there are less than 5, make sure to repeatof the stream channel (include both banks) that are epresentative of the sitereas that you think may show change through timeAreas of the reach that are not included in other photosTaking additional photos if:Streamchanged dramatically, or something ‘weird’ is going on (burned, partial flow, much more / less LW, heavily grazed, etc.)If yousite is really brushy, attempt to take additional photos inless brushy locations. 36 Photos atNew SitesTake photos of the following at each reach. Reach IDDate:Take this photo first. Write the stream name, grouporder,reach type, date, and crew on t

46 he back of Form usinga marker. Site ma
he back of Form usinga marker. Site marker location (BR and TR):Take the photographs looking towards the reach with the marker in the foreground. Have a second person pointing at the marker. If in a wilderness area do not place a marker, instead choose a good distinctive feature to use as the marker and take a photo of it with someone pointing at it. Reach overview: Should be taken from a location where the greatest extent of the reach can be observed. hillside overlooking the reach is ideal.Sometimes this is a hard shot, try your best.Record UTMs with the Veg tech in the Veg PDA The bottom and top of the reach:Take a photograph looking both upstream and downstream. Stand parallel to the channel at a distance of5 meters(unless you cannot see both banks, if you cannot, move further back) Misc. Stream:Take a minimum of 5misc. stream photos Your goal is to take photos of the stream channel (include both banks) that are either: epresentative of the sitereasthat you think may show change through timeSome points to remember when taking photos at new sites:Make sure you include both banks in the photo. For smaller streams stand back from the object of interest at le

47 ast meters. For larger streams (�
ast meters. For larger streams (�8 meters wide) stand back 10 meters or more to assure you can see both banks.Try and disperse your misc. stream photos throughout the sample reach, this will lead to a better documented reach. 37 HABITAT UNITS: POOLSvs. RIFFLE / RUNSObjectiveClassify habitat units within reach as poolsor rifflerunsPools:Classify formation as: scour, dam, plunge, or beaverClassify as either ‘full’ channel pool or a ‘partial’ channel Locate the ‘head’ and ‘tail’ of each pool and mark with blue flagsMeasure:Pool length, along the thalwegPool tail depthMaximum depthCount the number of pieces of wood within the poolppendix describeshow to quantify beaver poolsRiffle / RunsClassify formation as: rifle Measure the length Count the number of pieces of wood within the riffle / runIs it a poolr a riffle / run?If it is a pool, what is the formation?Pools are depressions in the streambed that are concave in profile, laterally and longitudinally.Pools are boundby a headcrest (upstream break in streambed slope) and a tailcrest (downstream break in streambed slope).Maximum pool depth is at least 1.5 times the poo

48 l tail depth.Pools span at least 50% of
l tail depth.Pools span at least 50% of the wetted channel width at any location within the pool. So a pool that spans 50% of the wetted channel width at one point, but spans 50% elsewhere is a qualifying pool.Only consider main channel pools where the thalweg runs through the pool, and not backwater pools.Side channelsWhen islands are presentonly consider pools in the main channel; don’t measure pools in side channels.If a side channel is present, the pool must span at least 50% of the mainchannel’s wetted width; disregard side channels width when making this determination. 38 If all criteria were not met, it is a Riffle / Run, not a pool.criteriawere metuse this keyIf a beaver dam is slowing down and backing up water go to Appendix page Pool length (measured along thalweg, is greater than the s width(measured perpendicular to thalweg, at the pool’s widest point.No, length width. Proceedto 3Yes, lengt�h width. Proceed to 2 Is the pool tail a wood obstruction? And is allwater flowing over this obstruction? With no flowing under or beside it? Yes, formation = dam pool No, formation = scour pool Thalweg drops vertically over an obstructi

49 on (log, boulder, etc) at the pool’
on (log, boulder, etc) at the pool’s head crest. No = not a pool, classify as Riffle / Run Yes. The max depth must be within a specified distance of the obstruction. This distance is 20% or less of the ’s length. Example: if the potential plunge pool is 10m long, then itsmax depth must be 2m or less from the obstruction. Yes, formation = plunge pool No, not a pool, classify as Riffle / RunDetermine if pool is ‘full’ or ‘partial’ channel pool Fullchannel poolConcave shape of the pool (measured perpendicular to the thalweg) at any location is� 90% of the wetted channel width. Partialchannel poolConcave shape of the pool (measured perpendicular to the thalweg) at any location is between 50 and 90% of thewetted channel width. 39 Figure Top and side views of scour and dam pools. Max depth (A), length (B), width (C), tail crest (D) and head crest (E) are labeled.How to measure pool dimensions Length Measure along thalwegMeasure between the head and tail crestsMeasureto the nearest 0.1m Pooltail depth Measured at the maximum depth along the pool tail crest, normally but not always the thalwegMeasure to the nearest cmTo find t

50 his point, imagine that the water in the
his point, imagine that the water in the stream is ‘turned off’. You want to measure the depth of the last spot that would have flowing water before the stream stopped flowing. Maximum depth This is the deepest point in the poolLocate it by probing the pool with a depth rodEstimate maximum depthif it is unsafe to measurecomment that these are estimates if doing this) SIDE VIEWTOP VIEWSCOUR POOLDAM POOLRIFFLERIFFLERIFFLE SIDE VIEWTOP VIEWSCOUR POOLDAM POOLRIFFLERIFFLERIFFLE 40 Riffle / Runs: Data to collect:Measure length along thalwegCount the number of pieces of large wood within each riffle / run.COUNTING LARGE WOOD IN POOLS AND RIFFLE / RUNSPoolsOnly count qualifying pieces of large wood (see arge ectionThere must be ≥1m of the piece within the concave shape of the pool,ieces besidepools (not within the concave shape) do not count!If a piece is in both a riffle and ≥1m is in the concave shape of the pool, include it in the total for both habitat units.Riffle / RunsAll qualifying pieces count, no size requirements.If a piece is in both a riffle and ≥1m is in the concave shape of t

51 he pool, include it in the total for bot
he pool, include it in the total for both habitat units.Select the number of pieces from the dropdown menu in the logger(the logger changes the ranges for larger number of pieces into the average number; thus 1115 will read as 13) 41 # Fill out for Pools & Riffle/Runs Fill out for Pools only Habitat Unit (Pool or Riffle/Run) Length (m) # pieces of LW a Formation (scour, dam, plunge, beaver) Full or Partial Max Depth (cm) Pool tail depth (cm) b 1 P R 5 0 S D P BF P 55 7 2 P R 30 1 S D P B F P 3 P R 15 1 S D P B F P 65 8 4 P R 60 2 S D P B F P 5 P R 20 0 S D P B F P 50 6 6 P R 30 0 S D P B F P Figure How to record habitat unit information. 42 Habitat Units: Special Situations and FAQPool partially in reach?uestionWhat ifthere is a pool near my BR (or TR) that is only partially in myreach?Do I measure it?nswerYes. ExamineFigure 9. If a qualifying pool is partially in the reach, measure the length within the reach. Measure the pool

52 tail depth and max depth even if they fa
tail depth and max depth even if they fall outside the reach. Measure pool tail fineseven if the pool tail falls outside the reach.Reach length discrepancy?uestionhat if ‘normal’ reach length vs. habitat unit reach lengths are not the same?nswerthat’s OK, they should be close, but they don’t have to be exactNo pools?uestionhat if our whole reach is a riffle?nswer: Enter it as 1 riffle.Partial flow in reach, measure pools?uestion: What if there isn’t water flowing throughout my reach, do I measure pools?nswer: Yes! Measure all qualifying pools that have water (even a trickle) flowing into and out of them. Don’t measure stagnant pools. Make a comment explaining ‘weird’ flow issues. For example: ‘partial flow in reach. Water was flowing from BR to transect 12, US from transect 12 to TR, there was water in pools, but no flowing water’. In this example you would measure pools between BR and transect 12 only.Continued on following page. 43 Is it 2 pools or 1?When considering whether to lump or split two potential pools, consider them two pools if the upstream pool has a pool tail that is ≤10cm deeper than th

53 e downstream pool tail. Conversely, con
e downstream pool tail. Conversely, consider it one pool if the upstream pool tail depth is 10cm r than the downstream pool tail depth. FigureExample of lumping and splitting pools 44 POOL TAILFINEObjective:Quantify the percentage of fine sediments on the pool tail surfaceof scour pools and plunge pools Sampling method: Measure the first ten scour and plunge poolsbeginning at the BR and working upstream. Exclude dam and beaver pools.Usea 14 x 14 inch grid with 49 evenly distributed intersections. Include the top right corner of the grid for a total of 50 intersections.Take 3 measurements per pool.Sample within the wetted channelPlace the bottom edge of the grid upstream from the pool tailcrest a distance equal to 10% of the pool’s length or one meter, whichever s less (Figure Place the center of the grid at 25, 50, and 75% of the distance across the wetted channel, making sure the grid is parallel to and following the shape of the pool tailcrest.Grid placements are estimated visuallyIf the fines grid lands on a boulderaxisdiameter), record intersections on the boulder as ‘measurableFigure In narrow streams, it is OK if grid placements overlapRecor

54 d the number of intersections that areun
d the number of intersections that areunderlain with fine sediment mm in diameter at the baxis. Use the2 mm wide piece of electrical tape on the gridas a reference.Then count and record the number of intersections that areunderlain with fine sediment 6 mm in diameter at the baxis. Use the 6mm wide piece of electrical tape on the grid as a reference.Record the number of nonmeasurable intersections. Aquatic vegetation, organic debris, roots, or wood may be covering the substrate. First attempt to identify the particle size under each intersection. If this is not possibledue to debris, then record the number of nonmeasurable intersections.Do not attempt to move the obstructing debris 45 Figure Location and orientation of pool tail fines grids relative the pool tail crestFigure Record intersections of the fines grid that land on boulders ≥512 mm (baxis diam.) as ‘nonmeasureable’.Reminders NOTE:The number of fines 6mm must be a higher number than the number of fines 2mm The number of fines 6 mm + measureable intersections must be ≤This measurement evaluates the size distribution of particles making up the streambed,dust on top of rocks does not

55 count as pool tail fines. CREST POOL RIF
count as pool tail fines. CREST POOL RIFFLE 25%50%75% Water’s TAIL X = 10 % pool’s length, or 1mwhichever is less CREST POOL RIFFLE 25%50%75% Water’s TAIL X = 10 % pool’s length, or 1mwhichever is less CREST POOL RIFFLE 25%50%75% Water’s TAIL X = 10 % pool’s length, or 1mwhichever is less X 46 CROSS SECTIONS: INTROGear:30 or 50m Tape2 Depth rods with levels3 (or more) candy canesLogger / Form 9RulerFor wide streams: Stadia rodHand levelYou will do these 3 measurements at oncewhile working upstream:Cross sections: at even numbered transects≤20Bankfull widths: at odd numbered transectssee ‘Bankfull Width’ pg ebble counts: at all transects see ‘Pebble Counts’You will measure 10 cross sections / reach (transects 2, 4, 6, 8, 10, 12, 14, 16, 18, 20 Question:What if measured 10 cross sections but still have more evennumberedtransects upstream? (This will occur when you have 2 or moretransects) Answer:The logger won’t allow you to collect cross sections from eventransects� 20. Just measure bankfulland pebbles like you do at oddnumbered transects. 1. Determine precise location of each crosssection i

56 n relationship to evennumbered transectC
n relationship to evennumbered transectCross sections are perpendicular to the channelYou don’t have to place crosssections exactly in line withtransects, you can move up or downstream fromthetransect ½ of the width category (measured along thalweg). If the width category is 8m, you can go up / downstream from the transect 4m (Figure ). the width category is 14m, you can go up / downstream 7m. Find the most suitable location within this area, tryto avoid: Undercuts banksIslandsBoulderBarsBrushy banksLogs & Log jamsUneven water surface 47 Question:What if you cannot find a suitable cross section within +/half the width category ( Answer:Do the best you can Figure Determine precise location of each crosssection in relationship to evennumbered transect.2. Determine if you will use the ‘water’ or ‘BF’ (bankfull) method to measure each cross section.Use the ‘water’ method when possible, it is faster e ‘water’method can be used if allof these criteria are met: Water’s surface is level from one bank to anotherThere aren’t any islands or barsThe wetted width divided bybankfull width ≥0.5.Wetted width is≥ 0

57 .20 mNOTE: The logger will warn you if y
.20 mNOTE: The logger will warn you if you try to use the ‘water’ method when criterion 3is not met. At odd numbered transects & even transects �20: bankfullwidth & pebble measurementsAt / near even numbered transects cross section & pebble measurements.can move up / downstream of thewidth categoryIn this example: Width Cat. = 8mcross section will be within4m up / downstream ofEven numbered transects(measured along thalweg Flow T1T2T3T4T5 Place cross sectionwithin these 8m Place cross sectionwithin these 8mAt odd numbered transects & even transects �20: bankfullwidth & pebble measurementsAt / near even numbered transects cross section & pebble measurements.can move up / downstream of thewidth categoryIn this example: Width Cat. = 8mcross section will be within4m up / downstream ofEven numbered transects(measured along thalweg Flow T1T2T3T4T5 Place cross sectionwithin these 8m Place cross sectionwithin these 8m 48 CROSS SECTIONS: WaterBankfull cross section measurements:Recordif the cross section is located in riffle, poolor beaver . If one side is in a riffle and the other is in a pool label it ‘pool’.Determine bankfull heig

58 ht andmark this location on each bank us
ht andmark this location on each bank using candy canes.Pin / hold tape on RL at bankfull.sing thetape, measure the following:LEW distanceBankfuldepth at LEW distance from water’s surface to bankfullREW distanceBankfull depth at REW distance from water’s surface to bankfullBankfull distance on RR bankNOTE: istances are in meters to the nearest cm(3.02 for example), depths are measured in cmNOTE: Bankful heights on LEW / REW must be within 3cm.Within the wetted width,start at the LEW and measure water depth at these locations: (of the wetted width starting from LEW), 10%, 30%, 50%, 70%, 90%, 99% (Figure 49 Figure Depiction of waterbased cross section method. Notice that the 50% measurement falls on a boulder. Measure how high the boulder is above the water’s surface and enter this depth as a negative number. Question:What if I cannot measure the bankfull height because the distance from the water’s edge to bankfull is too far(i.e. horizontally longer than my depth rod) Answer:Use your stadia rod or the hand level. To use your hand level,old your depth rod vertically at water’s edge. Note the height. Next, have your partner hold t

59 he rod vertically at bankull. Subtract
he rod vertically at bankull. Subtract this number from youfirst. This is bankfull height. QuestionWhat if one of my measurementfalls on a feature (bar, boulder, log, etc) that is above the water’s surface? Figure AnswerEnter the distance from the water’s surface to top of feature as a negative number using 2 depth rods. Measure pebbles before leaving this location see ‘Pebble Counts’ sectionpg RRRL 10%30%50%70%90%99%Then measure water depths at these locations using depth rod RRRL Pin tape to RL bank at BF, stretch tape to RR bankfulland measure:LEW distance, BF depth at LEW, REW distance, BF depth at REW,& BF distance on RR bank LEWREWBF dist RRRL 10%30%50%70%90%99% RRRL 10%30%50%70%90%99% 10%30%50%70%90%99%10%30%50%70%90%99%Then measure water depths at these locations using depth rod RRRL Pin tape to RL bank at BF, stretch tape to RR bankfulland measure:LEW distance, BF depth at LEW, REW distance, BF depth at REW,& BF distance on RR bank LEWREWBF dist 50 ROSSSECTION: BF How to take measurements: Record if cross section is locatedin riffle, or beaver poolIf one side is in a riffle and the other is in a pool label it ‘pool

60 6;.Determine the bankfull elevation on e
6;.Determine the bankfull elevation on each bank. Stretch the tape perpendicular to the channelbetween bankfull elevations with the “zero” end of the tape on theriverleft bank (RL) looking downstream. Make sure the tape is straight and not bowedTake minimum of 10 depthmeasurements starting at bankfull on the left bank and ending at bankfull on the right bank. Calculate the distance between measurements by viding the bankfull width by 10 and rounding down (ex. bf width=7.8m interval between measurements=0.7m). Randomly choose the location of the firstmeasurement (using the random number table in the data logger) between bankfull on the left bank and the distance of the interval calculated above (Figure At each depth measurement record the distance along the tape and the depth from the streambed to the bankfull elevation in cm. At the bankfull location of each bank, record the location along the tape and a depth of “0”.In addition, record a measurement type for each applicable depth measurement. Use the following codes: Meas. Type Code Rod Location BFDIST Bankfull distance on RR LEB Left edge of bar/island LEW Left edge of wate

61 r MAXDEP Maximum depth ON_BAR
r MAXDEP Maximum depth ON_BAR On bar or island ON_BLD On a boulder REB Right edge of bar/island REW Right edge of water 51 If your cross section is dry, enter ‘Dry Xsec’ as a commentand don’t record LEW / REW measurements.f your cross section has an uneven water surface (LEW vs. REW heights differ by 3cm or more), enter use the drop down to enter comments ‘Pitched riffle surface’ as a comment.. Measure pebbles before leaving this location see ‘Pebble Counts’ sectionpg 52 XsecNum 1 BFDist BFDepth MeasType 0.2 0 10 0.7 0 20 LEW 0.8 0 30 1.4 0 40 2 .00 38 2.6 0 45 MAXDEP 3.2 0 40 3.8 0 35 4.4 0 33 6 .00 30 6.08 30 6.09 20 REW 6.1 0 0 BFDIST Figure Channel crosssectionfigure and tables displaying the location of the tape; layout of depth measurements along the tape; additional measurements of LEW, REW, and maximum depthbankfull distance Random # = 0.2 m BF Width = 6.1 m Interval = 0.6 m 53 XsecNum 2 BFDist BFDepth MeasType 0.01 20 LEW

62 0.02 37 0.20 39 0.90 50
0.02 37 0.20 39 0.90 50 1.27 53 MAXDEP 1.60 41 2.30 32 3.00 9 ON_BLD 3.70 32 4.40 30 5.10 29 5.80 27 6.28 24 6.29 20 REW 6.50 10 7.05 0 BFDIST Figure hannel cosssection with vertical banks and boulders. If measurements fall on boulders a) within wetted channel and b) above water’s surface code the measurements ‘ON_BLD’.Enter ‘Rocky riffle surface’ as a comment.When the streambankis vertical, enter a depth of “0” at bankfull on the tape, “0.01” for the water’s edge and the depth to the streambed at “0.02”. For example, (0.01,0.20 LEW), and (0.02,0.40) (Figure Only measure to the edge of the bank when an undercut exists. Do not measure beneath the undercut. 0.200.901.602.303.00ON_BLD3.704.405.105.806.507.05BFDIST 1.27MAXDEPLEW 0.01 0.02 REW 6.296.28 0.00 0.200.901.602.303.00ON_BLD3.704.405.105.806.507.05BFDIST 1.27MAXDEPLEW 0.01 0.02 REW 6.296.28 0.00 Random # = 0.2 m BF Width = 7.05 m Interval = 0.7 m 54 Random # = 0.3 m BF Width = 7.63 m Interval = 0.7 m

63 XsecNum 3 BFDist BFDepth MeasT
XsecNum 3 BFDist BFDepth MeasType 0.17 20 LEW 0.30 22 1.00 25 1.64 20 LEB 1.70 18 ON_BAR 2.40 15 ON_BAR 3.04 20 REB 3.10 22 3.80 26 4.50 30 5.20 34 5.90 39 6.14 44 MAXDEP 6.60 40 7.12 20 REW 7.30 13 7.63 0 BFDIST Figure Channel crosssection with bar below bankfull.Measure islands lower than the bankfull elevation as illustrated above (Figure ). RLRR 6.14MAXDEP 1.70ON_BAR 1.64LEB3.04REB2.40ON_BAR 7.12REW0.17LEW 0.30 1.003.103.804.505.205.906.607.30 0.00 7.63BFDIST RLRR 6.14MAXDEP 1.70ON_BAR 1.64LEB3.04REB2.40ON_BAR 7.12REW0.17LEW 0.30 1.003.103.804.505.205.906.607.30 0.00 7.63BFDIST 55 Random # = 0.2 m BF Width = 6.98 m Interval = 0.6 m XsecNum 4 BFDist BFDepth MeasType 0.20 12 0.31 20 LEW 0.80 23 1.40 33 2.00 38 2.60 41 3.20 46 3.38 51 MAXDEP 3.80 42 4.40 23 4.72 20 REW 5.00 0 5.01 0 5.19 20 LEW 5.60 34 6.20 39 6.77 20 REW 6.80 17 6.98 0 BFDIST Figure Cross section with is

64 land ≥bankfull height.Enter ‘Isla
land ≥bankfull height.Enter ‘Island present’ as a commentFor islands higher than bankfull, measure the 2 channels separately Figure ). Make sure to record a “0” depth at bankfull for both channels. Record two ‘REW’, two ‘LEW’ and one ‘MAXDEP. Tapes must be perpendicular to each channel.After entering data, hit F4 to back out, the logger will beep and display amessage indicating there are errors. Hit F5, and under ‘comment’ hitF2 and select “island present” as a commentfrom the drop down menu 3.38MAXDEP 5.0mTape position 1 1.98mTape position 2 5.005.01 6.98BFDIST0.000.31LEW4,72REW5.19LEW6.77REW0.200.801.402.002.603.804.405.606.206.80 3.20 3.38MAXDEP 5.0mTape position 1 1.98mTape position 2 5.005.01 6.98BFDIST0.000.31LEW4,72REW5.19LEW6.77REW0.200.801.402.002.603.804.405.606.206.80 3.20 56 PEBBLE COUNTS Objective: Determine theD50 (median particle size) within the reach. Where to take measurements: Take measurements at all transects. Sample the entire bankfull channel width across the transectincludingqualifying side channels) Sampling Method: Five particles will be sampled across each transe

65 ct, from flag to flag.Samples will be ta
ct, from flag to flag.Samples will be taken at 10, 30, 50, 70, and 90% of the way across the bankfull channel width, starting from river left Figure Figure Location across transect for pebble count sampling.Do not include the width of islandsbars that are ≥bankfull elevation.Visually estimate the sample locations prior to walking across the transect.Continued on following page. 57 Sample the particle at the toe of the footdepth rod. Reach down with the forefinger (without looking down) and pick up the first particle touched. Measure the middle width (B axis) of the particleFigure . Visualize the B axis as the smallest width of a hole that the particle could pass through.Record particles 2 mm as 2 mm. Record the width of larger particles to the nearestmm. For particles� 4097mm, record as 4097mm.Also record whether the particle was found on the streambed (bed) or streambank (bank). See Where Streambed and Streambank Meet’ pg 3.In deep water estimate the width of the particle. If unable to measureestimate particle size because it cannot be seen (covered by large wood, excessive depth, turbidity or dangerous conditions) skip it (you will have l

66 ess than 5 for that transect)Figure Meas
ess than 5 for that transect)Figure Measure the B axis 58 BANKFULL WIDTH Objective:Determine the average bankfull width for the reach. Where to take measurements: At all odd numbered transects alltransects� 20Measurethe entire bankfull channel width across the transect Sampling Method: Measure the bankfullwidth to the nearest 0.1 meters perpendicular to the stream channel at all transects.Measure the bankfull width from one transect flag to the other transect flag on the opposite bank.When local bankfull indicators are not present use the height from thewater surface to the bankfull elevation (bankfull height) defined at channel crosssections to approximate bankfull.Do not take measurements in these situation, record ‘99’ in the logger:At tight meanders where the transect may cross a point bar without intersecting the actual bank (located behind the point bar).See diagram here or at training:ide channels: Record the width of each channel individually Record the width of the main channel (most flow) as ‘MC’ in the loggerRecord the width of the first side channel (2most flow) as SC 1, and the second channel (3most flow) as ‘SC 2

67 ’.Record the widths of additional c
’.Record the widths of additional channels in the comment field (ex: ‘SC 3 = 1.2 m’)Do not include the width of islandsbars that are above bankfull.When moving into a new channel adjust the angle at which you measurethe BF width. Move the tape so that it is erpendicular to the local stream channelContinued on following page. 59 Figure Depiction of how to record bankfull widths when side channels are encountered. The numbers 1 4 are used to identify the relative amount of water flowing through each channel, 1 has the most water, 4 has the least. How to label bankfull widths in this example:Transect 1: MC = 8.3mTransect 2:MC = 2.4 m (labeled ‘1’)SC 1 = 2.6 m (labeled ‘2’)SC 2 = 1.8 m (labeled ‘3’)Transect 3:MC = 2.2m (labeled ‘1’)SC 1 = 1.4m (labeled ‘2’)SC 2 = 2.0m (labeled ‘3’)SC 3 = 1.6m (labeled ‘4’)NOTE: The logger only allows you to enter MC, SC 1, and SC 2, record the widths of additional channels as a comment. 60 BANK ANGLEIn a few situations, it can be difficult to determine differences between the streambed and streambank in reaches with cobble or bedrock substr

68 ate. Begin assessing allstreambank meas
ate. Begin assessing allstreambank measurements at the scour line in these situations.Objective:Quantify bank angle and the frequency of undercut banks within the reach.Equipment needed:ProtocolCompassDepth rodLocate the following at each transect flag before measuringbank angleWhere the streambed and bank meetpg Scour line (SL)pg Bankfull elevation pg First flat, depositional featurepg Measurement basicsay a depth rod along the bankperpendicular to the channelat the exact location of the transect flag. Place a compass on top of the depth rod (not on the sides) and record the angle to the nearest degree.Carefully read the instructions for measuring different types of banks Using your compass to measure bank angleThe back of your compass has a clinometer,which you will use to measure bank angle The compass must be set to 90 , or you cannot correctly measure angles Acute angles (undercuts) can be read directly from the compassObtuse angles require you to subtract your measurement from 180°. For example, if you read 45, your angle is 180 45 = 135°. 61 BANK ANGLE: WHERE TO MEASUREDefine precise location where bank angle is measured at each transect flageasur

69 ements are perfectly inline with transec
ements are perfectly inline with transect flagsperpendicular to the channel Lower limit of measurementwhere streambed and streambank meet Exemption:depositinal bankswhen depositionof streambed materialextends abovethe scour line, the lower limit of measurementswhere deposition meets the streambank.Read page for more information ption: slump blocks, logs, rockswhen the connection point (i.e. where the top of the slump block, logs, rocks meets the bank) is below the scour line, the lower limit of your measurement is there. Read page formore information. Upper limit of measurement irst flat depositional feature at or above bankfullf this feature is not present, upper limit is 0.5m above the local bankfull elevation (see Figure Figure Bank angle plot when flat depositional feature is absent. The upper limit of bank stability plot is 0.5m above thebankfull elevation. Local Bankfull 0.5m Streambed &StreambankMeet Here Bank AnglePlot 62 Bank Angle: Undercut BanksRemember:acute bank angles can be read directly from the compass.Measure the angle of undercut banks using the following criteria:A qualifying undercut must be 5 cm deep, 10 cm in heigh

70 t, 10 cm in width.The idea is that you c
t, 10 cm in width.The idea is that you could ‘hide’ a box of this size in the undercut, without being able to see it from above.For all transects with acute bank angles, including undercuts, record undercut depth as one of the following 3 categories:5 cm nonqualifying undercut≥5 cm qualifying undercutNA ceiling above BF (this is a nonqualifying undercut) igure Undercutbank angles are measured from the deepest point of the undercut up to the ceiling of the overhang (Figure Occasionally the back of the undercut will be a consistent depth, thereby lacking a deepest pointFigure ). Place the depth rod at the highest elevation, resulting in the smallest angle (angle B).Enter the angle as “1” if the deepest part of the undercut is elevationally above the ceiling (Figure In some situations, there will be an undercut with a ceiling below bankfull and a second undercut with a ceiling above bankfull. Measure the lower undercut and ignore the upper 63 Figure Measure undercut bank angle from the deepest point to the ceiling of the undercut; determine if the undercut has a qualifying depth (≥5 cm) by lowering you depth rod until it is horizontal.i

71 gure When the deepest point is elevation
gure When the deepest point is elevationally above the ceiling of the undercut, determine if the undercut is ‘qualifying’ by holding the depth rod horizontal and directly underneath the ceiling. Record the angle as 1Figure Undercut bankswith a constant depth are measured with the base of the depth rod at the highest elevation (angle B, not angle A). 64 igure Undercut bank with the ceiling above bankful are measured from where bed and bank meet to the outside edge of the undercut. In this example the angle is less than 90so record as NA ceiling above BF FigureUndercut banks with the ceiling above bankfull are measured from where the streambed and bank meet to the outside edge of the undercut. In this example the angle is �90 so record the measurement as 180measured angle. 0° Undercut Depth = NA ceiling above bankfull � 90° 65 Bank Angles:1 angle (≥10m in height)If the bank slopes away from the streambed, the bank angle is from horizontal(obtuse). To obtain the actual angle for these banks, subtract the value on the compassfrom 180 (e.g. the compassreading is 30; 180 30 = 150Forgetting to subtract bank angles from 1

72 80 is a common error, before recording d
80 is a common error, before recording data always think, “is theangle obtuse (≥90º) or acute(90º)Measure the angle from the base of the bank (where the streambed and bank meet) up to the first flat, floodplainlike surface located at or above the bankfull elevationIf a bankfull indicator / feature is not present, the upper limit of bank angle plotis 0.5m above bankfull elevation.Complex Banks: 2 angles (both 10cm in height When a bank has more than1 angle, consider each angle with a vertical height of 10 cm. Measure the angle of the lower portion of the bank if it is taller than the upper portion (Figure ). Similarly, measure the angle of the upper portion of the bank if it is taller Figure Figure Measure the tallest angle when the bank has two dominant angles. 66 Bank Angles: ≥3 angles (≥10cm in height)easure the average angle by laying the depth rod along the outer corner of the steps (Figure ). Strive to represent the bank angle as accurately as possible with one rod placement. Figure Measure the angle of banks with 3 or more angles by laying the rod along outer edges. 67 Bank Angle: Depositional FeaturesDepositional features are not c

73 onsidered part of the bankStart you bank
onsidered part of the bankStart you bank angle measurement at the point where deposition endsOn unvegetated depositional features such as point bars, start the measurement at the pointwhere the top of the depositional feature and streambank meet (Figure If deposition ends at or above the first flat, floodplainlike feature (Figure ), record ‘osition bank’ for the bank angle.Use the point where the depositional feature becomes� 50% vegetated (perennial species) to define were the deposition ends and bank begins.Figure Begin measuring the angle from thepointwhere the depositionbank meet.Figure Do not measure an angle when the deposit covers the first flat, floodplain like feature. Record 99 for bank angle. Record as “ - 99 depositional bank” Record as - 99 68 Bank Angle: Slump Blocks, Logs, RocksSlump Blocks Slump Blockpiece of the bank that is detaching or has detached from the streambank. the connection point (i.e. where the top of the slump blockmeets the bank) is below the scour line, the lower limit of your measurement is the connection point (Figure If the connection point is above the scour line, thelower limit of your

74 measurement is where bed meets bank (Fig
measurement is where bed meets bank (Figure Do not consider slump blocks that are not attached tostreambankFigure Location of bank angle measurements with a slump block still attached and relative to the scour line.Logs and RocksConsiderlogs (10 cmdiameter) and rocks (15 cmaxis diameter) as part of the bank if theyare embedded within the bank.As with slump blocks, determine if the connection point (i.e. where the top of the logrock meets the bank) is elevationally below the SL. If so, the lower limit of your measurement is the connection point.If the connection point is above the scour line, the lower limit of your measurement is where bed meets bank. 69 ank Angle KeyThis is not a standalone key!efer to the entire bank angle section of this protocolfor specific instructions of how to measure each type of bank Make sure yourcompass is set to 90 / 270º Streambank presentand accessibleYes, go to 2No. Transect located in a tributaryrecord No. ransect inaccessible (too brushy, rattlesnake, etc).record Depositionextends abovethe first, flat depositional feature? record No. epositionpresent, but it’sbelow first flat depositionalfeaturenly evaluatertion of ba

75 nk above depositiongo to 3No deposition,
nk above depositiongo to 3No deposition, evaluate from where bedbank meetgo to 3Is there a qualifying undercutbank?No qualifying undercutgo to 4, qualifying undercut present. Measure the bank angle, which must be acute (90°), and classify undercut depth into one of the 3 categories:5 cm qualifying undercut≥5 cm qualifying undercutNA ceiling above BFIs there a slump block, an embedded log(≥10cm diam.), or embeddedrock (≥15cm baxisdiam.at your transect locationgo to 5 Yes, connection pointof the slump block / log / rock elevationally below SL. Follow procedures in #5, but only consider the from the connection point up to the first flat depositional featurego to 5 Yes, connection pointof the slump block / log / rock elevationally above SL. Follow procedures in #5and consider the entire bankfrom where bed and bank meet up to the first flat depositional featurego to 5 Bank comprised of 1 anglemeasure angleBank comprised of 2 angles≥10cm in heightmeasure ‘taller’ angleBank comprised of 3 angles≥10cm in heightmeasure angle ��70 &#x/MCI; 0 ;&#x/MCI; 0 ;Bank StabilityObjective:Classifystreambank stability into one of 15 categ

76 ories) at each transect flagDefine preci
ories) at each transect flagDefine precise location where bank stability will be evaluated at each transect flageasurements are perfectly inline with transect flagsperpendicular to the channelThe stability plot is 30 cm wide (15 cm on each side of the transect flag) Lower limit of stability plot:scour line Exemption: depositional bankswhen deposition of streambed material extends abovethe scour line, the lower limit of the stability plotwhere deposition meets the streambank Use the point where the depositional feature becomes �50% vegetated (perennial species) to define were the deposition ends and bank begins.In a few situations, it can be difficult to determine differences between the streambed and streambank in reaches with cobble or bedrock substrate. Begin assessing all streambank measurements at the scour line in these situations. Upper limit of stability plot: irst flat depositional feature at or above bankfullf this feature is not present, upper limit is 0.5m above the local bankfull elevation (see Figure below).Continued on following page. 71 Figure Bank stability plot when flat depositional feature is absent. The upper limit of bank stabilit

77 y plotis determined by adding 0.5m to th
y plotis determined by adding 0.5m to the bankfull height. The lower limit of the stability plot is the scour line. Local Bankfull 0.5m Streambed &Streambank Meet Here Bank AnglePlot 72 treambank Stabilitylassification Key Terminology Depositional BankA streambank with deposition extending above the SL. Scour BankA streambank with no deposition or deposition is below or equal to the elevation of the SL. Scour LineLocate the lowest consistent scour line in your reach by examining features along the streambank: lowest consistent limit of sod forming vegetation, lowest consistent limit of perennial vegetation, the ceiling of undercut banks in straight sections of stream channel, on depositional features such as point bars, the scour line is often defined by the limit of perennial vegetation, or by an indentation in the bar (locally steep area). Page 3 Where to lookthe best place to identify scour line is in a straight, wellvegetated section of the stream channel. Slump BlockThat piece of the bank that is detaching or has detached from the streambank. CrackA crack in the streambank(start of a fracture feature), but the slump bl

78 ock has not begun detaching from the ban
ock has not begun detaching from the bank. FracturedSlumpblock has at least partially broken from the bank and is separated from its original location by 10 cm. Fracture FeatureThe piece of the bank (usually vertical) exposed by the detaching slump block. CoveredBanks are ‘covered’ if� 50% of stability plot is covered by: Perennial vegetationground cover (moss is not perennial). Includes live herbaceous vegetation; dead, rooted grasses; the canopy of shrubs 1 meter in height. Rootsof vegetation. Deep rooted plants such as willows and sedges provide such root cover. Rocks≥15 cm (baxis diameter). Rocks do not need to be embedded. Logs≥10 cm in diameter. Logs do not need to be embe combinationof the above. 73 treambank Stabilitylassification Key Streambankpresentgo to II Tributary Streambank= Scour Bankgo to III Streambank= Depositional Bank (Figure Deposition at or above bankfull Bank covered(deposition below bankfull) Bank not covered (deposition below bankfull) III. Bank is not fractured, or the bank is fractured with the slump block no longer attachedto the streambankand is either lying adjacent to the breakage or ab

79 sentgo to IV Bank is fractured withthe s
sentgo to IV Bank is fractured withthe slump block still attachedFigure III). Consider the slump blockunattached if only gravityfrictionis keeping it in place. A. The bottom of the fracture feature is elevationally below the SLiew only thefracturefeature behind the slump block (Bank not covered Bank angle within 10of vertical (80100 Bank angle not within 10of vertical Bank covered B. The bottom of the fracture feature behind slump block is elevationally above the SL (view the bank as the slump block and the fracture feature the vertical, exposedbank)III B) Bank not covered Bank covered Fracture feature not covered Fracture feature covered (slump block reconnected to bank) IV. No crack visible from the SL up to a point 15 cm behind the top of the go to V A crack is visible within this area (Figure Bank is not covered Bank covered V. All other situationsBank not covered Bank angle within 10of vertical (80100 Bank angle not within 10of vertical Bank covered Roman numerals beside pictures on following pages correspond to key 74 Figure Examples of bank stability types described in sections II, III, and IV inthe classification key.The Roman numeral and

80 letter combinations bove correspond with
letter combinations bove correspond with the bank stability key on the previous page. Bankfull or First, Flat Feature Bankfull or First, Flat Feature 75 BANK TYPEObjective:Categorize each transect location based on the fluvial processes forming the streambankHow to take the measurements:Defining the processes that creates the streambankcondition at each location is integral to understanding bank stability, bank angles, and undercut bank measurements. Classify the streambanks into 1of 5categories based on association with erosion or deposits, poolor nonpool habitat units, and the relation to the thalweg (Figure Also identify transectswere data is collected in beaver pools.Determine whether the transect lies within a pool or rifflerun. onsider all nonpool habitat as rifflerun.Record all measurements on the outside bend in pools as “PO” for pool outside.the pool occurs ina straight stretch of channel, measure from the thalweg to the bankfull elevation on both banks. The bank closer to the thalweg is “pool outside” while the bank further from the thalweg is “pool inside”(Transects 1 & 2 inFigure Streambanks on the inside of pool

81 s are further delineated as erosional or
s are further delineated as erosional or depositional. Erosional banks have no deposition or the deposition is below the SL and classified as “PIE” for pool inside, erosional(Transects 1, 2 & 4 inFigure Depositional banks have deposits that extend above the scour line and are classified as “PID” for pool inside, depositional(Transect 5 in Figure For transects where both banks arebeside nonpool habitats, record both banks as“R” for rifflerunIn situations near a pool head or tailor side channel, one bank may be within the pool and one in a rifflerunse the pool classification for both(Transect 2 inFigure For example, you will never have one bank be ‘PO’and the other‘R’ for example.Record all measurements in a side channel as ‘SC’. Identify all transects that fall in beaver pools by marking yes in the beaver impacted section, if the transect is not impacted by beaver leave blank 76 77 PIDPIEPIEPIEPoolRiffle/RunThalwegTransectFlagTransectDeposition AboveScour Line PIDPIEPIEPIEPoolRiffle/RunThalwegTransectFlagTransectDeposition AboveScour Line PoolRiffle/RunThalwegTransectFlagTransectDeposition Abov

82 eScour Line 78 Figure Example of str
eScour Line 78 Figure Example of stream showing the fourclassification categories for bank type. 79 LARGE WOOD Objective: Quantify alllarge wood within the bankfullchannel, throughout your reachAlways start at BR and work upstreamNOTE: you should have already counted large wood when quantifying habitat units (poolsvs. riffle / runsEquipment needed: 30m tape Depth rod Logger 2 stream techs(one could be a welltrained veg tech) Sampling Method:n order to be counted, each piece must meet the following criteria. Each piece must be greater than 1 meter in length and at least 10 cm in diameter onethird of the way up from the base. For eces that are not evenly round, measure the widest axis. The stem of the large wood piece must extendbelow the bankfull elevation. Imagine the stream is flowing at bankfull, any piece whose stem is wet would count. About dead pieces Can be fallen or standing trees Dead trees are defined as being devoid of needles or leaves, or where allof the needlesand leaves have turned brown. Consider it living if the leaves or needles are greenUse caution when assessing the condition of a tree or fallen log. Nurse logs can appear to have li

83 ving branches when seedlings or saplings
ving branches when seedlings or saplings are growing on them.Wood embedded in the streambank is counted if the exposed portion meets the length and width requirements (Figure Do not count a piece if only the roots (but not the stembole) extend within the bankfull channel.Some pieces crack or break when they fall. Include the entire length when the two pieces are still touching at any point along the break. Treat them separately if they are no longer touching along the break Figure Figure 80 Multiple stems originating from one root mass?If you encounter a single root mass with many stems, measure the qualifyingstem with the largest diameter Method Record the piece number, estimated length (nearest 10 cm), and estimated diameter (nearest cm) of all qualifying pieces in the reach. Thesame person will make all estimates for a given reach. Record the name of the estimator in the data logger.Also measure the length (nearest 10 cm) and diameter (nearest cm) of the first 10 pieces beginning at the downstream end of the reach. The personestimating should not be made aware of the measured value. An additional subset of pieces will be measured at sites with more

84 than 10 pieces.For sites estimated to h
than 10 pieces.For sites estimated to have between 11 and 100 pieces, measure the first ten pieces, then starting at the 11piece only measure every 5piece. For sites estimated to have over 100 pieces, measure the first ten pieces, then starting at the 11piece only measure every 10piece. Don’t tell the estimator when a piece is going to be measured it must be randomMeasure the length of the main stem and not branches or roots. Begin measurements where the roots attach to the base of the stem when the roots are still connected. Do not measure the length andor diameter of standing dead trees, pieces buried in log jams, or other pieces that are unsafe to measure. If that piece was one that required measuring, record the estimated lengthdiameter and leave the measured length andor diameter blank. Then measure the next required piece, maintaining established interval (see # above).Begin counting from the BR to the TR, and from the bottom up when pieces are stacked on each other. For wood in side channels, see Figure to determinewhat large wood to count.Large wood in isolated side channels, pools or depressions bankfull elevation is not measured. 81 Figure a

85 rge wood. Pieces numbered 1 are counted
rge wood. Pieces numbered 1 are counted; pieces numbered and 3 are notFigure Examples of qualifying large wood (1). The pieces on the right side (3) are not counted (3) because only the roots extend over the bankfull channel (upper) and the exposed section is ≥1 m in length (lower). Bankfull 3 3 Bankfull 82 Figure Examples of how to measure the length of broken pieces. Measure the length of the entire piece on the left (pieces still connected). Only measure the piece within the bankfull channel on the right. Figure Is it one piece or two? Variations of touching vs. not touching along the break. Bankfull 83 Figure Depiction of qualifying and nonqualifying large wood. Unlabelled pieces qualify because they are within bankfull channel. Large wood on islands ≥bankfull elevation is not measured unless it meetscategory requirements (A). Large wood in tributary steams is not measured (C). To determine if large wood qualifies, visualize the water level at bankfull; if the stem is touching water, it qualifies. Large wood associated with isolated side channels, pools and depressions does not qualify (B). Tributary Bankfull Bankfull Water Th

86 alweg Large wood C-NO ANO BNOANO Tributa
alweg Large wood C-NO ANO BNOANO Tributary Bankfull Bankfull Water Thalweg Large wood C-NO ANO BNOANO 84 REACHMAPThe reach map is drawn on Form 2 to show important features that describe the site andwill be used to help relocate the site in the future. For most sites a previously drawn map will be provided to you on the back of the site sampling sheet. Good maps:Clearly show the reach drawn to scalShow the main channel (with flow arrow to show thalwag) extending at least 10 m aboveand below the reach boundaries, including sitemarkers, and any distinct feature that will help in relocating the siteShow natural features such as: side channels, tributariesshrubs and trees, large wood, bars, islands, pools,beaver activityburned areashill slopes, etcShow presence of management activitiesat the site: roads, trails, fences, timber harvest, grazing, campsites, restoration, etc… Show locations of transects, 5, 10, and 15 When to draw a reach map:At new sitesIf instructed to do so on the site informationsheet Channel shiftsBeaver impactsStream looks differentand has obvious changesWhen to modify an old Map:You cannot modify the old map if instructed to draw a new ma

87 p.If the map is generally well drawn but
p.If the map is generally well drawn but is missing important featuresthosefeaturecan be easily included wiout drawing the entire map. 85 Commonly Used Symbols for Reach Maps Site Marker Fence Bottom of Reach Road Top of Reach Thalwag Conifer Upslope Deciduous Cutbank Herbaceous / meadow Snag Fore Spanner Stump Log jam Large Wood Pool Rock Side Channel Bar North Arrow N post / rebar Transect 5, 10, 15 T5, T10, T15 Overview Photo Main Channel Table Commonly used symbols for reach maps. 86 Figure Example of a welldrawn reach map. 87 MEASURING CHANGE IN REACH ELEVATIONEquipment:utomatic evel, tripod, and stadia rodDefinitions:Elevation change = vertical

88 difference or drop between the water sur
difference or drop between the water surface at the Top of theReach (TR) and the water surface at the Bottom of the Reach (BR).Gradient = the percent slope of the stream reach (elevation change / reach length)Introduction:Measure elevation change betweenthe water surface at the Top of the Reach (TR) and the water surface at the Bottom of the Reach (BR)using a tripod and surveyors’ levelMeasure elevation change 2 or more timesThe second measurement must be ±10% of the first measurementIf the second measurement falls outside the ±10% window continue measuringelevation change until 2 measurements are within ±10% of one another. Only record the twoelevation changes within 10% of one another Form 1and in the data logger If you knowingly make an error while shooting elevation change, DO NOTenter this data into logger Special situationIf there is not flowing water at your BR / TR, position the stadia rod in line with the BR / TR at the deepest location within the channel. Overview:One person operates the level and records heights from the stadia rod. Theother person positions the stadia rod at the BR, any intermediate spots (if necessary) and at the TR. It is

89 very important to keep the stadia rod pl
very important to keep the stadia rod plumb (vertical in all directions) when taking measurements. The person operating the level will be able totell if the stadia rod is plumb or not and will communicate what needs to happen to the other personThe bottom surfaceof the stadia rod must be held at the surface of the water, not the stream bottomwhen positioned at the BR and TR. 88 LEVEL SET UPSTEP 1: Leveling with Tripod and Affixing LevelBe very careful when handling the levels because they are fragile and expensive.The levels must be setup properly or the measurements will not be accurate.Stomp the tripod legs into the ground; when it is stable, carefullymount the level on the top of the tripod. Thread the support screw in the center of the tripod into the corresponding hole on the bottom of the level. How tight? Just right don’t break it.STEP 2: Center the bubbleOnce the level is secured onto the tripod, do as much leveling as possible using the tripod legs while looking at the bubble window.STEP 3:Fine adjustmentsUse the knobs for fine scale leveling. The three knobs can be adjusted independent of one another and it may seem counterintuitive, but if

90 the level moves one way the bubble goes
the level moves one way the bubble goes the other. Once the bubble is entirelywithinthe center circleis level.e careful whenusing the fine adjustment knobs because they break if they aretightened too hardBe EXTREMELY careful, do not bump thetripod and level once it is set up or you will have to start over. 89 BR TR 4.1m2.89mElevation Change 1Shooting uphillB = 1.21m BR TR 4.1m2.89mElevation Change 1Shooting uphillB = 1.21m TR 4.1m2.89mElevation Change 1Shooting uphillB = 1.21m EXAMPLE 1: Measuring elevation change with one shotPosition the level somewhere between the BR and TR. Under ideal conditions, you will be able to view the stadia rod through the level when it is at the BR and TR. Record the heights from the stadia rod that line up with the horizontal crosshair inside the level for both locations on the back of Form 1Calculate elevation change. Figure shows how to record individual shots and calculate elevation change.You must measure the elevation change either two or moretimes. Between repeat measurements, the tripod must be releveled or moved (you must move 1 tripod leg at least) to get an independent measurement. In order for the two measuremen

91 ts to be valid, the measurements must be
ts to be valid, the measurements must be ±10% of one another. For example, in Figure the elevation change of the first shot is 1.21m (4.1 2.89). The second shot must be ±10% of the first. To calculate this range, multiply 1.21m by 0.9 to establish the lower threshold (1.09m), and multiply 1.21m by 1.1 to establish the upper threshold (1.33m) (Figure ). Becausethe secondelevation changewas within the±10% range (1.19m), a third measurement was not required.Figure Measuring elevation change using a single shot. The 1of 2 elevation changes is depicted above. 90 Figure Measuring elevation change using a single shot. (Top) The 1st of 2 elevation changes is depicted above. (Bottom) When shooting from BR to TR (uphill, record on top of Form 1) A B = elevation difference for each shot, when shooting from TR to BR (downhill, record on bottom of Form 1) B A = elevation difference.EXAMPLE 2: Measuring elevation change with multiple shotsVery often, you will not be able to measure the reach elevation change with 1 shot. In the following example, 3 shots are required.When moving the level to the next shooting location, it is imperative to keep the stadia rod on t

92 he exact samespot. Intermediate rod pos
he exact samespot. Intermediate rod positions serve as reference points “connecting” level shot #1to shot #2, and so on (Figure ). Also, as stated earlier, the rod must be at the water’s surface at the BR and TR, but is not necessary for intermediate readings. DO NOT erase on this formIf more than 5 shots are required, continue on additional sheet(sElevation 1Elevation 2Elevation 3 Shot 1Shot 2Shot 3Shot 4Shot 5Measuring elevation change: starting from Bottom of Reach, shooting upstream TR Sum of Dif(Dif 1+Dif 2…) Dif 1 Dif 2 Dif 3 Dif 4 Dif 5 AB Shot 1Shot 2Shot 3Shot 4Shot 5Measuring elevation change: starting from Top of Reach, shootingdownstream Sum of Dif(Dif 1+Dif 2…) Dif 1 Dif 2 Dif 3 Dif 4 Dif 5 ABTR Elevation 1Elevation 2Elevation 34.11.212.891.21 Are measurements within 10%?lower limit upper limitElevation_______ * 0.9 =________ * 1.1 =________Elevation_______ * 0.9 =________ * 1.1 =________Elevation_______ * 0.9 =________ * 1.1 =________1.211.091.334.243.051.191.19DO NOT erase on this formIf more than 5 shots are required, continue on additional sheet(sElevation 1Elevation 2Elevation 3 Shot 1Shot 2Shot 3Shot 4Shot 5Me

93 asuring elevation change: starting from
asuring elevation change: starting from Bottom of Reach, shooting upstream TR Sum of Dif(Dif 1+Dif 2…) Dif 1 Dif 2 Dif 3 Dif 4 Dif 5 AB Shot 1Shot 2Shot 3Shot 4Shot 5Measuring elevation change: starting from Top of Reach, shootingdownstream Sum of Dif(Dif 1+Dif 2…) Dif 1 Dif 2 Dif 3 Dif 4 Dif 5 ABTR Elevation 1Elevation 2Elevation 34.11.212.891.21 Are measurements within 10%?lower limit upper limitElevation_______ * 0.9 =________ * 1.1 =________Elevation_______ * 0.9 =________ * 1.1 =________Elevation_______ * 0.9 =________ * 1.1 =________1.211.091.33 Are measurements within 10%?lower limit upper limitElevation_______ * 0.9 =________ * 1.1 =________Elevation_______ * 0.9 =________ * 1.1 =________Elevation_______ * 0.9 =________ * 1.1 =________1.211.091.334.243.051.191.19 91 Figure Calculating reach elevation change using three shots. When the first two measurements are not within ±10% threshold, calculate elevation change a third time.In this example the first elevation change measurement was 2.65m. The ±10% limits were calculated. The 2elevation change was 2.37m, which is outside the 10% threshold, so a 3rd elevation change w

94 as calculated. NOTE that elevation chan
as calculated. NOTE that elevation change measured uphill (from BR to TR) is recorded on the top of the form, and elevation change measured downhill is recorded on the bottom of the form. BR TR 1.54m0.36m0.75m0.54m1.48m0.22mShot 3Shot 2Shot 1 BR TR 1.54m0.36m0.75m0.54m1.48m0.22mShot 3Shot 2Shot 1 DO NOT erase on this formIf more than 5 shots are required, continue on additional sheet(sElevation 1Elevation 2Elevation 3 Shot 1Shot 2Shot 3Shot 4Shot 5Measuring elevation change: starting from Bottom of Reach, shooting upstream TR Sum of Dif(Dif 1+Dif 2…) Dif 1 Dif 2 Dif 3 Dif 4 Dif 5 AB Shot 1Shot 2Shot 3Shot 4Shot 5Measuring elevation change: starting from Top of Reach, shootingdownstream Sum of Dif(Dif 1+Dif 2…) Dif 1 Dif 2 Dif 3 Dif 4 Dif 5 ABTR Elevation 1Elevation 2Elevation 31.540.361.180.750.210.541.481.260.222.651.770.671.100.630.300.331.560.361.202.631.490.411.080.640.480.161.420.291.132.37 Are measurements within 10%?lower limit upper limitElevation_______ * 0.9 =________ * 1.1 =________Elevation_______ * 0.9 =________ * 1.1 =________Elevation_______ * 0.9 =________ * 1.1 =________2.652.392.92DO NOT erase on this formIf more than 5 shots

95 are required, continue on additional she
are required, continue on additional sheet(sElevation 1Elevation 2Elevation 3 Shot 1Shot 2Shot 3Shot 4Shot 5Measuring elevation change: starting from Bottom of Reach, shooting upstream TR Sum of Dif(Dif 1+Dif 2…) Dif 1 Dif 2 Dif 3 Dif 4 Dif 5 ABAB Shot 1Shot 2Shot 3Shot 4Shot 5Measuring elevation change: starting from Top of Reach, shootingdownstream Sum of Dif(Dif 1+Dif 2…) Dif 1 Dif 2 Dif 3 Dif 4 Dif 5 ABABTR BRTR Elevation 1Elevation 2Elevation 31.540.361.180.750.210.541.481.260.222.651.770.671.100.630.300.331.560.361.202.631.490.411.080.640.480.161.420.291.132.37 Are measurements within 10%?lower limit upper limitElevation_______ * 0.9 =________ * 1.1 =________Elevation_______ * 0.9 =________ * 1.1 =________Elevation_______ * 0.9 =________ * 1.1 =________2.652.392.92 Are measurements within 10%?lower limit upper limitElevation_______ * 0.9 =________ * 1.1 =________Elevation_______ * 0.9 =________ * 1.1 =________Elevation_______ * 0.9 =________ * 1.1 =________2.652.392.92 92 EXAMPLE 3: Measuring reach elevation change with multiple shots: how to compensate for shots with negative elevation change.In some situations you will hav

96 e a shot with a negative elevation chang
e a shot with a negative elevation change, shot 2 inthe following example (Figure ). It is critical to record the numbers in the appropriate area on the formas shown in the previous examples. This way, the negative elevation change will be accurately recorded.Figure Measuring reach elevation change with multiple shots. In this example shot 2 has a negative elevation change. BR TR 2.75m0.65m0.20m0.88m1.48mTR0.22mShot 2Shot 1Shot 3 BR TR 2.75m0.65m0.20m0.88m1.48mTR0.22mShot 2Shot 1Shot 3 Elevation 1Elevation 2Elevation 3 Shot 1Shot 2Shot 3Shot 4Shot 5Measuring elevation change: starting from Bottom of Reach, shooting upstream TR Sum of Dif(Dif 1+Dif 2…) Dif 1 Dif 2 Dif 3 Dif 4 Dif 5 AB 2.752.10.650.20.680.881.481.260.222.68 Elevation 1Elevation 2Elevation 3 Shot 1Shot 2Shot 3Shot 4Shot 5Measuring elevation change: starting from Bottom of Reach, shooting upstream TR Sum of Dif(Dif 1+Dif 2…) Dif 1 Dif 2 Dif 3 Dif 4 Dif 5 ABAB 2.752.10.650.20.680.881.481.260

97 .222.68 93 REFERENCESBauer, S. B.; B
.222.68 93 REFERENCESBauer, S. B.; Burton, T. A. 1993. Monitoring protocols to evaluate water quality effects of grazing management of Western rangeland streams. U.S. Environmental Protection Agency, Seattle, WA.Harrelson, C. C.; Rawlins, C. L.; Potyondy, J. P. 1994. Stream Channel Reference Sites: An Illustrated Guide to Field Technique. Gen. Tech. Rep. RM245. U.S. Department of Agriculture, Forest Service, Rocky Mountain Forest and Range Experiment Station, Fort Collins, Colorado. 61pp.Hankin, D. G.; G. H. Reeves. 1988. Estimating total fish abundance and total habitat area in small streams based on visual estimation methods. Canadian Journal of Fisheries and Aquatic Sciences. 45:834Hawkins, C.P.J. Ostermiller, J.;Vinson, M.R.J. Stevenson, R.J.and J. Olsen, J.2003. Stream algae, invertebrate, and environmental sampling associated with biological water quality assessments: filed protocols. Department of Aquatic, Watershed, and Earth Resources, Utah State University, Logan, UT 843225210. Kershner, J. L.; ColesRitchie, M.; Cowley, E.; Henderson, R. C.; Kratz, K.; Quimby, C.; Ulmer, L. C.; Vinson, M. R. 2004. A Plan to Monitor the Aquatic and Riparian Resources

98 in the Area of PACFISH/INFISH and the B
in the Area of PACFISH/INFISH and the Biological Opinions for Bull Trout, Salmon, and Steelhead. Gen. Tech. Rep. RMRSGTRU.S. Department of Agriculture, Forest Service, Rocky MountainResearch Station, Ogden, UT.Lisle, T. E. 1987. Using “Residual Depths” to Monitor Pool Depths Independently of ischarge. Research Note PSWm USDA, Forest Service, Pacific Southwest Forest and Range Experiment Station, Berkeley, California.Moore, K.; Jones, K; Dambacher, J. 2002. Methods for Stream Habitat Surveys. Oregon partment of Fish and Wildlife, Aquatic Inventories Project, Natural Production Program,Corvallis, Oregon.Platts, W.S., C. Armour, G.D. Booth, M. Bryant, J.L. Bufford, P. Cuplin, S. Jensen, G. W. Lienkaemper, G.W. Minshall, S.P. Monsen, R.L. Nelson, J.R. Sedell, amd J.S. Tuhy. 1987. Methods for Evaluating Riparian Habitats with Applications to Management. Intermountain Research Station General Technical Report INT221. 177 pages.Rosgen, Dave L. 1996. Applied River Morphology. Wildland Hydrology, Pagosa Springs, Colorado. U.S. Department of Agriculture, Forest Service. 2005. Effectiveness monitoring for streams and riparian areas within the Pacific Northwest :

99 stream channel methods for core attribu
stream channel methods for core attributes. Unpublished paper on file at: http://www.reo.gov/monitoring/watershed.htmor http://www.fs.fed.us/biology/fishecology/emp.htm. 18 p.U.S. Department of Agriculture, Forest Service, Region 5. 1998. Stream Condition Inventory Guidebook. Version 4.0.U.S. Department of the Interior, Fish and Wildlife Service. 1998. Endangered and Threatened Wildlife and Plants: Determination of Threatened Status for the Klamath River and Columbia River Distinct Population Segments of Bull Trout Final Rule. Federal Register June 10, 1998 (Volume 63, Number 111, Pages 316471674) 50 CFR Part 17, RIN 1018AB94.Wolman, M. G. 1954. A method of sampling coarse riverbed material. Transactions of the American Geophysical Union 35:951 94 APPENDIX A: Stream Data Logger TroubleshootingTroubleshootingIf the data logger locksup and nothing works here is what you do.Performing a hard reboot of the logger should correct any minor glitch. The easy way to reboot the logger is:old the on/off key for 10 secondsWhen the screen goes blank the logger is rebooting. Wait for the logger to reload the operating system and software. Alternative reboot procedure. Some

100 times the reboot will fail if the batter
times the reboot will fail if the battery has low power. If the above does not work try again like this:Open the rear panel where the battery isisconnect the battery for 10 seconds econnecting the battery Connect the Logger to a plugged in power cord Press the onoff keyWait for the logger to reload the operating system and software. If the easy way doesn’t work and the alternative does, then you need to let the battery recharge for a while. If neither of the above works make sure you check in and report the issue to the hotline. Backing Up DataThere is an icon on the desktop called ‘backup’ or in some cases ‘short cut to backup’. Simply double click on thisicon to back up all records to a storage card. You cannot restore data in the field.Contact the hotline for further trouble shooting assistance 95 APPENDIX : SamplingSiteswithBeaver ActivitySafety First! Please be careful walking around beaver dams!Why do beaver dams matter?PIBOEMP is attempting to assess changes in stream habitat and riparian vegetation due to beavers. Your supervisor will tell you if you are going to sample a reach with beaver dams, howeverbeavers may have moved in

101 after th site was scouted. SettingYour
after th site was scouted. SettingYour ReachFollow normal reach set up & sampling procedures with the following exceptions:Placing Transect Flags in Beaver PoolsPlace transect flags perpendicular to the beaver pool’s thalweg if you can identify it (A in Figure If you cannot locate the beaver pool’s thalweg, place transect flags perpendicular to the beaver pool’s center line (B in Figure Figure Depiction of reach with beaver dams. In beaver pool A, transects are placed perpendicular to pool’s thalweg. In beaver pool B the thalwegcannot be located, so transects are placed perpendicular to the pool’s center line.Placing Transect Flags: Side Channels Flow BR TR T1 T2 T4 T3 T10T11T12T13T14T15T16T17T18T19T20T21T22 A. Thalweg B. Center line Flow BR TR T1 T2 T4 T3 T10T11T12T13T14T15T16T17T18T19T20T21T22 A. Thalweg B. Center line 96 There are often ‘weird’ side channels beside and downstream frombeaver damsollow normal procedures for determining if measurementsare taken in the side channels(see ‘Side Channels’ section of protocolpg REMEMBER: A side channel, even a flowing channel, must have a streambed that has 50% vegetat

102 ive cover throughout its entire course.
ive cover throughout its entire course. If at any point the channel has ≥50% vegetative cover, do not take measurements within it. For example, if a beaver dam results in water flowing over terrestrial vegetation, do not record measurements there.Sampling Beaver Impacted Sites Disturbance Beaver: % reach impacted N Y* Low Med High Y* = evidence of beaver, but no dams within reach Figure 47. Excerpt from Form 1.Record % of Reach ImpactedN = no beaver dams within reach, and no evidence of beavers within the reach, 10m from stream channel on either bank = evidence of beaver within the reach or on the streambanks with 10m of reach, but no dams within reachLow if about 040% of the reach is impacted by beaver i.e. dams, pools, beaver glides. Medium if about 4060 % of the reach is impacted by beaver High if about 60100% of the reach is impacted by beaver Conductivity Measure water chemistry at the bottom of the reach, not the top of reach If there is a beaver dam / pool at BR, measure water chemistry below the dam / pool even if it is downstream from the reach.Reach MapDraw a new mapIn addition to normal proceduresd

103 raw and labelbeaver dams, beaver pools,
raw and labelbeaver dams, beaver pools, and beaver side channelsUTM Coordinates:follow standardprocedures 97 MacroinvertebratesCollect macroinvertebratedownstream, but in close proximity to dams. If your reach doesn’t fit into one of the following scenarios perfectly, do the best you can!Locate the most downstream beaverimpacted area within the reach and take samples downstream from this location.If there are 4 or more riffles in between the BR and the first beaver impacted area, collect 8 samples within the first four riffles downstream from the impacted area.If there are between 1 and 3 riffles between the most downstream beaverimpacted area and the BR, evenly distribute your 8 samples within the available riffles If there are no riffles between the BR and the most downstream beaver impacted area, or the BR is impacted by beavers:Collect 8 samples from the 1four riffles downstream from BR.Evenly distribute samples in riffles found within 50m downstream from the impacted area. Select the optionwhich results in samples being collected closestto the beaver impacted area. Streambank measurements, crosssections, bankfull widths, pebble counts, large woodFoll

104 ow normal procedures in unimpacted areas
ow normal procedures in unimpacted areasWithin beaver pools/ impacted areasUse normal procedures when possibleThese measurements arebased off of bankfull. If bankfull cannot be located or is underwater, then use water’s edge for determining:pper limit of bank angle and stability plotsoundaries for establishing crosssections, measuring bankfull widths, collecting pebbles, ermining if wood qualifiesChange in elevationMeasure elevation change Write a comment on Form 1 and in the logger is there is a beaver dam or pool impacting the BR and / or TR 98 Temp probeocate the most downstream beaverimpacted area within the reach and place temp probedownstream from this locationExamine Figure you would ideally place your probe transect 4 or 5. Question: ‘What if there is a beaver pool at my BR extending downstream?’ Answer: Place probe downstream of your reach, make sure the probes location is clearly identified on probe form. Pool tail finesDon’t measure pool tail fines at dam poolsPhotosIn addition to standard procedures, do the following: Repeat all photos The stream looks dramatically different, stream is difficult to wade, your transect number

105 s may not correspond to the OLD transect
s may not correspond to the OLD transectnumbers.Do your best!Even if the location is now in a beaver pool, or conversely if the photo was in a beaver pool and now the pool / dam is now goneMaintain consistent names ith old photos. For example, the ‘misc stream 3’ photo you are provided with is from a location that is now in a beaver pool. Retake the photo the best you can and label it ‘misc stream 3’.Conversely, if you are provided with beaver dam 1 photosbut the dam is gone, retake the photos as well as you can and label them ‘beaverdam 1’ Take these additional photos: The following photo descriptions are in the logger, write them on form 4 beside ‘misc stream’ photos.cord transect (rod location), camera facing, distance and bearing to rod at each photo. of Beaver pool Top of Beaver pool Take photographs of the top of the beaver pools looking both upstream and downstream.Use the ‘criteria for determining the upstream boundary of beaver pools to locate these positions.Hold the rod on either bank at the upstream end of the beaver impacted area(s). 99 Take the photographs parallel to the channel at a distance that a

106 llows you to see as much of the beaver p
llows you to see as much of the beaver pool as possible. Beaver dam and Beaver dam Take photographs of the dam(s) looking both upstream wnstream.Hold the rod on / beside the dam.Take the photographs parallel to the channel at a distance that allows you to see as much of the dam as possible. Beaver pool overview Take at least one overview photo of each beaver pool / impacted area.These photos should be taken from a location where the greatest extent of the beaver pool(s) can be observed.This is often a hillside or terrace. Sometimes this is a difficult shot, try your best.Pools Disregard standard criteriawhen evaluating a beaver pool Beaver pool criteriaBeaver pools are areas where a beaver dam is slowing down and backing up water.The dam does not have to be actively maintained.he pool tail is the beaver dam.Determine the upstream boundary of beaver pools using the following criteria aboveFigure How to measure beaver poolsFormation = beaverFull or partial: follow standard proceduresLength: measure the beaver pool’s length along the thalweg. If you cannot locate the thalweg, measure along the beaver pool’s center line.Max depth:Measure the maximum depth

107 . Estimate if the pool is too deep or da
. Estimate if the pool is too deep or dangerous. If you estimate max depth, enter the comment, ‘maxdeptestimated’Pool tail depth: enter ‘0’Large wood in poolsFollow normal procedures when possible 100 Beaver Pool: Side ViewBeaver Pool: Top View Riffle / Run Dam Above Beaver Pool Beaver Pool: Side ViewBeaver Pool: Top View Riffle / Run Dam Above Beaver Pool Determining whether or not large wood qualifies requires identifying bankfull. If bankfullcannot be located or is underwater in beaver impacted areas, use water’s edge instead.Beaver Pools:Upstream of Beaver Pools:zero water velocityFlowing waterWide wetted width‘Normal’ wetted width Elevationally belowElevationally above beaver dam heightbeaver dam heightFine substrate‘Normal’ substrateLevel water surfaceIs best indicator!Figure Top and side views of a beaver pool and how to distinguish the upstream boundary.Cross Sections Identify and record cross sections that fall in beaver pools. Enter beaver pool for the habitat type when recording cross sectionsTransects Identify and record transects that fall in an area geomorphology altered by beaver. Enter yes in th

108 e beaver impacted section of the logger.
e beaver impacted section of the logger. 101 APPENDIX CSampling When There Isn’t Flowing Water throughoutthe SiteThis appendix provides additional sampling instructions for sites that don’t have waterflowing throughout the reachThese sites fit into 2 categories (recorded on Form 1and in the logger) No flow (completely dry):there is no water within your reach it is ‘bone dry’ Other (make detailed comment):this can describe a wide variety of flow conditions, so please write a thorough, detailed comment on Form 1and in the logger. Make a comment explaining ‘weird’ flow issues. For example: ‘partial flow in reach. Water was flowing from BR to transect 12, US from transect 12 to TR, there was water in pools, but no flowing water’. In this example you would measure pools between BR and transect 12 only.In general, samplenormally with the following exceptions:No flow (completely dry)s means the reach is bone dry Can’t measure ater chemistry Can’t collect acroinvertebrates LEW / REW measurements when doing cross sections. You cannot use the ‘water’ method Can’t quantify ools(consider the entire rea

109 ch a rifflerun) Measure elevation change
ch a rifflerun) Measure elevation changeby holding stadia rod in line with BR / TR, at the channel’s deepest location Other’ flow: the reach doesn’t have water flowing throughout but is not completely dry Measure ater chemistry. Measure in flowing water near the TR, otherwise, measure it in any flowing water. If the isn’t any flowing water, measure it in stagnant pools. Comment where water chemistry was measured. Collect acroinvertebrateThe rule is,if there is enough water in any part of the reach to move bugs into the net, collect them those areas Cross sectionsquantify LEW / REW measurements at cross sections with water, even if it isn’t flowing. 102 Pools: Measure all qualifying pools that have water (even a trickle) flowing into and out of them. Don’t measure stagnant pools. If there is not flowing water at the BR and / or TR, position the stadia rod in line with BR / TR, at the channel’s deepest location when measuring elevation change Where to start / stop: OLD Sitesuse normal procedures, start and end at the old BR / TR.NEW Sites: follow scout’s instructions regarding BR location. If there is not flowing

110 water, the TR will be transect 21If ther
water, the TR will be transect 21If there is flowing water at the TR, use normal procedures (page 9APPENDIX D: Scouted DMA iteome DMA sites you sample may not have been scouted; if this is the case ysupervisor will provide you will information about how to locate each unscouted DMA.DMAsite locations are preselected and you will be given UTMs andor directions to locate them.Often DMA sites are marked with a green Tpost, but you will not always be able to find one.DMA sites may be up or downstream of Tposts, this information should be provided to you.DMA sites are exempt from criteria used to select integrator sites. This means a DMA might have high gradient, numerous side channels, tributaries, etc.All DMA’s are sampled using 6m transect spacing, so siteswill be ~120 m lo 103 Appendix E: Placing Instruments (Hobo and Cow Cam) Special situationsappendix B has instructions for placing temp probes in beaver impacted sites Temperatureloggers (a.k.a. Hobowill be placed all Integrator sitesbeforeJuly 15The main objective is to place the logger in the stream where it will be submerged all summer collecting accurate temperature data until a technician comes back t

111 o retrievethe logger in the fall.Your ob
o retrievethe logger in the fall.Your objectives:Place temp probeRecord info about temp probes on back of ‘Site Revist’ or ‘Site Scouting’ form.Temp probe placement considerations:There are many things to consider when placing the probe: Place probes in / near the thalweg, not in backwaters or eddies High flowsAttachtemperatureloggerto something secure (ex: tree trunkroot wad, etc) that won’t wash away in high flows. Low flowsou don’t want thetemperature loggerin too shallow area that may not have water at a later date. Use rocks to hold probein place if necessary; place the rocks on the cable not the probe, if the flow drops, the rocks can absorb heat amouflage probes in high traffic areas. Use grass, dirt, moss to conceal the wire if you are placing probein a high traffic area.The better you hide the probe, the betteryour map and description need to be Avoid areas just downstream of tributaries and obvious groundwater seeps, as water temperatures in these areas will not be representative of the stream temperature. 104 ecording Info about Temp ProbesPlace BLUE flagging with ‘PIBO HOBO’ written on it with a sharp

112 ie.Place the flagging somewhere close to
ie.Place the flagging somewhere close to the hobo, but not at the exact location to avoid drawing attention from people.Record the Group,Order, reach type, stream name, Region, your name, Forest, District, State, and County in the spaces provided on the back of the scouting sheet. Record the Hobo number carefully and check to make sure it is correct, and check again Record the date the Hobo was placed in water.Record the location of the Hoborelative to the blue Hobo flagging (direction and distance).Record the location of the Hobo relative to the bottom of the reach.Is the Hobo on River Right or River Left?Use landmarks (e.g. wire attached to roots of enormous Ponderosa Pine, logger hidden underneath undercut bank).Record UTM coordinates for thehandheld GSP unit Record a detailedwritten description of the location of the Hobo (e.g. The Hobo is located ~5m upstream from the bottom of the reach on river right. The Hobo is attached to a piece of LWD (~15cm diameter) and is tucked underneath the . The cable is covered with moss.). Draw a detailedmap of the hobo location so we can efficiently relocate them during retrieval. Use pencil and depict at least 2030m of th

113 e stream. Includethe Hobo, direction of
e stream. Includethe Hobo, direction of flow, North arrow, flagging, and any features that will help to quickly relocate the logger (i.e. if the bank is covered by alders, don’t just draw alders on the map without additional detail). 105 Placing a Cow Camera The Cow Cam/Plant Cam will be placed at several DMA sites that will have both EM and IM performed during the field season. The main objective is to place the camera as perpendicular to the reach as possible with a view of as much of the reach as possible. The camera will take a photo every 15 minutes from 5am to 11pm.Objective:Set Cow Cam controlsPlace Cow CamRecord info about Cow Cam and location on the Instrument Form.Enter the Camera Settings:Add 4 AA Lithium Titanium batteries to the camera. Do not use any other type of battery.Check that the camera is loaded with a 16GB memory card labeled with the Camera Number. Do not use a smaller memory card and do not leave without labeling the card. Each camera has its own memory card which has space for 12,000 photosand they should never be separated.Open the front panel of the camera to access the settings.Turn the rotary dial with an arrow on it to SETU

114 P.Press and hold the Power/Status button
P.Press and hold the Power/Status button. The SETUP MENU window will appear in the LCD display.The menustarts with TIME LAPSE INTERVAL. Use the +/button and SELECT button to select 15 MIN. Press the RIGHT (�) button to move to the next setting. Use the +/button to choose PHOTO. Press RIGHT (�).Use the +/button to choose HIGH photo quality. Press GHT� ().Use the +/button to choose 1SHOT. Press RIGHT (�).Use the +/button to choose 5 A.M. DAILY WAKEUP. Press RIGHT� (). 106 Use the +/button to choose 11 P.M. DAILY SLEEP. Press RIGHT� ().Use the +/button to choose YES for IMPRINT INFO. Press RIGHT� ().Press the SELECT button and the month will flash. Use the button to choose the month, press SELECT to select that month. Repeat until the date and time are set. Press RIGHT� ().Set the CAMERA NAME. Press SELECT. Use the +/button to choose the first character then press SELECT to select that character. Name the camera by the GROUPORDERTYPE of the stream. For example 123Set the focus dial around the lens to 3+ feet.That is all you need to do to configure the camera’s settings. Establish the best location for th

115 e camera at the site:The best location f
e camera at the site:The best location for the camera is where it can record as much of the reach as possible looking perpendicular to the streamFind an appropriate treeApproximately half way between the BR and TRA distance away from the stream where the camera can see all of the reachMedium diameter where the camera can be attached to the trunk or branchesPotentially discreet area where the camera will not be easily seen by passersbyAt a site with no appropriate trees:Find a good location using criteria aboveDrive a Tpost into the ground at least 18in.PlacementSecure the camera to the tree or TpostUse the webbing, elastic straps, zip ties, electrical tape 107 Make sure the control panel is accessible without moving the cameraAim the camera to view as much of the reach as possibleRecord Plant Cam information on Instrument Form:Completely fill out the required areas of the form BEFORE YOU LEAVE THE SITE.Fill out the topportion of the form with location info.Circle “Plant Cam” in the box and make sure the instrument ID# is entered correctly.No Flagging information is required. Write a detailed description of the Camera location.Ex: “The Camera is o

116 n a large conifer tree 100m upslope from
n a large conifer tree 100m upslope from the stream located ~25m US from the BR.”Draw a detailed map of the Camera location so we can efficiently relocate them during retrieval. 108 Appendix F: Aquatic Invasive ProtocolInvasive species pose a threat to biological diversity. PIBO’s spatial scale offers an opportunity to detect the spread of aquatic invasive species in the Columbia and Missouri river basin. That being said PIBO crews also pose a potential threat as a vector by which aquatiinvasive could be transported. According to the literature most likelymechanism for spreading invasive species is contaminated equipment. Following is our collection protocols for aquatic invasive species seeAppendix G for our gear econtaminationprotocol.Collection and recoding of aquatic invasive species: If you find oneany of the following aquatic invasivein your bug sample or during any other sampling task such as collecting pebbles, cross sections, etc… collect an additionalspecimen. Do not mix your invasive samples with your marcoinvertebrates samplesStore the specimen according to the PIBO protocol for macroinvertebrate samples (page ), include on the lab

117 els “invasive sample” see Figu
els “invasive sample” see Figure on Form 1 make a commentmark the number of invasive samples collected in the logger. The number of bug jars on Form 1 and in the logger will not change. At the end of hitch record on the macroinvertebrate summary sheet the number of aquatic invasive samples collected at each reach. At the bunkhouse place the specimen in a box designated by your supervisor for aquatic invasive specimens. Do not mix your invasive samples with your marcoinvertebrates samples.Figure Example of aquatic invasive label. Reach ID:15012 Jar # Stream Name:Big Ramey CrINVASIVE SAMPLE Date:06/15/05 109 PIBO is focusing on the following aquatic invasivefound in the river systems of our study area Crayfish: Collect all crayfish because they can be difficult to identify in the field. Figure Descriptions of crayfish found in the PIBO study area. Collect all crayfish to eliminate incorrect identification in the field. 110 Didymosphenia geminata: “didymo” or “rock snot”D. geminate is a freshwater alga found in North American streams and rivers. It forms a mat of alga covering the stream bed. ollect a sample if fou

118 nd in the reach so the specimen can be v
nd in the reach so the specimen can be verified in Logan. Field descriptions according to the EPA: In the field, D. geminata can be easily confused with other stalkforming diatom species. In particular, the visual appearance of D. geminata is very similar to its closest relatives, Cymbella mexicana and C. mexicana var. janischii. However, D. geminata isistinctive to the touch. When D. geminata stalks are pulled apart, there is someresistance and the stalks feel like wet cotton balls. Other diatom species have no suchresistance, and they are slimy and slippery when the stalks are pulled apart.The field identification of D. geminata can be divided into four stages ofcolony growth and appearance:Initial colony growthAs the diatom cells attach to a rocky (or other)substrate and begin to produce stalks, the colonies appear as small, circular clumps that range from 2 10 mm. The growths are visible to the naked eye, and are light tan to brown in color. The clumps are soft and feel like a cotton ball when they are pulled apart. They are not slimy or slippery. This stage is commonduring the late winter or following periods of high flow, but can occur at any time of year, de

119 pending on the region.Colony expansionAs
pending on the region.Colony expansionAs the colonies grow, they merge together and may cover the substrate completely. Colonies attached to plant stems form ropelike strands. As several small colonies coalesce and stalk production increases, the clumps become thicker. The colonies are frequently 12 cm in thickness, but may be greater. The coverage on the streambed may be patchy, or the substrate across a transect may be completely covered. 111 Stalk proliferationUnder periods of low flow or with favorable growth conditions, the colonies have the opportunity to form blooms. The cells produce excessive amounts of stalk many times the length of the microscopic cells. As the stalks lengthen, they form ropy strands and are white in color. Some reports describe the strands as tissue, fiberglass, toilet paper, or sheepskins.Colony senescenceAlthough the cells may die, the stalks persist on the stream substrate or stranded above the stream wetted zone. The stalks may persist for 2 months, or more. Stalks may change in color as they trap fine sediment and dry. The microscopic cells may no longer be living, or present, in the aging stalk masses. 112 Potamopyrgus ant

120 ipodarum: New Zealand mudsnail Field Ide
ipodarum: New Zealand mudsnail Field Identification: Potamopyrgus antipodarum is usually 4 to 6 mm. Shell color vary from gray to dark brown to light brown. They have elongated shells with 78 whorls separate by deep groves. http://nas.er.usgs.gov/queries/factsheet.aspx?SpeciesID=1008 , May 2012) Figure Potamopyrgus antipodarum, New Zealand MudsnailReferences A rough field guide for identification of D.geminata.EnvironmentalProtection AgencyRegion 8. www.epa.gov/region8/water/didymosphenia/didymo_field_guide.pdf. Viewed 10 May 2012. Crayfish Found In Oregon. State of OregonDepartment of Fish and Wildliwww.dfw.state.or.us/conservationstrategy/invasive_species/docs/Crayfish_Comparison.pdRevision October 2011. Viewed 10 May 2012. Benson, A.J., R.M. Kipp, J. Larson, and A. Fusaro. 2012. Potamopyrgus antipodarum. USGS Nonindigenous Aquatic Species Database, Gainesville, FL. http://nas.er.usgs.gov/queries/factsheet.aspx?SpeciesID=1008 Revision Date: 2/15/2012Viewed 10 May 2012.Spaulding SA and Elwell L. 2007. Increase in nuisance blooms andgeographic expansion of thefreshwater diatom Didymosphenia geminata: recommendations for response. Denver, CO: USEnvironmental Prote

121 ctionAgency Region 8. Open File Report14
ctionAgency Region 8. Open File Report1425. www.epa.gov/region8/water/didymosphenia/. ViewedMay 2012 113 Appendix GGear DecontaminationObjectiveprevent the spread of invasive species (namely New Zealand Mud SnailWhirling disease,anddidymoGear MUST be decontaminated after every sample, before you leave the site!Gear includes bug net, waders, boots, pool tail fines grid, tape, anything that comes in contact with the water. Equipment and Procedure:Safety: When handling Sparquat 256, be sure to use proper personal protective equipment (rubber gloves and protective eyewear).1. Use a scrub brush to remove all visible mudorganic material from boots and waders before decontamination.2. Use the large Rubbermaid Roughtote provided to make a solution of Sparquat 256 that is at least 4.7%. To do this, fill the Roughtote with 6 gallons of water and add 36oz. of Sparquat (or 6oz. of Sparquat 256 for every gallon of water).3. Soak any gear items that have been in contact with the water for at least 10 minutes. For example waders, boots, bug nets, pool tail fine grids4. When decontamination is complete, put the used Sparquat 256 solution back into the labeled 7gal Aquataine

122 r and rinse the waders, boots, and other
r and rinse the waders, boots, and other gear with water.5. Determine if the Sparquat 256 solution may be reused. To check for potency, Use the “Quat Check 1000” test strips that have been provided. When the test stripreads below 600 ppm, you need to make a new solution.Discard the Sparquat solution when it is no longer effective, it will need to be discarded down a drain that flows to a treatment facility.TIP: Gear should be decontaminated by one crew member whileanother crew member fills out forms, and enters data into the logger, etc.NOTE: A Material Safety Data Sheet for Sparquat 256 can be found in the Manual of Manuals (MOM).Preventing spread of invasive plantsAfter each hitch wash your truck at the bunkhouse using the power washer. Pay close attention to the wheel wells and undercarriage. If youtruck get especially muddy on hitch and you are going to a new group. If iis convenient, meaning the car wash in on your giveroute, take the time toer wash the wheel wells and undercarriage thoroughly 1 14 Equipment List Item Qty. Item Qty. Sampling Action Packer 1 Camping Gear Flags – stream 60 Prop ane St

123 ove w / Hose 1 Flags – veg
ove w / Hose 1 Flags – veg 20 Propane Tank 1 Blue pool flags 20 Table 1 Bleach Spray Bottle 1 Chairs 3 Bleach Bottle 1 Tent - 3 person 1 Bug Net 1 Tarp 1 Bug Spray Bottle 1 Water jug 5 gal. 2 Pool Tail Fines Grid 1 Cooler 1 Pool Tail Fines Viewer 1 Conductivity Meter 1 Kitchen Gear Clipboard w/ complete set of waterproof forms. 1 Plates, Bowls, Glasses, Forks, Spoons, Knives 3 each Field Vests 1 Can Opener, Cutting Board, Cutting Knife, 1 each Data Logger 1 Spatula, Serving Spoon, 1 each Extra logger battery 1 Dish soap & Sponge 1 each Logger car charger 1 Stock Pot 1 Logger wall charger 1 Saucepan 1 Compass w/ compass 2 Skillet 1 Survey Level 1 Level Tripod 1 Back of Truck Stadia Rod 1 1.5 m staffs w/ cm increments 2 Hand Level 1 Yardstick for Veg. Work 1 Tape - 50 m 1 Backpacks 3 Tape - 30 m 1 GPS Unit w/ case 1 Safety Digital Camera w/case 1 Memory Flash Cards for Camera, 96 or 128 and 16 MB 2

124 Fire Extinguisher 1 NiMH Battery Ch
Fire Extinguisher 1 NiMH Battery Charger, AA / AAA 1 First Aid Kit - Hard Case 1 NiMH Rechargeable Batteries AAA 16 Shovel 1 Clear Plastic Ruler for Pebble Measure 2 Ax 1 Hand Calculator 1 Saw 1 Candy Canes 4 2 Gallon Bucket for Bugs 1 Crew Items White Pan for Bugs 1 Waders, Boots , Wader socks for each person 3 sets 500 um Sieve 1 Forceps 2 Plastic spoon 2 Macroinvertebrate Jar Labels 50 Bug Jars w/ lids 50 Repair Kit for Field Equipment 1 Backup Disposable Camera 2 Water Filter 1 115 Checklist for CrewBeginning of Hitch Electronics: Charged AA Batteries Charged Cell Phone Charged Satellite Phone Charged Data Logger Charged PDA with SD Card Charged Safety Beacon Charged Camera with SD Card GPS with Sites on SD Card Instruments (Hobo, Tidbit, Etc…) Calibrated Conductivity Meter Site Info: Hitch Summary Sheet All Folders from Hitch Summary Forest Map with Sites Gazetteers Instrument Forms Spare Forms Gear: Complete Stream Kit Complete Veg Kit

125 Sparquat Water Bear Spray Alcohol
Sparquat Water Bear Spray Alcohol Bug Jars and Bug Labels and Tape Newspaper and Unknown Labels Reach Markers and Nails To do: Sign Time and Travel Sheets Clean Bunkhouse Enter truck mileage Turn in this checklist - Initialed 116 End of Hitch To Do: Ensure ALL Forms are Complete Complete Photo Summary Sheet Complete Veg Summary Sheet Complete Macro Summary Sheet Enter ALL Data into Logger Enter ALL Data into PDA Enter Final truck mileage Clean, Organize and Re - Pack Truck Wash your truck with the power washer Replenish Blank Forms Replenish Expended Items Sparquat Waders and Gear Clean Cook - set Sign Time and Travel Sheets Place in Crew Bin: Hitch Summary Sheet Photo Summary Sheet Veg Summary Sheet Macro Summary Sheet Completed Site Folders Any Loose Forms or Data Sheets Truck Mileage Sheets Truck Gas Receipts GPS Data Logger PDA with SD Card Camera with SD Card Plant Specimens Turn in to Supervisor: Signed Time and Travel Sheets Missing & Lost Gear List Not - Completed Site Folders Full Bug Jars Full Invasive Species Jars Forest Maps