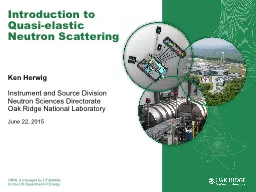
Neutron Scattering Ken Herwig Instrument and Source Division Neutron Sciences Directorate Oak Ridge National Laboratory June 22 2015 OUTLINE Background the incoherent scattering cross section of H ID: 778737
Download The PPT/PDF document "Introduction to Quasi-elastic" is the property of its rightful owner. Permission is granted to download and print the materials on this web site for personal, non-commercial use only, and to display it on your personal computer provided you do not modify the materials and that you retain all copyright notices contained in the materials. By downloading content from our website, you accept the terms of this agreement.
Slide1
Introduction to Quasi-elastic Neutron Scattering
Ken Herwig
Instrument
and Source Division
Neutron
Sciences
Directorate
Oak Ridge
National Laboratory
June 22, 2015
Slide2OUTLINE
Background – the incoherent scattering cross section of H
Neutrons and QENS
Experiment Design
Connection to Molecular Dynamics Simulations
The Elastic Incoherent Structure Factor (EISF)
The Role of Instrumentation
Restricted Diffusion Example – Tethered Molecules
References and Summary
Slide3Incoherent and Coherent Scattering
Origin – incoherent scattering arises when there is a random variability in the scattering lengths of atoms in your sample – can arise from the presence of different isotopes or from isotopes with non-zero nuclear spin combined with variation in the relative orientation of the neutron spin with the nuclear spin of the scattering center
Coherent scattering
– gives information on
spatial correlations and collective
motion.
Elastic: Where are the atoms? What are the shape of objects?
Inelastic: What is the excitation spectrum in crystalline materials – e.g. phonons?
Incoherent scattering
– gives information on
single-particles
.
Elastic: Debye-Waller factor, # H-atoms in sample, Elastic Incoherent Structure Factor – geometry of diffusive motion (continuous, jump, rotations)
Inelastic: diffusive dynamics, diffusion coefficients.
Good basic discussion:
“Methods of x-ray and neutron scattering in polymer science”, R.-J. Roe, Oxford University Press. (available)
“Theory of Thermal Neutron Scattering”, W. Marshall and S. W.
Lovesey
, Oxford University Press (1971). (out of print)
Slide4Neutron Properties – H is our friend!
Isotopic sensitivity of H
H has a large
incoherent
neutron scattering cross-section
H and D have opposite signed scattering lengths
D has a much smaller cross section
The signal from samples with H are often dominated by the incoherent scattering from H The Q and w ranges probed in QENS experiments is well-suited to the “self” part of the dynamic structure factor
Slide5Quasi-elastic Neutron Scattering
Why
Should I Care
?
A
pplicable to wide range of science areas
Biology – water-solvent mediated dynamics
Chemistry – complex fluids, ionic liquids, porous media, surface interactions, water at interfaces, claysMaterials science – hydrogen storage, fuel cells, polymers, proton conductorsProbes true “diffusive” motionsAnalytic modelsUseful for systematic comparisonsClose ties to theory – particularly
Molecular
Dynamics
simulationsComplementaryLight spectroscopy, NMR, dielectric relaxationUnique – Answers Questions you cannot address with other methods
Slide6A Neutron Experiment
Measure scattered neutrons as a function of
Q
and
w
S(
Q,
w). w = 0 elastic
w
≠ 0
inelasticw near 0 quasielastic
incident neutron
scattered neutron
sample
detector
Slide7Quasi-Elastic Neutron Scattering
Neutron exchanges small amount of energy with atoms in the sample
Harmonic motions look like flat background
Vibrations are often treated as Inelastic Debye-Waller Factor
Maximum of intensity is always at
w
= 0
Samples the component of motion along QLow-Q – typically less than 5 Å-1
Slide8Experiment Design
s
is the microscopic cross section (
bn
/atom) 10
-24
cm2/atom n is the number density (atom/cm3)S is the macroscopic cross-section (cm-1)
The transmission,
T
, depends on sample thickness, t, as:Good rule of thumb is T = 0.9
5 – 15
mmole
H-atoms for ≈10 cm
2
beam
(
BaSiS
, HFBS, CNCS, DCS)
Slide9An Example – Water
Ignore the oxygen contribution
Samples with a lot of hydrogen must be thin
Slide10QENS Spectra
(broadened by instrument resolution)
Slowest Time is set by the width of the instrument resolution
Fastest Time is set by the dynamic range of the instrument (
w
max
)
Slide11Incoherent Intermediate Scattering Function, S(
Q,
w
),
and Molecular Dynamics Simulations
Intermediate Scattering Function
time dependent correlation function
incoherent scattering –> no pair correlations, self-correlation functioncalculable from atomic coordinates in a Molecular Dynamics SimulationSinc(Q,w) – the Fourier transform of
I
inc
(Q,t)
TOOLS
nMOLDYN
:
http
://
dirac.cnrs
-orleans.fr
/
plone
SASSENA
: http://
www.sassena.org
Slide12QENS and Molecular Dynamics Simulations
Same atomic coordinates used in classical MD are all that is needed to calculate
I
inc
(Q,t)
1,3 diphenylpropane tethered to the pore surface of MCM-41
Slide132
p
/Q
The Elastic Incoherent Structure Factor (EISF)
A particle (H-atom) moves out of volume defined by 2
p
/
Q
in a time shorter than set by the reciprocal of the instrument sensitivity,
d
w
(
meV
) – gives rise to
quasielastic broadening.
The EISF is essentially the probability that a particle can be found in the same volume of space at some subsequent time and so depends on the size of the box (2
p/Q).
A
E
A
Q
EISF = A
E
/(A
E
+A
Q
)
Slide14QENS and Neutron Scattering Instruments
Probe Diffusive Motions
Length scales set by
Q
, 0.1
Å
-1
< Q < 3.7 Å-1, 60 Å > d
> 1.7
Å
– depends on l.Time scales set by the width of instrument energy resolution, typically at least 0.1 meV (fwhm
) but higher resolution -> longer times/slower motion
Energy transfers
~ ± 2
meV
(or less)
High resolution requirements emphasizes use of cold neutrons (but long l limits Q)Incident neutron wavelengths typically 4 Å to 12 Å (5.1 meV
to 0.6 meV)
Why a variety of instruments? (Resolutions vary from 1 meV to 100 m
eV)Energy resolution depends on knowing both the incident and scattered neutron energiesTerms in the resolution add in quadrature – typically primary spectrometer (before sample), secondary spectrometer (after the sample)
Improvement in each resolution term cost linearly in neutron flux (ideally)Optimized instrument has primary and secondary spectrometer contributions approximately equal
Factor of 2 gain in resolution costs at a minimum a factor of 4 in flux
Slide15Role of Instrumentation
Currently about 25 neutron scattering instruments in the world useful for QNS (6 in the U.S., including NSE)
U.S. instruments –
Opportunity is Good- Competition is High
NIST Center for Neutron Research
Disc Chopper Spectrometer
High Flux Backscattering Spectrometer
Neutron Spin EchoSpallation Neutron SourceBaSiS – near backscattering spectrometer (3.5 meV)
Cold Neutron Chopper Spectrometer (CNCS) (10 – 100
m
eV)Neutron Spin Echo (t to 400 nsec)
Trade
-offs
Resolution/count rate
Flexibility
Dynamic range
Neutron
l
vs Qlarge l
-> high resolution -> long times/slow motionslarge
l -> limited Q-range, limited length scales
Slide16Polymers and Proteins
Small Molecule Diffusion
The High-Resolution Neutron Spectrometer Landscape
Molecules in Confinement
Cold Neutron Chopper
Neutron Spin Echo
Backscattering
Colloids/Complex Fluids
Slide17Restricted Diffusion – Tethered Molecules
Pore Diameter (nm)
Coverage (molecules/nm
2
)
1.6
0.85 (saturation)
2.1
1.04 (saturation)
3.0
0.60
0.75
1.61 (saturation)
Samples – typical 0.7 g
240 K < T < 340 K
Simple Fit – Lorentzian +
d
MCM-41
MCM-41 (2.9 nm pore diameter) high DPP coverage
DPP
Slide18Elastic Scans – Fixed Window Scans
Pore Size Dependence
Coverage Dependence
Onset of diffusive and
anharmonic
motion (
T
T
)
Onset of diffusive motion giving rise to QENS signal (typically)
Slide19Elastic Scans(Fixed Window Scans)
T
T
No dependence on DPP surface coverage at 3.0 nm pore diameter (≈ 130 K)
196 K for 2.1 nm pore (maximum DPP surface coverage) – Deeper potential
Simulations indicate that at 2.1 nm (2.2 nm) DPP molecules adopt a conformation that has a more uniform density throughout the pore volume
Large pores have enough surface area for DPP to orient near the MCM-41 surface
1.7 nm
2.2 nm
2.9 nm
Slide20Simple Fit to data (HFBS – NCNR) 30 Å diameter pore, 320 K, Q = 1 Å
-1
-1
A
E
A
Q
EISF = A
E
/(A
E
+A
Q
)
Slide21EISF – 30 Å DPP sample, saturation
Non-zero asymptote implies immobile H-atoms
(on the time scale of this instrument)
f
m
1-f
m
Curvature determines
R
max
Slide22Lorentzian G(Q)
Non-zero intercept
Implies restricted/confined diffusion
Slide23Simple Analytical Model – e.g. Diffusion in a Sphere
Volino and Dianoux, Mol. Phys.
41
, 271-279 (1980).
2
r
EISF:
Slide24Extend to a Sum over Spheres of Varying Size (15 H-atoms)
Fits to Data
Fraction of DPP H-atoms moving on time scale of instrument
MCM-41
Slide25DPP – 29 Å diameter pores – 370 K (BaSiS
- SNS) – Beyond the EISF – Fitting the Model to the Full Data Set
Slide26RM – How extended is the motion?
R
M
decreases
with increasing pore diameter! (Molecules can interact with surface)
R
M generally is larger at higher DPP surface coverage (Molecules are excluded from surface)Small pores and high coverage tend to drive DPP into the pore center where there is more volume available for motion
b
-
cristobailite
Extended DPP
O – terminal H distance 12 Å
Partially folded DPP
O – terminal H distance 5.9 Å
3.0 nm
Maximal DPP coverage
Slide27DM – How fast is the motion?
D
M
increases with pore diameter while the radius decreases
Diffusion in the pore volume depends on how crowded it is
D
M
increases with surface coverage in large poresMore molecules are forced into the more open volume of the pore and away from the pore surface
3.0 nm
Maximal DPP coverage
Slide28Two Instruments – Two Resolutions – Two Dynamic Ranges – 3.0 nm 320 K
HFBS (1
m
eV
, ±17.5
m
eV
)BaSiS
(3
m
eV, -100 to 300 meV)E.J. Kintzel, et al., J. Phys. Chem. C 116, 923-932 (2012).
QENS
Slide29Two Instruments
Dynamics
Similar activation energies
Different magnitudes
Geometry – nearly identical – determined by intensity measurements
Slide30Example 2: Dendrimers – Colloidal Polymer – pH responsive
Dendrimers bind to receptors on HIV virus preventing infection of T cells. Sharpharpm
C & E News 83, 30 (2005)
“Trojan horse” – folic acid adsorbed by cancer cell delivering the anti-cancer drug as well
James R. Baker Jr., Univ. of Michigan Health Sciences Press Release
Slide31Molecular Dynamics Simulations
Acidic
Basic
SANS Results –
Global Size Constant, Redistribution of Mass
Samples: 0.05 gm
protonated
dendrimer
in 1 ml
deuterated solvent
Slide32Methodology
Determine center-of-mass translational motion with pulsed field-gradient spin echo NMR
Could have been determined directly from QENS measurement but this tied down parameter set
Measure (
dendrimer
+
deuterated
solvent) – (deuterated solvent) -> dendrimer signalVary pH to charge dendrimer amines (a = 0 (uncharged), a = 1 (primary amines charged), a = 2 (fully charged))
Slide33Localized Motion of Dendrimer Arms
Q = 0.5 Å
-1
Q = 1.3 Å
-1
Localized motion modeled as Diffusion in a Sphere
R ~ 2.8 Å,
a
independent
1.60 ± 0.03 10-10 m2/s
a
= 0
D
2.58 ± 0.03 10
-10 m2/s
a = 1
3.11 ± 0.03 10-10 m
2/s a = 2
Localized motion increases as amines are charged!
X. Li, et al, Soft Matter
7
, 618-622 (2011)
Slide34Reference Materials - 1
Reference Books
Quasielastic Neutron Scattering
, M. Bee (Bristol, Adam Hilger, 1988).
Methods of X-Ray and Neutron Scattering in Polymer Science
, R. –J. Roe (New York, Oxford University Press, 2000).
Quasielastic Neutron Scattering and Solid State Diffusion
, R. Hempelmann (2000).Quasielastic Neutron Scattering for the Investigation of Diffusive Motions in Solids and Liquids, Springer Tracts in Modern Physics, T. Springer (Berlin, Springer 1972).
Slide35Reference Materials - 2
Classic Papers
L. Van Hove
Phys. Rev.
95
, 249 (1954)
Phys. Rev.
95, 1374 (1954)V. F. SearsCanadian J. Phys. 44, 867 (1966)
Canadian J. Phys.
44
, 1279 (1966)Canadian J. Phys. 44, 1299 (1966)G. H. VineyardPhys. Rev. 110, 999 (1958)S. Chandrasekhar
“Stochastic Problems in Physics and Astronomy”, Rev. Mod. Phys.
15
, 1 (1943) (not really QNS but great reference on diffusion models)
Data Analysis – DAVE – NIST Center for Neutron Research
http://www.ncnr.nist.gov/dave/
Slide36SUMMARY
QENS is an excellent technique to measure diffusive dynamics
Length scales/geometry accessible through Q-dependence
Many analytic models form a framework for comparison and parametric studies
Large range of time scales ( sub-picosecond < t < nanosecond (100’s
nsec
for NSE)
H-atom sensitivity Instrument selection is a critical decision – the resolution must match the time scale of the expected motionWorld-class instrumentation is currently available in the U.S.Natural connection to theory (Molecular Dynamics Simulations)Analysis SoftwareDAVE at the NCNR at NIST – available from the NCNR Web site