PPT-Homework 2 Statistics Minimum Value
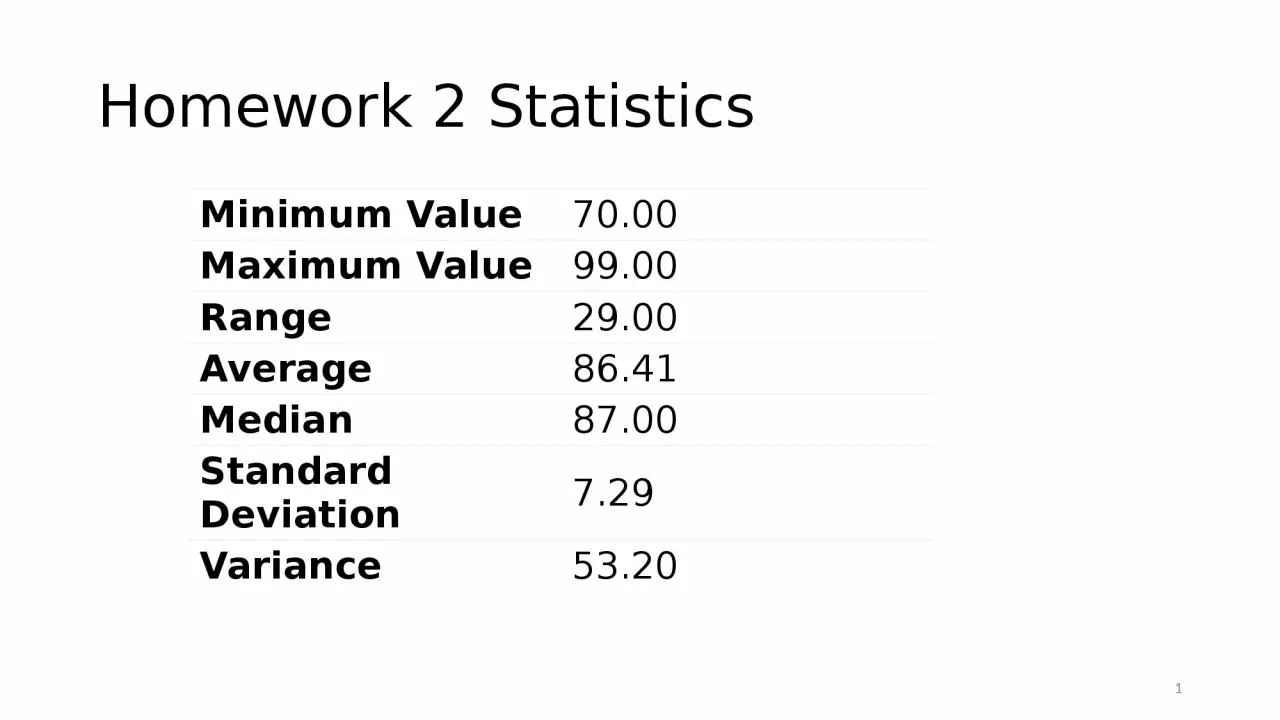
7000 Maximum Value 9900 Range 2900 Average 8641 Median 8700 Standard Deviation 729 Variance 5320 1 Midterm Exam Date Tuesday October 16th Time 3PM415PM in class
Download Presentation
"Homework 2 Statistics Minimum Value" is the property of its rightful owner. Permission is granted to download and print materials on this website for personal, non-commercial use only, provided you retain all copyright notices. By downloading content from our website, you accept the terms of this agreement.
Presentation Transcript
Transcript not available.