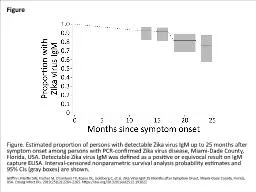
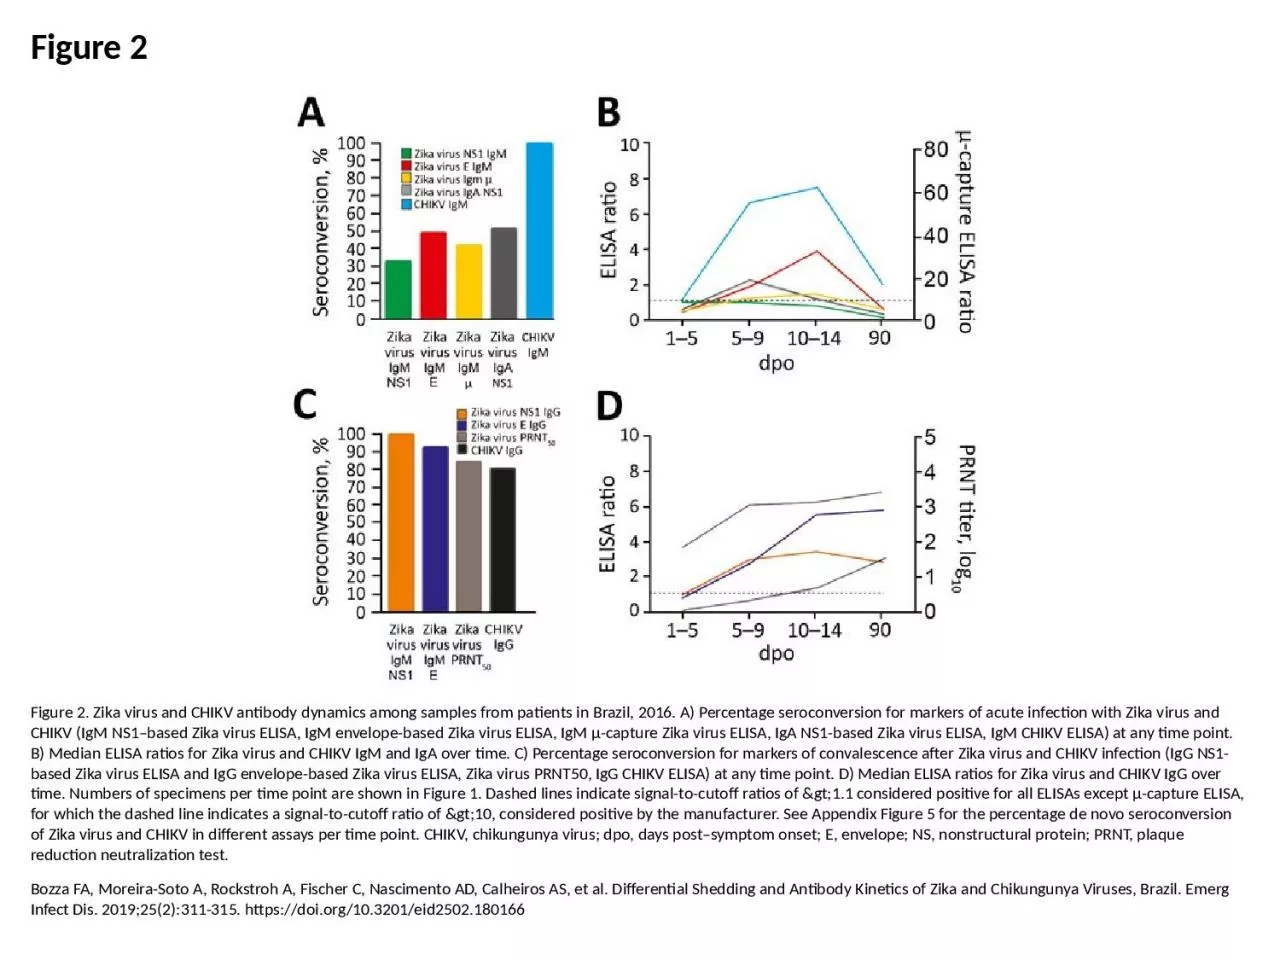
/
Figure 2 Figure 2. Zika virus and CHIKV antibody dynamics among samples from patients Figure 2 Figure 2. Zika virus and CHIKV antibody dynamics among samples from patients

Figure 2 Figure 2. Zika virus and CHIKV antibody dynamics among samples from patients - PowerPoint Presentation

isabella
isabella . @isabella
Follow
0 views
Uploaded On 2024-03-13

Figure 2 Figure 2. Zika virus and CHIKV antibody dynamics among samples from patients - PPT Presentation

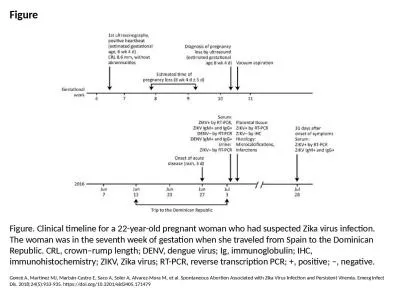
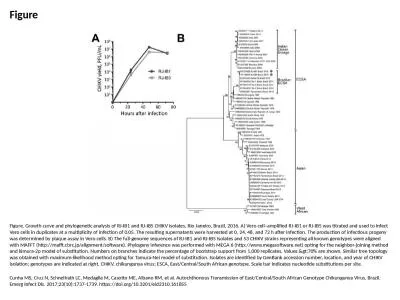
Bozza FA MoreiraSoto A Rockstroh A Fischer C Nascimento AD Calheiros AS et al Differential Shedding and Antibody Kinetics of Zika and Chikungunya Viruses Brazil Emerg Infect Dis 2019252311315 httpsdoiorg103201eid2502180166 ID: 1046937

virus zika chikv elisa zika virus elisa chikv time igm based igg point figure envelope ratios seroconversion percentage chikungunya

Share:

Link:

Embed:

Download Presentation from below link

Download Presentation The PPT/PDF document "Figure 2 Figure 2. Zika virus and CHIKV ..." is the property of its rightful owner. Permission is granted to download and print the materials on this web site for personal, non-commercial use only, and to display it on your personal computer provided you do not modify the materials and that you retain all copyright notices contained in the materials. By downloading content from our website, you accept the terms of this agreement.


Presentation Transcript

1. Figure 2Figure 2. Zika virus and CHIKV antibody dynamics among samples from patients in Brazil, 2016. A) Percentage seroconversion for markers of acute infection with Zika virus and CHIKV (IgM NS1–based Zika virus ELISA, IgM envelope-based Zika virus ELISA, IgM μ-capture Zika virus ELISA, IgA NS1-based Zika virus ELISA, IgM CHIKV ELISA) at any time point. B) Median ELISA ratios for Zika virus and CHIKV IgM and IgA over time. C) Percentage seroconversion for markers of convalescence after Zika virus and CHIKV infection (IgG NS1-based Zika virus ELISA and IgG envelope-based Zika virus ELISA, Zika virus PRNT50, IgG CHIKV ELISA) at any time point. D) Median ELISA ratios for Zika virus and CHIKV IgG over time. Numbers of specimens per time point are shown in Figure 1. Dashed lines indicate signal-to-cutoff ratios of >1.1 considered positive for all ELISAs except μ-capture ELISA, for which the dashed line indicates a signal-to-cutoff ratio of >10, considered positive by the manufacturer. See Appendix Figure 5 for the percentage de novo seroconversion of Zika virus and CHIKV in different assays per time point. CHIKV, chikungunya virus; dpo, days post–symptom onset; E, envelope; NS, nonstructural protein; PRNT, plaque reduction neutralization test.Bozza FA, Moreira-Soto A, Rockstroh A, Fischer C, Nascimento AD, Calheiros AS, et al. Differential Shedding and Antibody Kinetics of Zika and Chikungunya Viruses, Brazil. Emerg Infect Dis. 2019;25(2):311-315. https://doi.org/10.3201/eid2502.180166