/
TUZ GL NEW ABSOLUTE RADIOMETRIC CALIBRATION TEST SITE S Gurol H Ozen U TUZ GL NEW ABSOLUTE RADIOMETRIC CALIBRATION TEST SITE S Gurol H Ozen U

TUZ GL NEW ABSOLUTE RADIOMETRIC CALIBRATION TEST SITE S Gurol H Ozen U - PDF document

jainy
jainy . @jainy
Follow
342 views
Uploaded On 2021-08-26

TUZ GL NEW ABSOLUTE RADIOMETRIC CALIBRATION TEST SITE S Gurol H Ozen U - PPT Presentation

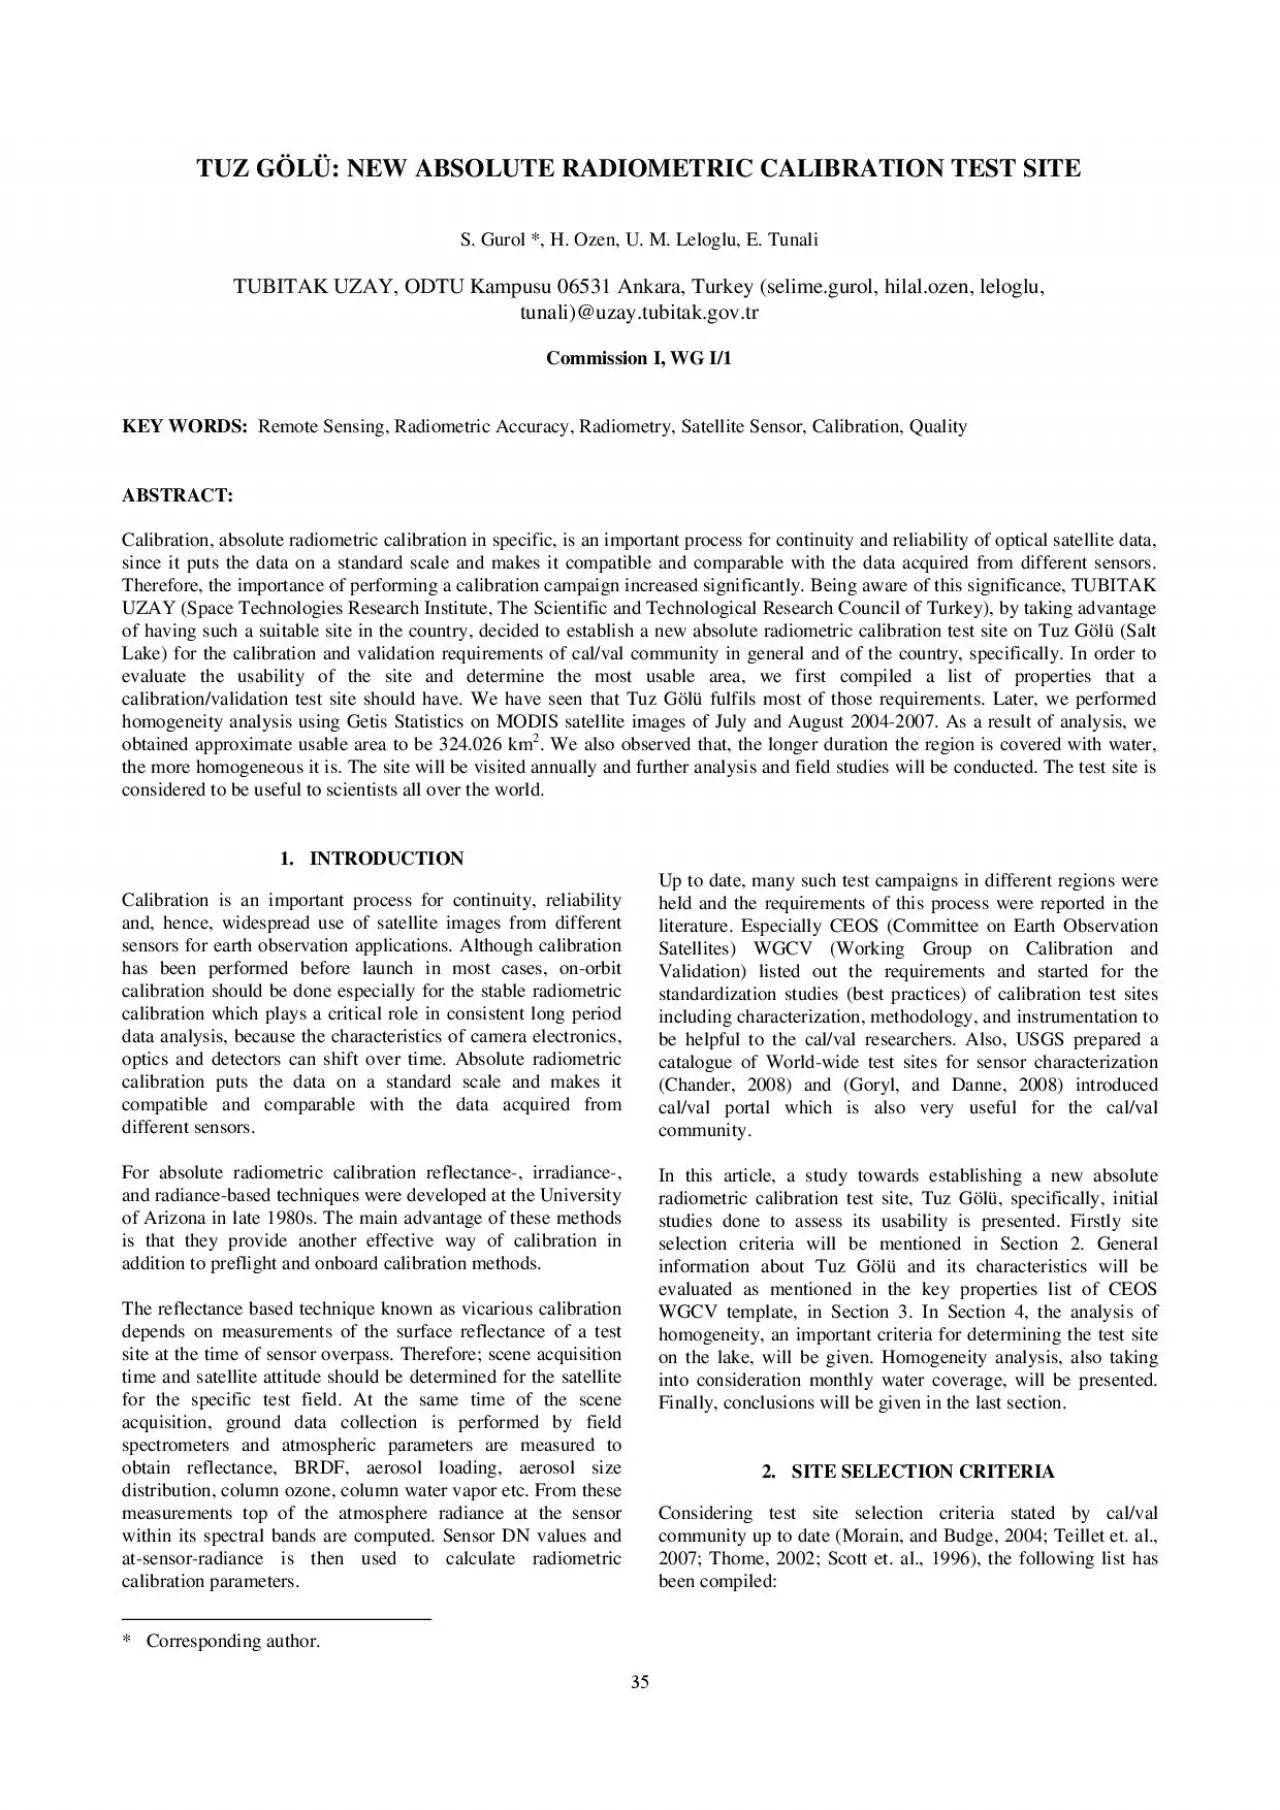
Corresponding author Calibration is an important process for continuity reliability ages from different has been performed before launch in most cases onorbit calibration should be done especially ID: 872034

calibration site spatial area site calibration area spatial homogeneity 2007 region analysis information figure sensing high remote 2008 salt

Share:

Link:

Embed:

Download Presentation from below link

Download Pdf The PPT/PDF document "TUZ GL NEW ABSOLUTE RADIOMETRIC CALIBRAT..." is the property of its rightful owner. Permission is granted to download and print the materials on this web site for personal, non-commercial use only, and to display it on your personal computer provided you do not modify the materials and that you retain all copyright notices contained in the materials. By downloading content from our website, you accept the terms of this agreement.


Presentation Transcript

1 TUZ GÖLÜ: NEW ABSOLUTE RADIOMETRIC CAL
TUZ GÖLÜ: NEW ABSOLUTE RADIOMETRIC CALIBRATION TEST SITE S. Gurol H. Ozen, U. M. Leloglu, E. TunaliTUBITAK UZAY, ODTU Kampusu 06531 Ankara, Turkey (selime.gurol, hilal.ozen, leloglu, tunali)@uzay.tubitak.gov.tr Commission I, WG I/1 ote Sensing, Radiometric Accuracy, Radi, Satellite Sensor, Calibration, Quality * Corresponding author. Calibration is an important process for continuity, reliability ages from different has been performed before launch in most cases, on-orbit calibration should be done especially for the stable radiometric calibration which plays a critical role in consistent long period data analysis, because the characteristics of camera electronics, 35 ammetry, Remote Sensing and Spatial Information Sciences. Vol. XXXVII. Part B1. Beijing 2008 (SNR) which, in return, increases overall accuracy. the spatial uniformity of the area, the lesser the effects of generalizing the reflectance data to the size of of the site eases the poral uniformity of the site eases the calibration The site should have little or no vegetation that can bertian site surface is preferable since it decreases errors caused by different solar and view geometry. High probabilityof cloud free days provides more time for A longer distance to densely populated areas and/or Having a site in an arid region minim in turn may change the surface BRDF. Also, in ar

2 id regions, the probability of a cloudy
id regions, the probability of a cloudy weather is minimum. Having a large site minimi the unwanted effects of scattering of light from areas outside the target area. Easy access to the site is an advantage. Instrumented test sites are preferable. In line with the criteria listed above, generallyare preferable radiometric calibration sitesValley in Nevada, USA, the La Crau test site in France, Ivanpah Playa in Nevada, USA, White Sands Missile Range in New Mexico, USA, Lake Frome in Australia, Uyuni Salt Flats in TUZ GÖLÜ test site, CEOS WGCV template Core Site / Description of the Site: a natural reserve area, the site is a salt flat at an elevation of 905 m above the sea level. The evaporates are mainly halite and gypsum, with minor amounts of polyhalite and coelestine (Camur, et al., 1996). There is virtually no vegetation in the salt flat but it is surrounded by arable fields and salt-steppes. There The suitable area selection analysis was conducted by using the MODIS (LPDAAC, 2007) satellite images of July and August (2004-2006), which is the most suitable period for the site, for calibration studies. In Figure 2, the red region is 324.026 kmand illustrates available homogenous area throughout July-August. The yellow region has an area of 195.092 kmgives an idea about regions which are likely to be dry, in July-be used for calibration/valida

3 tion of satellites with sensors from low
tion of satellites with sensors from low to high resolution. The method used for determining the Figure 1: Location map of Tuz Gölü salt lake, Turkey on www.map-of-europe.us/, image Figure 2: Suitable area for calibration. 36 ammetry, Remote Sensing and Spatial Information Sciences. Vol. XXXVII. Part B1. Beijing 2008 These regions were visited during our first field study on Current Status of the Site: TUBITAK UZAY will be organizing field campaigns at Tuz during summeperiod each year. Site will be temporarily instrumented during campaigns. The maintenance of the site is funded by TUBITAK and the first campaign is planned to be As mentioned previously, spatial homogeneity is one of the important criteria, having influence on the accuracy absolute calibration results. Homogeneity of the area, which can change over time, affects the site selection and also usability of the area. Therefore, a special focus on homogeneity will be For homogeneity analysis, the spatial autocorrelation, the associated with the pixel coordinate is us2005). The clustering of similapositive autocorrelation while neighborhood of dissimilar values denotes negative autocorrelation. Global or local statistics are used to measure is used as a local indicator which is an example of the local indicators of spatial for some chessboard distance (Gonzalez, )(dG jijxdwdG)()(atrix

4 )(dw = digital number attributed to
)(dw = digital number attributed to the pixel location Let’s define a set A, which cpixels which are within the chessboard distance pixel location i. For example if), this means A has nine elements including Aj ; Therefore; Equation (1) gives the ratio of the sum of the of the DNs for the In the context of application to remo is used by calculation of Z )(dG(Bannari et al., 2005) used the following standardized formula from Z score formula, to evaluate the homogeneity 2/1)1/(*)(**)()(−−nWnWsxWxdwdGjij dwW)(* nxxjj _ ))((xn The Getis Statistics, explained calibration test site for homogeneity analysis using band of MODIS (LPDAAC, 2007) image taken on 20.07.2007 is taken as unity. The resultant image showing Tulue (Wulder and Boots, 1998). Therefore; from the results, it is clear that there is a large Z score standardization is: xz where is the mean is standard deviation of x. 37 ammetry, Remote Sensing and Spatial Information Sciences. Vol. XXXVII. Part B1. Beijing 2008 homogenous area with high reflectanFigure 4: Getis statistics of MODIS (July, 2007), Band 2 Since water coverage of the lake changes along the year, we o performed ome analysis to have an idea on how these changes affect the homogeneity of the area. If

5 there is a relation between duration tha
there is a relation between duration that the region is covered with water along the year and its homogeneity index, this may give us information about site homogeneity for the coming years. Therefore; firstly the regions that was covered wfrom 2 months to 8 months (Figure 5), was obtained using MODIS images (LPDAAC, 2007). Then for each region we calculated mean values attained to that area obtained from Getis statistics for July, 2007. Lastly, we looked at the correlation between the homogeneity index and the duration that region covered with water. Pearson’s linear correlation coefficient, the measure of correlation valued between -1 and 1, was calculated as 0.9733 which means that there is a positive linear relation between two variables. Figure 6 shows the linear relationship 087.0.013.0=xy Figure 5: Seasonal water coverage in the year 2007 Figure 6: Homogeneity index covered by water In this study, the suitability 38 ammetry, Remote Sensing and Spatial Information Sciences. Vol. XXXVII. Part B1. Beijing 2008 Especially, the large extent of the spectrally homogenous region, high reflectance of the homogenous region, high accessibility and high elevation of the region are among the most salient features. We believe that, especially European users will find it very handy because of ease of access. During the analysis, an interest

6 ing thing we observed was that, ith wate
ing thing we observed was that, ith water, the more homogenous field tests and analysis will bewill be maintained in future. Bannari, A., Omari, K., Teillet radiometric uniformity and stabilitycalibration of IEEE Transactions on Geoscience Camur, M., Z., and H., Mutlu, 1996. Major - ion geochemistry and mineralogy of Salt Lake (Tuz gölü) basin, Turkey. “Catalog of http://calval.cr.usgs.gov/PDF/sites.pdf (accessed 29 April Getis, A., and Ord, J.K., 1992. The Analysis of Spatial Association by Ustance Statistics. Gonzalez R. C., and Woods R.E., 2002. ProcessingGoryl, No. 1” http://www.brockmann-for MODIS (MOD 09-Surface Reflectance) ages, 2007. ed 02 May 2008) Morain S., and Budge M. A., 2004. nlee, M. R., 1996. Evaluation of the Railroad Valley playa for use in vicarious calibration. Proceedings of SPIETeillet, P.M., Barsi, J.A., Chander, G., and Thome, K.J., 2007. Prime calibration of space-based optical imaging instruments. Proceedings of SPIE,mposium in conjunction with Pecora 15/Land Satellite Information IV calibration approaches for remote sensing imagers in the solar Wulder, M., Boots, B., 1998. Local spatial autocorrelation characteristics of remotely sensed imagerywith Getis We would like to thank Mr. Vedat Gün and Mr. Ramazan 39 ammetry, Remote Sensing and Spatial Information Sciences. Vol. XXXVII. Part B1. Beijing 2008