PDF-11.17-2EMISSION FACTORS 2/98Figure 11.17-1. Process flow diagram for
Author : jane-oiler | Published Date : 2015-08-26
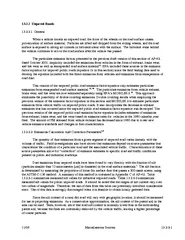
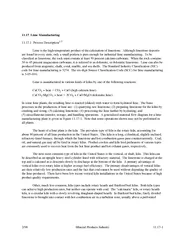
298 Mineral Products Industry11173grate Because of the amount of lime carryover into the exhaust gases dust collection equipment must beinstalled on fluidized bed
Presentation Embed Code
Download Presentation
Download Presentation The PPT/PDF document "11.17-2EMISSION FACTORS 2/98Figure 11.17..." is the property of its rightful owner. Permission is granted to download and print the materials on this website for personal, non-commercial use only, and to display it on your personal computer provided you do not modify the materials and that you retain all copyright notices contained in the materials. By downloading content from our website, you accept the terms of this agreement.
11.17-2EMISSION FACTORS 2/98Figure 11.17-1. Process flow diagram for: Transcript
Download Rules Of Document
"11.17-2EMISSION FACTORS 2/98Figure 11.17-1. Process flow diagram for"The content belongs to its owner. You may download and print it for personal use, without modification, and keep all copyright notices. By downloading, you agree to these terms.
Related Documents