PPT-A Brief Overview on Some Recent Study of Graph Data

Author : jane-oiler | Published Date : 2016-07-30

Yunkai Liu Ph D Gannon University Outlines Graph Database vs Traditional Database Data structure Some frequentlyused measurements Overview of Graph Databases Graph

Presentation Embed Code

Download Presentation

Download Presentation The PPT/PDF document "A Brief Overview on Some Recent Study of..." is the property of its rightful owner. Permission is granted to download and print the materials on this website for personal, non-commercial use only, and to display it on your personal computer provided you do not modify the materials and that you retain all copyright notices contained in the materials. By downloading content from our website, you accept the terms of this agreement.

A Brief Overview on Some Recent Study of Graph Data: Transcript


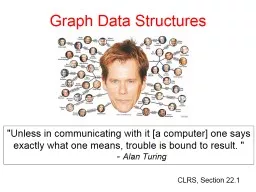
Yunkai Liu Ph D Gannon University Outlines Graph Database vs Traditional Database Data structure Some frequentlyused measurements Overview of Graph Databases Graph Data on Social Networks. recent study found that more than 75 percent of Fortune 1000 companies had fallen victim to accidental or malicious data leakage In recent study over 55 percent of employees use portable devices to take con64257dential data out of the workplace ever Anand Tripathi, Vinit Padhye, . Tara Sasank Sunkara. Department of Computer Science. University of Minnesota. . Presentation by . Tara Sasank Sunkara. eBay Inc.. Acknowledgements:. This work was partly supported by NSF award 1319333. Wei Wang. Department of Computer Science. Scalable Analytics Institute. UCLA. weiwang@cs.ucla.edu. Graphs/Networks. FFSM (ICDM03), SPIN (KDD04),. GDIndex. (ICDE07). MotifMining. (PSB04, RECOMB04, ProteinScience06, SSDBM07, BIBM08). Systems. Overview. (as of November 2011. ). NoSQL. Systems. Not every data management/analysis problem. is best solved . exclusively. using a traditional DBMS. . “. NoSQL. ” = “Not Only SQL” . NAS/HHMI Summer Institute 2011. Presented by the ‘Model Organisms’:. Stephanie Gardner. . and Laurie . Iten. , . Purdue University. Elizabeth . Derryberry, David . Heins. , and . Donata. Henry, Tulane University. William Cohen. 1. Announcements. Next Tuesday 12/8:. Presentations for 10-805 projects.. 15 minutes per project.. Final written reports due Tues 12/. 15. For exam:. S. pectral clustering will not be cov. Plotting. Editing . Plots. Some Ways to Use Plotting . Tools. Preparing Graphs for . Presentation. Using Basic Plotting . Functions. Creating Mesh and Surface . Plots. Plotting Image . Data. Printing . . Okoe. ). Florida International University. A crowd-sourcing framework for automated visualization evaluation. http://vizlab.cs.fiu.edu/graphunit/. A proof of concept: . GraphUnit. GraphUnit. is a web-service that supports a semi-automatic evaluation of graph visualizations; it leverages crowdsourcing, a library of graph-tasks linked to benchmark graph data sets, automatic user-study deployment, and result collection and analysis. . Sponsors. Cal. SPOUG. About Me. Vincent BIRET. Office Servers And Services MVP. @. baywet. bit.ly/vince365. Products. Team Tech Lead. Montreal. Why. . Should. . you. care?. Graph and Machine learning are going to be game changers for businesses in next 10 years. Graph Data Structures " Unless in communicating with it [a computer] one says exactly what one means, trouble is bound to result. " - Alan Turing CLRS, Section 22.1 Early Graph Theory Problem Leonhard Euler (1707 - 1783) Graph Data Structures " Unless in communicating with it [a computer] one says exactly what one means, trouble is bound to result. " - Alan Turing Early Graph Theory Problem Leonhard Euler (1707 - 1783) I. ntroduction. CML is a clonal myeloproliferative neoplasm. Dysregulated production and uncontrolled proliferation of mature and maturing granulocyte with fairly normal differentiation. Fusion of 2 genes: BCR (or chromosome 22) and ABL1 (on chromosome 9), resulting in BCR-ABL1 fusion gene. Sagar. . Samtani. and . Hsinchun. Chen. Artificial Intelligence Lab, The University of Arizona. 1. Outline. Introduction and Background. Autoencoder. : Intuition and Formulation. Autoencoder. Variations: . Computer science 2. nd. Stage . College of Pharmacy. Hussein Alsheakh, Ph.D.. 1. Use the right type of graphic. Charts and graphs. Bar chart. : comparisons, categories of data. Histogram. : represents relative frequency of continuous data.

Download Document

Here is the link to download the presentation.
"A Brief Overview on Some Recent Study of Graph Data"The content belongs to its owner. You may download and print it for personal use, without modification, and keep all copyright notices. By downloading, you agree to these terms.

Related Documents