/
WEEKLY VEAL MARKET SUMMARY~ Livestock, Meat, Feed Ingredients & Skin M WEEKLY VEAL MARKET SUMMARY~ Livestock, Meat, Feed Ingredients & Skin M

WEEKLY VEAL MARKET SUMMARY~ Livestock, Meat, Feed Ingredients & Skin M - PDF document

jane-oiler
jane-oiler . @jane-oiler
Follow
503 views
Uploaded On 2015-12-01

WEEKLY VEAL MARKET SUMMARY~ Livestock, Meat, Feed Ingredients & Skin M - PPT Presentation

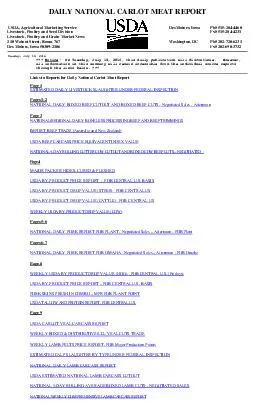
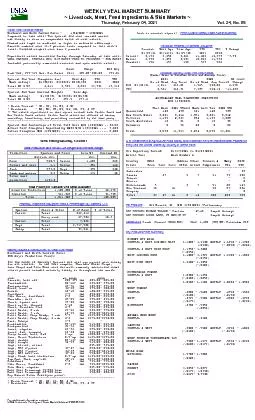
WEEKLY BOXED DISTRIBUTIVELCL VEAL CUTS TRADE Northeast and North Central Basis for Tue November 24 201 FOB Major Compared to last week 147SPECIALFED NATURE MILKFED VEAL SLAUGHTER AS ID: 211502

WEEKLY BOXED

Share:

Link:

Embed:

Download Presentation from below link

Download Pdf The PPT/PDF document "WEEKLY VEAL MARKET SUMMARY~ Livestock, M..." is the property of its rightful owner. Permission is granted to download and print the materials on this web site for personal, non-commercial use only, and to display it on your personal computer provided you do not modify the materials and that you retain all copyright notices contained in the materials. By downloading content from our website, you accept the terms of this agreement.


Presentation Transcript

WeeWEEKLY VEAL MARKET SUMMARY~ Livestock, Meat, Feed Ingredients & Skin Markets ~Friday, November 13, 2020VolNo. Carlot Veal Carcass Report orth Central Basis /2020 /2020** The calves represented in this report include both Packer Owned and NonPacker Owned calves.Packer Owned calves are defined as having ownership, harvesting, and processing controlled by the same party.Week Ending Saturday,10//2020Meat Production and Actual Live eightand Dressed Weight Production Species and Class L ive Wt Dressed Wt Million lbs. lbs. lbs. Beef 537.4 Cattle 1,392 842 Calves and veal 1.1 Calves 237 137 Pork 586.0 Hogs 293 218 Lamb and mutton 2.3 Sheep 123 62 Total meat production 1126.7 Domestic Production 1,100,000 % of Total 54.78% Imported 908,048 % of Total 45.22% Total 2,008,048 100.00% Federally Inspected Slaughter Head & Percentages by Species, U.S. Species Class & Total # of Head % of Total Cattle Total 639,523 Dairy cows 57,781 9.0 Calves Total 8,234 Hogs Total 2,693,618 Sheep Total 36,719 Monthly Boxed & Distributive/LCL Veal CutsTrade Northeast and North Central Basis FOB Major Production Points For the month of October: Special fed veal cut prices were generally steady to weak with Chop Ready Racks, Tenderloins and Top Rounds mostly lower. In the Veal complex, Shoulder Blade Chops, Breast and Ground Veal were the most commonly advertised items as retail prices trended unevenly steady throughout the month. Item: Wt. Range RangeCarcass, hide off 200275 lbs 405.00 405.00 Foresaddles 86147 lbs 335.00 375.00 Forequarters 4374 lbs 345.00 420.00 Necks, bonein 2428 lbs 295.00 300.00 Breast 1018 lbs 140.00 225.00 Foreshank 3-5 lbs 450.00 695.00 Osso Bucco, foreshank 28 lbs 695.00 995.00 Shoulder, full 4985 lbs 395.00 400.00 Chuck, square cut 3968 lbs 265.00 325.00 Chuck rolls, skinned 5-10 lbs 525.00 675.00 Chuck, Shoulder Clod 49 lbs 525.00 675.00 Hotel Racks, 8 rib 1526 lbs 845.00 950.00 Hotel Racks, 7 rib 1425 lbs 850.00 995.00 Hotel Racks, Chop Ready, 7 rib 59 lbs 1225.001525.00 Hotel Racks, Chop Ready, 6 rib 48 lbs 1275.001575.00 Rack, Ribeye 39 lbs 1950.001950.00 Hindsaddles 89153 lbs 515.00 625.00 Hindquarters 4576 lbs 525.00 625.00 Loins, regular 1836 lbs 395.00 445.00 Loins, 4x4, trimmed 1830 lbs 525.00 695.00 Strip Loins, bnls, 0x0 1up lbs 1300.001475.00 Loin, Short up lbs 1125.001425.00 Legs, double 68117 lbs 505.00 545.00 Legs, single 3459 lbs 515.00 PennsylvaniaWeekly Cattle Auction Summary Canadian Federally Inspected Slaughter Current Week Ago Year Ago YTD YTD % Change 10/31/20 10/24/20 11/02/19 2020 2019Calves: 3,040 3,060 3,072 133,953 144,789 7.5% Males: 2,887 2,907 2,924 127,224 136,854Females: 153 153 148 6,729 7,893 Canadian Monthly Grain Fed Veal Repor (Quebec Sales in Canadian Dollar and Average Price) AUSTRALIAN VEAL SLAUGHTER STATISTICS W/E 1/06 This Week 2020 YTDLast Week Last Year 2019 YTDQueensland 63 4,672 57 189 9,607New South Wales 1,361 70,034 1,553 2,732 89,451Victoria 681 141,739 986 1,202 154,363South Australia 12 309 7 5 282Tasmania 327 36,053 598 257 47,624 Total 2,444 252,807 3,201 4,385 301,327 U.S. Department Entry into theUnited States Country Metric Tons For Reporting Period: 10/25/2020 to 10/31/2020 Metric Tons Week Number 44 ------------------------------------------------------------------------ Australia 18 18 231 Canada 77 8 2 22 109 4,299 France 3 3 56 Mexico - 0 Netherlands 3 25 33 1,442 New Zealand 37 165 18 28 248 2,390 Uruguay - 0 Total 37 77 169 25 24 75 412 8,417 Fat Products Des Moines, W/E 11/07/2020*Preliminary --------------------------------------------------------------------CAF CHICAGO EDIBLE TALLOW Railcar33.00Simple AverageCAF CHICAGO LOOSE LARD, PS AND/OR CPSimple AverageCoconut Oil (Source: USDA/FAS *Oct1,108(US$/MT) Rotterdam CIF Dry Products Price Summary NONFAT DRY MILK CASEIN RENNET 3.4650 - 3.4975 ACID 3.6000 - 3.7500 $280 $285 $290 $295 $300 $305 $310 Jan Feb Mar Apr May Jun Jul Aug Sep Oct Nov Dec Average Price ($/cwt) 2020 Veal Prices $1,200 $1,250 $1,300 $1,350 $1,400 $1,450 $1,500 $1,550 $1,600 $1,650 $1,700 $1,750 $1,800 Jan Feb Mar Apr May Jun Jul Aug Sep Oct Nov Dec Dollars Per Hundred Weight Top Round - Cap Off ($/cwt) 2020 2019 5 Yr Avg $390 $415 $440 $465 $490 $515 $540 $565 $590 Jan Feb Mar Apr May Jun Jul Aug Sep Oct Nov Dec Dollars Per Hundred Weight Carcass - Hide Off ($/cwt) 2020 2019 5 Yr Avg $575 $600 $625 $650 $675 $700 $725 $750 Jan Feb Mar Apr May Jun Jul Aug Sep Oct Nov Dec Dollars Per Hundred Weight 4X4 Loin, Trimmed ($/cwt) 2020 2019 5 Yr Avg $650 $700 $750 $800 $850 $900 $950 $1,000 Jan Feb Mar Apr May Jun Jul Aug Sep Oct Nov Dec Dollars Per Hundred Weight Hotel Rack - 7 Rib ($/cwt) 2020 2019 5 Yr Avg $245 $270 $295 $320 $345 $370 Jan Feb Mar Apr May Jun Jul Aug Sep Oct Nov Dec Dollars Per Hundred Weight Square Cut Shoulder ($/cwt) 2020 2019 5 Yr Avg $500 $525 $550 $575 $600 $625 $650 $675 $700 $725 Jan Feb Mar Apr May Jun Jul Aug Sep Oct Nov Dec Dollars Per Hundred Weight Single Legs ($/cwt) 2020 2019 5 Yr Avg 2,500 3,000 3,500 4,000 4,500 5,000 5,500 6,000 Jan Feb Mar Apr May Jun Jul Aug Sep Oct Nov Dec Number of Head Weekly Veal Slaughter 2020 2019 5 Yr Avg