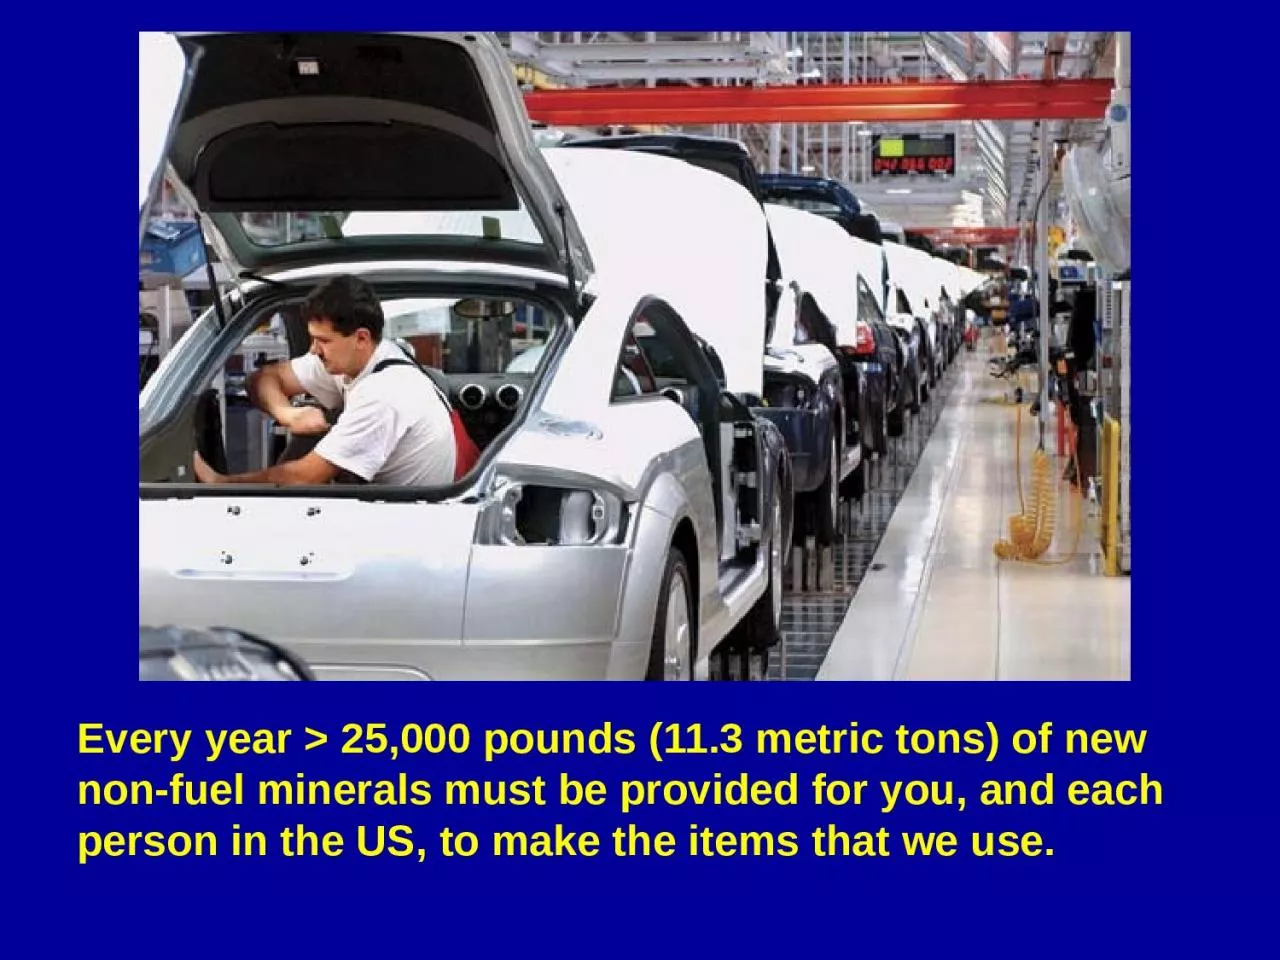
we use Human History Stone age Copper Age Bronze Age Iron Age 7 metals of antiquity Gold 8000 yra copper 6200 yra silver 6000 yra lead 5500 yra tin 3750 yra iron 3500 yra mercury 2750 yra ID: 926912
Download Presentation The PPT/PDF document "Every year > 25,000 pounds (11.3 metr..." is the property of its rightful owner. Permission is granted to download and print the materials on this web site for personal, non-commercial use only, and to display it on your personal computer provided you do not modify the materials and that you retain all copyright notices contained in the materials. By downloading content from our website, you accept the terms of this agreement.
Slide1
Every year > 25,000 pounds (11.3 metric tons) of new non-fuel minerals must be provided for you, and each person in the US, to make the items that we use.
Slide2Slide3Human History: Stone age, Copper Age, Bronze Age, Iron Age.7 metals of antiquity: Gold (8000 yra); copper (6200 yra); silver (6000 yra); lead (5500 yra); tin (3750 yra); iron (3500 yra); mercury (2750 yra)
Slide4Annual Global Consumption of Resources (Stuff!)
Slide5In 2011, the number of cars on roads, globally, exceeded one billion!
How many and what
different materials were needed to make the early cars at the start of the 20
th
century?
Answer: 5 (wood, rubber, glass, steel, brass)
Slide6In 2011, the number of cars on roads, globally, exceeded one billion!
How many and what
different materials were needed to make the early cars at the start of the 20
th
century?
Slide7How many different materials are now needed to make cars?
Slide8How many different materials are now needed to make cars?
Answer: More than 40 different minerals and metals (plus multiple plastics, organic materials, glasses, etc.)
Slide91. Crystallization from magmaEx/ Many minerals and rocks (granite, pumice)
Slide102. Precipitation out of waterEx/ Salts, gypsum, amethyst, opal, turquoise, limestone
Slide113. Sedimentation processesEx/ Sandstone, shale, limestone
Slide123. Precipitation out of hot fluids near magma, often associated with precipitation of quartz veins (pegmatites)Ex/ Metal ores (gold, silver, copper, etc.), sapphire, emerald, tourmaline
Slide134. Crystallize within preexisting gas bubbles of volcanic rocks Ex/ Zircon, topaz, ruby
Slide145. Formation at high pressuresEx/ Marble, slate, diamond, garnet
Slide156. Alteration of other minerals by weatheringEx/ clay, iron and aluminum oxides
Slide16Copper – humans use 15.7 million metric tons each year!! 3 billion tons geologically available < 200 years left ??
Ex/ Bingham copper mine in Utah
Slide17The first cell phone, 1973, weighed 2.5 pounds, could run for 30 minutes, and took 2.5 hours to recharge. What are some of the materials needed to make a modern cell phone?
Slide18Cell phone electronics require many elements such as copper, gold, palladium, platinum, silver, tungsten…. (these are expensive!)
Slide19The electronics use Rare Earth elements like neodymium, samarium, gadolinium, dysprosium, and praseodymium * Used for high-performance permanent magnets in electronics, video games, military devices, disk drives, DVDs. No good substitutes.
We import
~100
% of these! (75% from China)
Slide20The receiver and amplifier use arsenic and gallium. We import 100% of arsenic (Morocco, China, Belgium…) and 99% of gallium (Germany, Canada, UK, China…)
Slide21The casing contains magnesium compounds. We import most of these (China, Canada, Brazil, Austria…)
Slide22The battery is made of Lithium. The largest exporter of lithium is one big salt flat in the Atacama desert at the top of the Andes Mountains.
Slide23Lithium plant at Salar de Uyuni
Slide24Indium (liquid crystal displays in cell phones). *
Now ~$800/
kg
We import 100% (China, Canada, Japan, Belgium)
Slide25Europium – used for red phosphor in old color
TVs and LCD screens.
* No
good substitute as a phosphor,
though prices ~$20,000/kg
Slide26Erbium – used in all fiber-optic cables because of unique optical properties. (Also used to make pink-tinted sunglasses!)
* No good substitute.
Slide27Cerium – used to polish almost all mirrors and lenses because of unique chemical and physical properties.
Slide28Platinum – diesel catalytic converters. No good substitute. Rhodium – removing NOx emissions. No good substitute.
Slide29Lanthanum - It is usually the “metal” in a “nickel-metal hydride” battery, such as what is used in the battery for the Toyota Prius.
(That’s my car! A blue
Prius
)
U. S. Consumption of Minerals, as a % of world use.
Slide31U.S. Imports of Minerals
Slide32Slide33Map of global net metal imports
Slide34Map of global mineral depletion
Slide35Estimated Lifetime of some Selected Minerals Assuming 2009 Rates of Consumption (in thousands of metric tons)(http://minerals.usgs.gov
/minerals/pubs/commodity/)
Mineral Annual Reserves Estimated Resources Est. Lifetime
Production Lifetime (
yrs
) (
yrs
)
Arsenic 53.5 1,070 20 11,000 210Bauxite 201,000 27,000,000 130 75,000,000 370Cadmium 18.8 590 31 NAChromium 23,000 350,000 15 12,000,000 520Cobalt 62 6,600 110 15,000 240
Copper 15,800 540,000 34 3,000,000 190
Gold 2.35 47 20 NA
Carbon (graphite) 1,130 71,000 63 800,000 700
Indium 0.6 6 10 NA
Iron Ore 2,300,000 160,000,000 70 800,000,000 350
Lead 3,900 79,000 20 15,000,000 3800
Lithium 18 9,900 550 25,500 1400
Mercury 1.28 67 52 600 470
Nickel 1,430 71,000 50 130,000 91
Platinum Group 0.4 71 180 100 250
Rare Earths 124 99,000 800 NA
Silver 21.4 400 19 NA
Titanium 5,720 730,000 130 2,000,000 350
Tungsten 58 2,800 48 NA
Zinc 11,100 200,000 18 1,900,000 170
Slide36Estimated Lifetime of some Selected Minerals Assuming 2009 Rates of Consumption (in thousands of metric tons)(http://minerals.usgs.gov
/minerals/pubs/commodity/)
Mineral Annual Reserves Estimated Resources Est. Lifetime
Production Lifetime (
yrs
) (
yrs
)
Arsenic 53.5 1,070 20 11,000 210Bauxite 201,000 27,000,000 130 75,000,000 370Cadmium 18.8 590 31 NAChromium 23,000 350,000 15 12,000,000 520Cobalt 62 6,600 110 15,000 240
Copper 15,800 540,000 34 3,000,000 190
Gold 2.35 47 20 NA
Carbon (graphite) 1,130 71,000 63 800,000 700
Indium 0.6 6 10 NA
Iron Ore 2,300,000 160,000,000 70 800,000,000 350
Lead 3,900 79,000 20 15,000,000 3800
Lithium 18 9,900 550 25,500 1400
Mercury 1.28 67 52 600 470
Nickel 1,430 71,000 50 130,000 91
Platinum Group 0.4 71 180 100 250
Rare Earths 124 99,000 800 NA
Silver 21.4 400 19 NA
Titanium 5,720 730,000 130 2,000,000 350
Tungsten 58 2,800 48 NA
Zinc 11,100 200,000 18 1,900,000 170
This does NOT mean that we will run out of any of these minerals or metals in your lifetimes: we will continue to explore and find more.
HOWEVER, new resources will be harder to find, harder to extract, have greater environmental impacts, and THE PRICES WILL GO UP!
Slide37Minerals need to be naturally concentrated by geologic processes to be economically mined. (Of course, this depends on the $$)
Ex/ gold = 3 parts per billion (0.0000003%) of Earth
’
s crust
1 wedding band = 3000 TONS of crust!
How do rocks and minerals form?
Slide38Global Map of Copper Deposits
Why is
there all this copper
along the western
coast of the Americas?
Why is there gold in California and Alaska, but not in Florida?
Slide39Mid-Ocean Ridge Thermal Vents
Slide40Hydrothermal circulation concentrates certain minerals and ores.
Slide41Slide42Slide43Erosion can also help concentrate minerals to economic levels…
Slide44Slide45Global Map of Gold Deposits
Slide46Diamonds: Only form naturally more than 150 km beneath the surface!
Kimberlite
explosions
don’
t
happen any more!
Slide47Slide48New York Times, Sept. 4, 2009 BEIJING – Chinese officials said on Thursday that they would not entirely ban exports on two minerals vital to manufacturing hybrid cars, cellphones, large wind turbines, missiles and computer monitors, although they would tightly regulate production.
China produces more than 99 percent of the world
’
s supply of dysprosium and terbium, two rare minerals essential to recent breakthroughs in high-technology industries……..
“
The move could have forced some factories to relocate to China.
”
Terbium
Slide49US Water Usage
Slide50U.S. Geological Survey Circular 1268, "Estimated Use of Water in the United States in 2000."
The
US use
of water has leveled off, even though populations have continued to increase
Slide51U.S. Geological Survey Circular 1268, "Estimated Use of Water in the United States in 2000."
…this is due to improvements in water use efficiency for agriculture, power plants, and awareness of water conservation
Slide52Per capita per day water use, USA100 gallons personal (2 bathtubs) (1000 gallons total)Rank, in order, the personal water uses in the US:Drinking waterTaking bathsTaking showersWashing clothesWashing up (dishes, etc.)Flushing toilets
Slide53Personal Water Use
Slide54Food productionPound of rice250-600 gallons¼ pound hamburger meat3000 gallons1 liter of “Fiji” water27 liters (1 + 26 for production of bottle!) And 1 liter of gasolineAnd 0.5 kg CO2
Slide551/6 – 1/3 world’s population:No clean drinking water3.3 million deaths/yrMajor rivers don’t make it to oceanColorado, Rio Grande
Slide56UN: In 2050, 2 - 7 billion human beings may experience chronic water shortages“If the wars of this (20th) century were fought over oil, the wars of the next century will be fought over water” (Ismail Seregeddin, vice president, World Bank; 1995)
Slide57Most of the western US gets very little rainfall…….
Slide58Map of Water Scarcity
Slide59Slide60Slide61Map of Groundwater Stress (how much faster the water is being withdrawn than is being recharged)
Slide62Rate of Groundwater depletion (black = 1 m/
yr
)
Slide63Very positive future solution: Desalination(map of current global use)
Slide64Desalination: Distillation
Slide65Desalination: Reverse Osmosis (Barcelona, Spain)
Slide66Desalination: Reverse Osmosis
Slide67Desalination: Hadera Plant (Israel)
Costs have come down considerably – about 0.2-0.4 cents/gal
(too expensive
for agriculture, but not personal use)
(Environmental issues with salt that is left over)