/
Hypoxia in  Estuarine and Coastal Waters Hypoxia in  Estuarine and Coastal Waters

Hypoxia in Estuarine and Coastal Waters - PowerPoint Presentation

jordyn
jordyn . @jordyn
Follow
342 views
Uploaded On 2022-06-28

Hypoxia in Estuarine and Coastal Waters - PPT Presentation

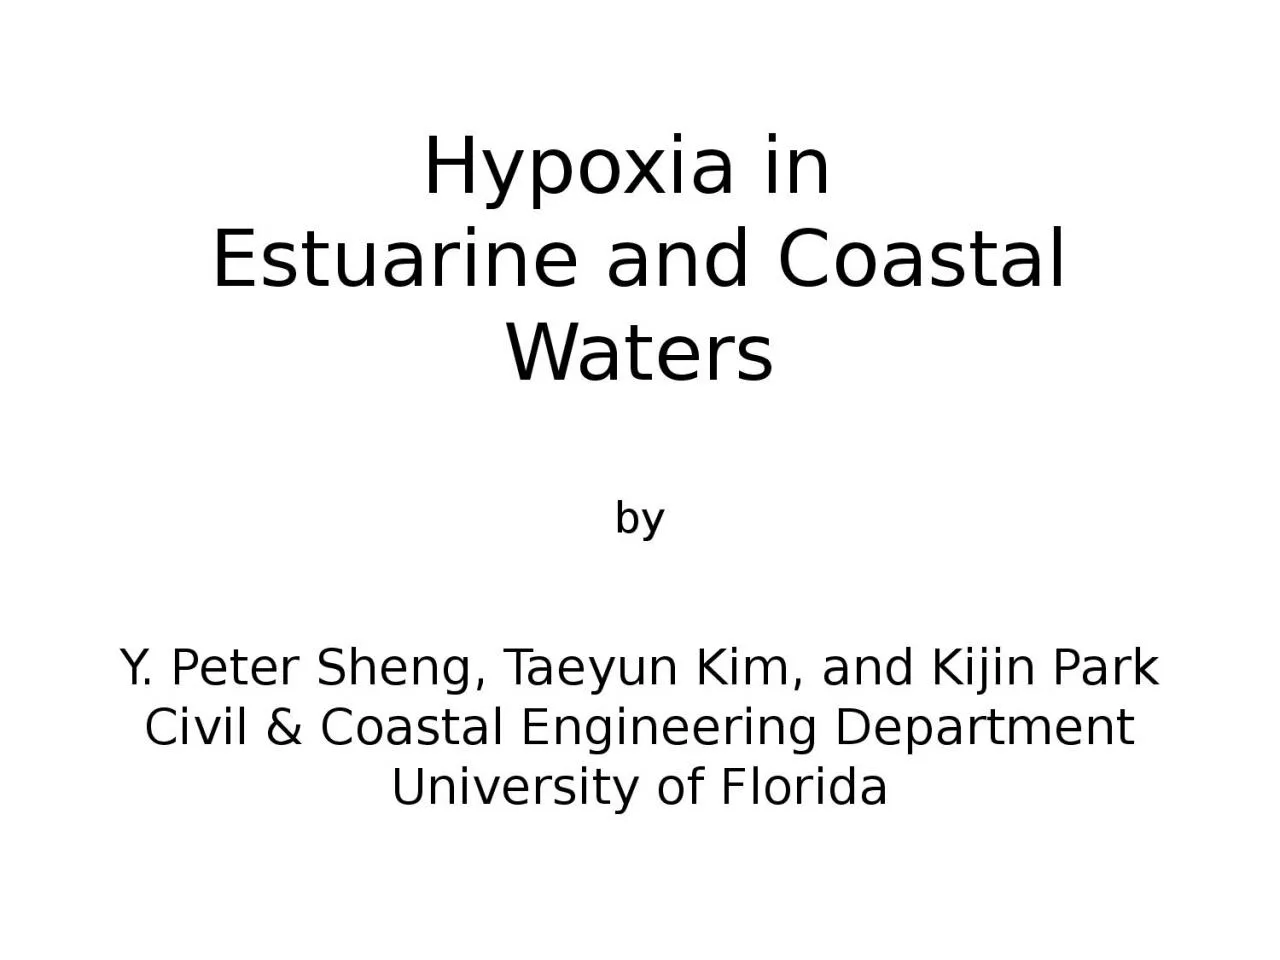
by Y Peter Sheng Taeyun Kim and Kijin Park Civil amp Coastal Engineering Department University of Florida Content What Cause Hypoxia Hypoxia in Gulf of Mexico amp Chesapeake Bay Hypoxia in Florida ID: 928042

sod hypoxia harbor bottom hypoxia sod bottom harbor charlotte water oxygen river loading sediment florida demand hypoxic chesapeake coastal

Share:

Link:

Embed:

Download Presentation from below link

Download Presentation The PPT/PDF document "Hypoxia in Estuarine and Coastal Waters" is the property of its rightful owner. Permission is granted to download and print the materials on this web site for personal, non-commercial use only, and to display it on your personal computer provided you do not modify the materials and that you retain all copyright notices contained in the materials. By downloading content from our website, you accept the terms of this agreement.


Presentation Transcript

Slide1

Hypoxia in

Estuarine and Coastal Waters

by

Y. Peter Sheng, Taeyun Kim, and Kijin Park

Civil & Coastal Engineering Department

University of Florida

Slide2

Content

What Cause Hypoxia?

Hypoxia in Gulf of Mexico & Chesapeake Bay

Hypoxia in Florida

Simulation of Hypoxia in Florida

How do External Loading and Climate Change Affect Hypoxia?

Slide3

What Cause Hypoxia?

Nutrients

CBOD

Sediment Oxygen Demand

External Loading

Wind Mixing

Tidal

Mixing

Slide4

Mississippi Dead Zone

4500-7000 sq mi

NASA

Satellite

Imagery

NOAA Ship Survey

Slide5

Chesapeake Bay Dead Zone

Slide6

Bottom-water

Hypoxia in Charlotte Harbor, FL

July 2000

Slide7

Hypoxia in Charlotte Harbor

After Charley (8/13/2004)

D. Tomasko

Bottom hypoxia

Surface+Bottom hypoxia

~38 sq mi on 8/27/04

Slide8

Hypoxia in Peace River Watershed

8/21/2004

Slide9

Simulation of Hypoxia Using an Integrated Modeling System for Estuarine and Coastal Ecosystems

CH3D-IMS (Sheng et al. 2002)

Model Grid

Slide10

Hypoxia in Charlotte Harbor during 2000

Slide11

Sediment Oxygen Demand

Station

Latitude

Longitude

Measured Value

(March 1984)

Measured Value

(Sep. 1984)

SOD #1

26º 55' 00"

82º 06' 18"

1.49

1.03

SOD #2

26º 48' 18"

82º 06' 30"

N/A

1.39

Slide12

Volume of Bottom Hypoxic Water is Related to River Discharge, Ri, and Tide

Slide13

Can we control Hypoxia?

Sediment Oxygen Demand (SOD)

is due to the oxidation of organic matter in bottom sediments.

The main sources of organic matter in bottom sediments are from

river loading, waste discharge, and dead algae following major bloom.

SOD can be a large fraction of oxygen consumption in surface water bodies.

Slide14

DO and SOD with reduced nutrient/CBOD loading

Slide15

SOD in the Upper Charlotte Harbor

(Increased air temperature of 3

°)

Slide16

DO in the Upper Charlotte Harbor

(Increased air temperature of 3

°)

Slide17

Phytoplankton in the Upper Charlotte Harbor

(Increased air temperature of 3

°)

Slide18

Conclusion

Hypoxia exists in Gulf of Mexico, Chesapeake Bay, and Florida.

Hypoxia in Charlotte Harbor is governed by river flow induced stratification and Sediment Oxygen Demand.

Bottom hypoxic water decreases when

stratification decreases (low river flow, high wind, high tide)

external loading (nutrients/CBOD) decreases

Peak hypoxic water volume is reduced by 5-10% with 50-100% load reduction

Climate change will lead to increase in SOD and decrease in DO, and changes in phytoplankton species

Slide19