/
the Information contained in this report is not to be Circulated witho the Information contained in this report is not to be Circulated witho

the Information contained in this report is not to be Circulated witho - PDF document

jovita
jovita . @jovita
Follow
343 views
Uploaded On 2021-08-07

the Information contained in this report is not to be Circulated witho - PPT Presentation

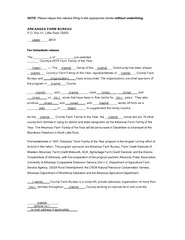
Coalition of Urban and Metropolitan Universities Survey Steering CommitteeTHE IMPACT OF INSTITUTIONS OF HIGHER EDUCATION ON URBAN AND METROPOLITAN AREASAssessment of the Coalition of Urban and Metropo ID: 858870

community university institutions cumu university community cumu institutions urban survey education universities average state metropolitan development engagement campus 000

Share:

Link:

Embed:

Download Presentation from below link

Download Pdf The PPT/PDF document "the Information contained in this report..." is the property of its rightful owner. Permission is granted to download and print the materials on this web site for personal, non-commercial use only, and to display it on your personal computer provided you do not modify the materials and that you retain all copyright notices contained in the materials. By downloading content from our website, you accept the terms of this agreement.


Presentation Transcript

1 the Information contained in this report
the Information contained in this report is not to be Circulated without the consent of the Coalition of Urban and Metropolitan Universities Survey Steering Committee THE IMPACT OF INSTITUTIONS OF HIGHER EDU C ATION ON URBAN AND METROPOLITAN AREAS Assessment of the Coalition of Urban and Metropolitan Universities REPORT FOR THE COALITION OF URBAN AND METROPOLITAN UNIVERSITIES MARCH, 201 1 Data Collection, Analysis, and Report by The Great Cities Institute at the University of Illinois at Chicago David Perry Carrie Menendez 2 | Page INTRODUCTION Colleges and universities play an integral role in the prosperity and life of the commun ities in which th ey are located, exhibiting a commitment to “ place, ” as represented by their educational activities, research, outreach, and development partnerships. The current federal administration, private corporations, and foundations have all shown interest in such “place - based” realities by funding and partnering with institutions of higher education to improve their communities. Thus, it is increasingly important that more precise information is collected and disseminated regarding the impact institutions of high er education have on the communities they serve. The Coalition of Urban and Metropolitan Universities (CUMU) was established in 1990, in order to create a niche for urban and metropolitan institutions of higher education that shared a common mission of co mmunity engagement. CUMU attempts to meet this mission of engagement through the facilitation of exchange of information among its members about urban and metropolitan issues, the creation of unified approach es to resolving its members’ common challenges, and by perpetuating a better understanding among policy makers, the higher education community, and the public about the distinctive roles played by urban and metropolitan universities. The 21st Century Declaration of the Coalition of Urban and Metropolit an Universities (p. 20) identifies multiple areas in which the Coalition can build both its cities and higher education institutions through advocacy, knowledge dissemination, leadership, and support. The Coalition promotes members to focus on: partnershi ps and disseminating best practices in engagement and university - community collaboration; utilizing the intellectual resources of the university to foster innovation, entrepreneurship and economic growth; and working collaboratively with public schools to foster community partnerships that enhance the opportunities for urban children to graduate from high school prepared for post - secondary education. This report attempts to describe the many ways in which the Coalition of Urban and Metropolitan Universities (CUMU) and its member institutions make a difference in their neighborhoods, cities, and regions. In order to fully portray the work of the Coalition and its members, the Coalition launc

2 hed its first national study of its mem
hed its first national study of its membership through the administr ation of a survey created, distributed, and collected by an ad - hoc committee of CUMU members. This report outlines the findings from this survey as well as utilizing secondary data collected from the Integrated Postsecondary Education Data System 1 (IPEDS) that describe the conditions of all CUMU member institutions, not just the surveyed sample of CUMU members. 3 | Page THE COALITION OF URBAN AND METROPOLITAN UNIVERSITIES National Data and Comparison to Universities Nationwide Institutional Characteristi cs In 1990, metropolitan and urban university leaders created the Coalition of Urban and Metropolitan Universities in recognition of their shared mission to use the power of their campuses in education, research, and service to enhance the communities in which they are located . Currently, CUMU has 78 members -- 72 located in 67 different cities in the United States and 6 abroad. Today, CUMU institutions serve a variety of urban and metropolitan areas across the United States and abroad, each with their own unique set of opportunities and challenges. Geographically, CUMU members are representative of 4 - year colleges and universities located in all the major regions of the US (see figure to right). CUMU members vary from the typical 4 - year institution in t hat they tend to enroll more students and be more ‗urban’ than the typical U.S. college or university. The majority of CUMU members, 64 percent, are located in large urban and metropolitan areas, 2 and another 17 percent are located in midsize cities and s uburbs. 3 Nationally, only 46 percent of 4 - year institutions are located in large urban and metropolitan areas. CUMU members are overwhelmingly public, 4 - year institutions (92 percent), with private , not - for - profit institutions representing less than 8 p ercent of the total. This is significantly different from the full number of 4 - year universities in the United States, where only 23 percent of 4 - year colleges and universities are public, while 57 percent are private, not - for - profit, institutions and 20 percent are private, for - profit, entities. 4 | Page Such a comparison is important to note going into this study because CUMU institutions, while small in overall number, are key factors of the national developmental landscape. CUMU institutions educate about 10% of all students enrolled in 4 - year colleges and universities in the United States, yet they represent only a little over 2% of all 4 - year institutions of higher education. The vast majority of CUMU institutions, 62 percent, serve student po pulations of 10,000 or greater; whereas only 11 percent of 4 - year institutions nationally serve student populations over 10,000. Nationally only 5 percent of institutions of higher education have over 20,000 students; yet 35 percent of CUMUs fall into this institut ional siz e

3 category of 20,000 and above. A 12 -
category of 20,000 and above. A 12 - month unduplicated headcount of all students enrolled during the 2008 - 09 academic year indicates a n average of 19,500 students attend CUMU institutions compared to 5,175 for the average US 4 - year institution . An undergraduate headcount during the same academic year shows an average of 15,135 students per CUMU member . The total 12 - month unduplicated headcount for all CUMU institutions in 2008 - 09 AY was 1,350,000 or about 9.5 percent of the total of 14,300,000 fo r all 4 - year institutions, nationally . Of this total, 906,000 (approximately 67 percent) were enrolled as full - time students at CUMU institutions . CUMU institutions are characterized by racial diversity and outreach to all populations . Approximately 54 percent of the students attending CUMU institutions were Non - Hispanic Whites, 2 0 pe rcent Black, 8 percent Hispanic, 6 per cent Asian or Pacific Islander, and a n additional 3 percent were international student s. In addition, nine percent of CUMUs are histo rically black colleges or universities (HBCUs). The average admittance rate among CUMUs during the 2008 - 09 academic year was 67 percent. During this same academic year, member institutions awarded 6,548 associate degrees , 139,057 bachelor degrees , 51,932 master s degrees , and 2,823 doctor al degrees. 4 On average, a CUMU member institution awarded 96 associate degrees , 2,045 bachelor degrees , 764 masters degrees , and 51 doctor al degrees during the same academic year. CUMU Universities as “Anchors” of Urban Economic Development and Engagement According to the interest group, CEOs for Cities, 5 higher education institutions are increasingly seen as “anchors” for urban development that can serve as an important dimension of domestic change. By “anchor institut ion” we mean universities and other mostly non - profit, public or civic entities that, “by reason of mission, invested capital, or relationships to customers or employees, are geographically tied to a certain location. 6 ” We can use such a definition to cov er a full constellation of “Eds,” “Meds,” civic institutions, foundations, governments and even a few private and public private entities such as utilities that , together, form the mix of city/regional institutions that has the potential to be foundational to urban development. The argument in this section is that w hile cities have certainly returned to a place of 5 | Page prominence both nationally and globally, their success in the future is inextricably tied to place - based institutional actors, like the universi ties of CUMU, that “anchor” the city - regions’ success and failure. Three themes guide a growing understanding of anchor institutions and especially higher education institutions in this anchor role. First, rather than being actors “on” their communities , their relations are increasingly characterized by

4 reciprocity in planning and acting “wi
reciprocity in planning and acting “with” their communities, involving relationships that are described as being “of” the community rather than “in” the community. 7 Second, their impact is the result of the relations of higher education institutions with multiple institutions or urban stakeholders. This leads to a more important point — that no matter how dramatic the economic outputs of particular anchor institutions, they are the most successful institu tions of urban development to the extent that they operate as “fully vested 8 ” (that is fully engaged) institutions in their community. This stance of engagement requires a process of relationship - building and leads to a third theme, or goal of this policy brief. Successful new approaches to urban policy can, in part, be informed by how well they contribute to the collective capacity building among the multiple stakeholders of cities and of federal and state policy makers to develop the city in mutually ag reeable ways. Such policy targets and positions advance universities as anchor - catalysts for generating and guiding urban revitalization. Among all the place - based or anchor institutions of a city - region, as we are suggesting here, higher education instit utions are well positioned with a broad range of skills and resources – intellectual, human, technological, and social – to engage urban challenges. CUMU members are recognized as engaged institutions of higher education collaborating with their communitie s improving the physical, social, and intellectual viability of their cities. An impressive 49% of CUMU members have been honored with the Carnegie Community Engagement Elective Classification, while, overall, only 10% of the nation’s four years colleges and universities have receiv ed this classification. Programs of such engagement take on many features. For example, h igher education institutions are very often an essential part of the “ education pipeline, ” enrolling large numbers of students from local school districts and specifically training them to be educators in urban areas. Higher education institutions are also economic drivers, as they serve as prominent employers, real estate developers, and business incubators in their cities. At present ma ny higher education institutions are utilizing their capacity to produce an urban health workforce, conduct interdisciplinary research, provide clinical resources, and organize community - academic partnerships on chronic diseases and health disparities. Hi gher education institutions often act as conveners of the various stakeholder groups from their local communities as well as the greater metropolitan areas. Community engagement by public urban higher education institutions not only provides a valuable se rvice to the cities, it also enables these institutions to improve their own core knowledge and expertise, leading to further theories, discoveries, and advances for our nation. The mutuality of re

5 lationships and the collective capacity
lationships and the collective capacity of urban/local - st ate leadership that higher education institutions might garner is hard to come by in cities where the interests of city government, community, university, hospital and utility are multiple and often quite contested. Hence practices that reinforce the ways in which such institutions “anchor” urban development can serve as important new dimension s to domestic change. Leveraging this foundational role through creative and stimulat ing partnerships between the institutions and b etween the levels of government can offer full, original, new and necessary directions for the urban regions of the United States. Such stimulating policy will require not 6 | Page only new and renewed action at the federal level but new levels of institutional engagement and service at the urb an level. We emphasize urban or city - regions here for very important reasons. Fully 83 percent of Americans now live in these city - regions or metropolitan areas, containing 86 percent of American jobs. Though contemporary daily lives often involve trips between different cities and towns and even states, 94 percent of people in the 100 largest metros live and work in the same metropolitan areas. The 100 largest metropolitan areas in the United States contain just 12 percent of the nation’s land area and 65 percent of its population but they account, by themselves for 74 percent of the nation’s college graduates, 76 percent of all good - paying knowledge jobs, 78 percent of all patent activity, 79 percent of the nation’s air cargo, and 94 percent of its vent ure capital funding. As a result, the largest 100 metros alone produce a massive 75 percent of the nation’s gross domestic product. Thirty - five of America’s metropolitan areas, if treated as nations, would rank among the world’s largest 100 economies. 9 Economic Impact Universities , in general, and CUMU institutions , in particular, have an impact on the regional economy. The three key variables of impact we want to highlight here are workforce, capital expenditures and revenues and “engaged” public servi ce expenditures. As of November 1, 2008, CUMU institutions had a total of 138,731 full - time employees on their payrolls. The average CUMU institution employed 2,011 full - time employees. Institutional research and public service employees totaled 54,204; e xecutive and managerial staffs accounted for 10,279; other professional staff totaled 36,442; and they employed a non - professional staff of 37,806. Core expenses 10 reported during the 2008 fiscal year amounted to a combined $16.5 billion for CUMU instituti ons with the average member spending $236 million, directly, in its res p ective region. On average, public service expenses accounted for 3 percent of this total. Combined core revenues 11 for all CUMU institutions during the same fiscal year exceeded $18.2 b illion. The average member recorded $260 million in revenues during the 2008 fiscal yea

6 r. While the data presented here on
r. While the data presented here on the importance of city - regions, or metropolitan areas, and their universities, especially CUMU institutions, is certainly impressive , this report is designed to move beyond the aggregate secondary data and, through the use of a survey, drill down into the institutional structure, practices and some of regional impacts of the members of CUMU. 7 | Page THE SURVEY Assessing CUMU Members: Programs, Partnerships, Engagement, and Impact The survey was created to gather information that is not generally collected and shared amongst colleges and universities. The survey focuses on three core areas: physical and community development, community engagement, and regional economic development and technology transfer. The purpose of the survey is three - fold: 1. To assess the practices of the membership of CUMU in light of its mission of engaged place - based institutions and their presence in the metropo litan areas. This will help solidify the membership and generate a resilient identity for the organization. 2. To help the Coalition of Urban and Metropolitan Universities make the case to policymakers that the programs and initiatives that metropolitan inst itutions of higher education engage in warrant ongoing or new public funding. 3. To strengthen the mission and identity of the individual institutions collecting the data. The survey was distributed to 68 CUMU members 12 in the spring of 2010, and yielded 40 completed and semi - completed survey responses, a 59% response rate. The depth of the survey questions and the originality of the type of data collected resulted in low response frequencies to a number of survey questions. This is not seen as detriment t o the survey process; yet a testament to the commitment to the member institutions that were able to complete the ground - breaking survey requiring the collection and reporting of data that i s not formerly collected by many of these institutions. Survey Respondents (N=40) Buffalo State College University of Arkansas at Little Rock (UALR) California State Polytechnic University, Pomona University of Baltimore California State University, Fresno University of Central Oklahoma College of Staten Isl and/City of New York University of Cincinnati Coppin State University The University of Colorado Denver Florida International University University of Louisville George Mason University University of Michigan - Dearborn Indiana University - Purdu e University Indianapolis University of Missouri - Kansas City Jackson State University University of Missouri - St. Louis Medgar Evers College University of Nebraska at Omaha Metropolitan State College of Denver University of North Texas at Dall as Morgan State University University of South Carolina Upstate Northern Kentucky University University of Tennessee at Chattanooga Pace University The University of Washington Tacom

7 a Portland State University Virgin
a Portland State University Virginia Commonwealth University Rutgers University - Camden Washington State University - Spokane Rutgers University - Newark Washington State University - Vancouver Temple University Weber State University Texas State University - San Marcos Widener University Towson Univer sity Youngstown State University 8 | Page Reporting Method In this report, The Coalition members will be described using both narrative and aggregated data. 13 Due to the breadth of the survey and length of the results, not all of the results are reported her e and only a small portion of the examples and case studies are included. 14 The institutional information we seek is problematic in nature as much of the data is not uniformly collected nationwide. Many factors may affect the quality and type of informatio n reported here -- such as who or which administrative office at each of the institutions responds to this survey and how each institution defines the variables that are difficult to quantify. Although this is a small sample and cannot provide us with deta iled quantitative data that can be used for statistical inference we feel as though the sample institutions are representative of all CUMU members in terms of size and geography, and thus our findings are generalized to all CUMU s in this report. The rate s of response to each question, within the survey, var ied and thus missing values are not included. Therefore, in this report only data recorded for completed questions are used in calculating descriptive statistics. All data gathered in this survey was reported for the Academic Year 2008 - 2009 and for the Fiscal Year 2009 unless otherwise noted. 9 | Page I. UNIVERSITY - COMMUNITY PRACTICES AND ENGAGEMENT Community Engagement: Urban and Metropolitan Partnerships Universities partner with the ir local , state, and federal governments, urban and regional nonprofit agencies, and private entities -- contributing higher education expertise, capital, or other resources to joint projects. Th e practices of “partnership” come in many forms as exhibited in the cha rt and examples listed below. Transportation At Washington State University – Vancouver the Chancellor co - chaired a bi - state commission – Columbia River Crossing – to research, evaluate and agree upon project scope, budget, funding strategies, etc. WSU also participates in the Transportation Coalition, a group of public and private stakeholders from Southwest Washington, who advocate with one voice (cities and county) for transportation priorities, primarily with local legislators for state funding, but also for federal funding as available In 2009, Widener University prepared and submitted a $16.9 million proposal for consideration in the Federal Surface Transportation Reauthorization bill to construct a Multimodal Transit Facility. Widene

8 r University' s partner in the developme
r University' s partner in the development of University Crossings, Teres Holdings LLC, has committed $8451 , 538 toward this $16,903,076 project. The proposed Multimodal Transit Facility will take an estimated 550 cars off area roads, reduce congestion, reduce carbon em issions, help to improve our vital quality of life in the City, and create more than 100 construction jobs. Sustainability/Ecological Issues In 2002 the University of Central Oklahoma (UCO) entered into a partnership with Johnson Controls Inc. (JCI) on a Performance Contract. The concept consisted of a plan whereby JCI would identify work that could be accomplished on campus that would save energy through the use of more efficient equipment, reduce wastes, etc. University utility bills were reduced. After four phases of work and approximately $14 million of investment in infrastructure, UCO has saved over four million dollars, above and beyond the funds needed to repay the bonds, plus has new state of the art, reliable, energy efficient equipment in place of antiquated systems of the past. At the University of Missouri - St. Louis, the Campus Honors Environmental Research Project (CHERP) works mainly in a "wilderness" area of St. Vincent County Park. The long - term goal is to restore a dynamic ecological ba lance in a 130 - acre tract of woodland and savannah near campus. The project initiated a credit - bearing course and engagement of students working on their field research projects in Biology, Chemistry, or Biochemistry. 10 | Page Public Health Florida Internation al University’s Center for Substance Use and AIDS Research on Latinos in the United States - Center for Excellence, funded by the National Center for Minority Health Disparities in partnership with Spectrum Programs, Inc. and Miami Behavioral Health. The C enter contributes to the reduction, prevention and eventually the elimination of Latino Health disparities. Principal Investigators are faculty members as well as an executive staff member representing the two community agencies work together with their N P students deliver primary care services to indigent women, children, and families R' Us Care Center in West Dade.  College of Staten Island/City of New York has a research partnership with the New York City Department of Health and Mental Hygiene; a Brea st Educational Partnership with Staten Island High Schools; and Breast Cancer Education Speaking Engagements throughout the Staten Island/Manhattan communities.  Indiana University - Purdue University Indianapolis is partnering with the Marion County Health Department to develop a series of Quality of Life (QoL) indicators and deploying the information to the Web. The Community Health Engagement Program (CHEP) aims to link the experience and skills of community leaders, health professionals, and university r esearchers to improve the health of Indiana citizens. Research for Government and/or Community Agencies Universi

9 ty of Missouri - Kansas City’s Co
ty of Missouri - Kansas City’s Cookingham Institute of Urban Affairs at the UMKC Bloch School and UMKC's Center for Economic Information brough t Social Compact, a national nonprofit coalition that promotes successful investment in communities, to Kansas City to conduct an in - depth DrillDown study. The project, now known Project Kansas City Urban MarketAssets (KCUMA), uses a multitude of city, sta te and commercial data records to create a more accurate picture of demographic and economic information in urban core neighborhoods. The DrillDown study: provides accurate market information about our urban core areas; estimates urban population using mul tiple data sources from federal, state and city levels as well as transactional data (utility, purchases, and tax information); and uncovers hidden market assets, like population, true purchasing power, and the informal economy. Kansas City is the 15th cit y nationwide to conduct a DrillDown.  University of Nebraska at Omaha’s Center for Public Affairs Research provides labor and economic statistics and training for use of such statistics to Nebraska officials, administrators, and staff. Additionally, the S chool or Public Administration faculty and staff work with county, city, and Omaha Community Foundation on various projects to develop performance measures, financial and economic forecasts, nonprofit capacity development and provide expert consultation in other aspects of public management. Professional Development and Technical Training Programs for Municipal Government or Community Agencies University of North Texas at Dallas created the Caruth Police Institute in 2009 with the primary purpose to serve the needs of the Dallas Police Department. The first objective was to identify and train a new generation of DPD leaders and to develop innovative strategies for sustainable, positive efforts in fighting crime, preventing victimization, and enhancing the DPD core leadership of the Dallas Police Department.  At Weber State University the Business Education department developed and conducted a technical training program for the Internal Revenue Service employees. In addition the College of Applied Science and Technology has done several training programs for employees of Hill Air Force Base.  The Continuing Studies Department at The University of Washington Tacoma organizes and offers several courses in the following relevant areas: Fundraising Management , Project Management, GIS, Paralegal Studies, Contract Management, Human Resources, and AutoCad (online). The Continuing Studies Program is self - sustaining with tuition dollars so is not University or State - supported. These courses are attended by members of municipal government and community agencies. 11 | Page Community Engagement: Focus on Education P - 16 Initiatives The beginning of the 21 st century has been marked by sweeping education reform in the United States, in general and especi

10 ally in the “P - 16” area. Primari
ally in the “P - 16” area. Primarily, the gap between college eligibility and college readiness has attracted much attention, as nearly 60 percent of first - year college students discover that, despite being fully eligible to attend college, they are not academically ready for posts econdary studies. 15 It is also concerning that The United States has fallen from first to 12th in the share of adults ages 25 to 34 with postsecondary degrees, according to a new report from the College Board. There exists a missing link in the chain conne cting K – 12 and higher education that stems from a long history of inter - level educational disconnects: among them being disjointed curricula for grades 10 to 14; the evolution of teacher preparation programs; the detachment of community colleges from high schools; and divided governance and finance. Remedying these conditions requires, among other changes, the formation of new educational policies, the institutionalization of associated performance standards in curricula, assessment programs, pre - and in - s ervice teacher training programs, and the review of examinations administered to entering college students for placement. The challenge is to develop systemic approaches to collaboration and coordination of schools and colleges in every state. 16 Although “ P - 16 programs” are relatively new, many states have already seen impressive results in several areas: research and development; policy - making and implementation; university/school partnerships; and teacher and administrator education. CUMU institutions are heavily invested in P - 16 community initiatives that partner with schools and educational agencies at the local, state, federal and global level. Thirty - four of the 40 (85%) respondents are currently engaged in university - assisted community P - 16 initiativ es . Many of the CUMU universities that did not participate in the 2010 survey are also involved in P - 16 programs. Program objectives, for both survey participants and other CUMU members, range from mentoring and college readiness partnerships in high - need communities to global classroom projects where middle schoolers share experiences with students from around the world. Two nationally recognized examples of such initiatives are : 1) T he Center for Research on Educational Access and Leadership at California State University, Fullerton , an institution found ed on educational research. T he center is also instrumental in policy formation and oversees numerous partnership projects. 2) The Rosemont Elementary/Middle School in Baltimore , an excellent example of un iversity/school collaboration where Coppin State actually runs the school, with a focus on instilling critical thinking into the curriculum. Overall, the survey shows that CUMUs have been instrumental in leveraging millions of state, federal and private d ollars to fund these programs. The Center for Urban Educ ation (CUE) at the Metropolitan State College of Denver teams Met

11 ro State with Denver Public Schools, th
ro State with Denver Public Schools, the Mayor's Office for Education and Children, and other partners to ensure that children in geographically - defined, high poverty urban areas will become successful learners and develop into community leaders. The Urban Teacher Partnership (UTP) brings Metro State students to high - needs urban schools in a teacher preparation program aimed at developing the highest quality teachers at P - 12 "Urban Apprentice Schools" located in Denver. Through a $12.5 million grant funded by the National Science Foundation, the Center of Science and Math in Context (COSMIC) at the University of Massachusetts has been working with Boston Public Schools partners to improve sci ence achievement for students in grades 6 through 12. Jackson State University recently helped launch the Mississippi Academy for Science Teaching. The first and only one of its kind, the partnership is funded by an $8.7 million award from the National Sci ence Foundation Math and Science Partnership Program. 12 | Page Community Engagement: Institutional Practices and Leadership The institutional recognition of the “community” and the relationship of the university with and to that community are clearly evident in the responses to the sur vey. Perhaps no more clearly is institutionalized engagement with the urban context found than in the mission statements and strategic documents of CUMU members: 82% of survey respondents prioritize community engagement in their mission statements and 90 % of the CUMU respondents to the survey have community engagement defined in their strategic plans . These findings are equally evident in the practices of the top leadership of CUMU members where all CEOs (presidents, chancellors or designee) of these ins titutions (i.e. 100%) sit on committees of region - wide and city organizations. According to the survey responses, these interventions vary and include, among many listed in the survey, active leadership and participation in foundations, nonprofits, chamber s of commerce, academic organizations, national organizations, education alliances, transportation boards, and a variety of advisory committees. But the notion of community engagement extends well beyond the leadership category. Fully eighty - five percent (85%) of the respondents to the survey have internal university budgetary allocations dedicated to supporting institutional engagement with community (i.e., allocations to special organizations, institutes, or other organizations) and three quarters (75%) of CUMU universities have an assigned office/administrator with the primary responsibility of leading university engagement efforts . The average CUMU member offer s approximately 174 undergraduate and graduate service learning/community based learning cours e sections per academic year . During AY 08 - 09 these courses attracted an average number of unduplicated headcount of students of 3,042 per institution, or about 17.5%

12 of the average CUMU university student b
of the average CUMU university student body. During the same year, AY 08 - 09, the number of full and part - time faculty and staff engaged in university - supported community engagement ( other than service learning ) averaged 340 per institution, or 20% of the total full and part - time faculty and staff. Although only 27 of the 40 surveyed instituti ons were able to report the number of total hours of volunteer community service that students carried out during the AY 2008 - 09 year and only 19 institutions could report how many the faculty and staff participated in such activities, the numbers are clea rly worth reporting . During AY 2008 - 09, at each of the 27 responding institutions, students completed an average of 97,000 hours; faculty averaged 19,950 per institution; and staff averaged 18,770 hours of volunteer service. 13 | Page Community Engagement/ Dev elopment: Programs and Activities Four out of five CUMU institutions, or 80% of the respondents to the survey, have dedicated space for community engagement /development activities. On average there are 15 sites/or spaces located on campus for such developm ent/ engagement and an average of 2.7 such sites off campus. Coppin State University has multiple locations in which engagement with the community occurs, namely the Office of Community Engagement and Strategic Partnerships; Coppin Academy; and Mentoring Male Teens in the Hood. In addition, The Institute for Local to Global Community Engagement at Coppin State University had three offices on campus as well as active partnerships with 20 K - 12 institutions in Baltimore, South Carolina, South Africa, and Keny a, all of which dedicated space to one of our primary community engagement activities -- the Global Classroom Experience. Rutgers University - Newark has three main centers for community engagement. First, the Office of Campus and Community Relations (OC CR) is responsible for overseeing and coordinating community outreach and partnership activity (on campus). Second, the Academic Foundations Center runs the Consortium for Pre - College Education and Community Outreach for K - 16 initiatives in partnership wi th funders and the Newark Public School District (on campus). Lastly, the NJ Collaborative Center for Nursing serves as a catalyst for the implementation of innovative practice and education models for urban communities, and is located off campus. One of the lowest, yet most important and growing, forms of community development participation are Employee Assisted Housing (EAH). Only 15% of the survey’s respondents have EAH programs, and the average institution spent $345,100 to finance these efforts. EAH programs are typically administered by an outside nonprofit or private entity that works directly or indirectly with the university. EAH programs come in the form of subsidies and compensation packages, incentives, loans, and built housing for emp

13 loyees. At California State Polyt
loyees. At California State Polytechnic University, Pomona housing is a priority for the university as the cost of housing in incredibly high and has been an obstacle in recruiting new faculty and staff. In the past two years, the Foundation continued to enhanc e its housing assistance program by completing the sale of a 34 - unit town home development approved by the Foundation for construction in 2007. Unlike traditional home ownership, a faculty/staff member buying a home in the faculty/staff housing program wil l purchase the home but lease the land from the Foundation, greatly reducing costs and enabling university professionals to own a new home near Cal Poly. For sale EAH homes include options for a silent second loan arrangement and 3 - year buyback guarantee. George Mason University has entered into an agreement with an independent not - for - profit organization to finance, build, operate, and own faculty/staff housing on campus at no cost to the University. In addition to the convenience of the housing being l ocated on campus, the rental rates are set below market. In October 2007, Temple University initiated the Temple University's Employee Home Ownership Program, which offers financial help for those who purchase a home in the communities surrounding the Mai n Campus and Health Sciences Center in North Philadelphia. Through a combination of programs, full - time Temple employees may be eligible to receive up to $17,000 in funding toward the purchase of homes within selected Philadelphia ZIP codes. The program wa s designed to help Temple employees put down deeper roots in the neighborhoods around the university - where about 500 Temple employees live now. 14 | Page Almost two - thirds, or 63% , of CUMU universities provide support to outside nonprofit organizations related to community and neighborhood development , investing on average $1,231,100 , annually , in such activities . However, much of the support to outside nonprofits organizations is comprised of invaluable in - kind services that cannot be monetized; thus the contr ibutions exceed the monetary investme nt reported in the survey . University of Arkansas at Little Rock (UALR), through its University District Department provides staffing and office overhead support to the University District Development Corporation, a pr ivate nonprofit community development corporation that qualifies for community and economic development funding from federal, state and local governments. University of Cincinnati invests in community development by providing operating support grants to i ndividual neighborhood development corporations in addition to providing significant funding to the Uptown Consortium, an alliance of the five largest employers in Uptown (UC being the largest). The Uptown Consortium was chartered to improve the neighborho ods around its employer members. Virginia Commonwealth University , in addition to many other programs, offers one credit clas

14 ses and leadership workshops for nonpro
ses and leadership workshops for nonprofit organizations in Central VA through the Nonprofit Learning Point. Courses are offered a t discount rate to ensure access for nonprofit staff and volunteers. 1100 students enrolled in 61 different classes. Administration offices and classroom space provided by the Division of Community Engagement. In addition to its paid memberships in a vast array of organizations, Portland State University supports outside non - profits through its faculty's service on governing or advisory boards; as unpaid consultants and advisors on specific projects; as a convener of meetings with community partners; with s pecific contractual agreements to provide services to organizations (e.g. population estimates and mapping); and with financial sponsorships of activities (speakers, workshops). Furthermore, PSU’s students -- both undergraduate and graduate -- continue to participate in our service learning and Capstone programs where they work in teams in the community to address real problems. PSU estimates that their students contributed 1.54 million hours of volunteer time, worth $26.95 million to the community in 2008 - 09. PSU also tracks expenditures of our service units in three categories: sponsored community service on campus; sponsored community service off campus; and other community services. Expenditures in these program codes were approximately $19 million in 08 - 09. PSU also provides on campus space on a short - term basis to a number of small non - profits whose missions compliment. Finally, our College of Extended Studies continues to devote approximately 15% of its time in direct service to outside nonprofit organ izations. “Stabilizing and enhancing the surrounding neighborhood is a critical pillar of the President's mission. His efforts were instrumental in getting 1/4 billion dollars invested in the local community.” - Morgan State University “Our eff orts increase the aesthetics of the neighborhood, promoting "green" awareness, cleanliness, and enjoyment of the neighborhood and environment by the entire community.” - Pace University “It is very important that we help with enhancing the surroun ding neighborhood. It improves relationships between us and the community. It is important that we also show the community that we want to help keep this area looking beautiful.” - Towson University 15 | Page II. UNIVERSITY ECONOMIC AND COMMUNITY DEVELOPM ENT AND IMPACT Universities located in cities and in the surrounding metropolitan areas have been key players in the building and revitalization of cities. As anchor institutions, they are major employers and developers, they stimulate and nurture new eco nomic enterprises, they build the workforce, and they enrich the cultural life of America’s cities. Perhaps in no place in the survey is the overall impact of CUMU universities in their communities better exhibited than in their expendit

15 ures. As shown in the table below CUMU
ures. As shown in the table below CUMU institutions responding to the survey 17 spent, on average, over one - third of a billion dollars annually in their urban/metropolitan regions, with almost $300 million, on average, being spent annually by an institution on wages and salar ies and goods and services, essentially going to those living and working in their urban/metropolitan regions (see summary table below). Total Spending for all reporting CUMU member (FY 2009) Average Per CUMU (reported in survey) Total of all CUMU (repo rted in survey) n (Number Responses) Total expenditures at the urban/metropolitan campus $347,000,000 $13,537,371,700 39 Construction and renovation of facilities $41,881,000 $1,549,625,400 37 Taxes (federal, state, and local on property and payroll) $1 ,313,000 $40,716,800 31 Wages and salaries of all university employees $182,000,000 $7,270,731,478 40 Purchase of goods and services $105,000,000 $4,079,896,400 39 When it comes to reporting on more particular investments in the physical facilities of the university and the city/regions, t he average CUMU institution has 4.3 cultural facilities (e.g., theaters, concert venues) that are owned or used by their university. On average, 69,600 people attended these cultural facilities by institution (total a ttendees, not unduplicated) in FY 2009. These cultural facilities not only benefit the u niversity, but they also serve the community. The average university rents or loans these cultural facilities to 94 different organizations or community groups annual ly. Similarly, each institution owns or uses an average of 5 athletic facilities , which serve an average of over 165,000 attendees per institution, annually. Also, annually, the average CUMU university shares these sports facilities with 49 other organiz ations or community groups. 16 | Page Community Development: University Real Estate Institutions of higher education are intrinsically integrated into the urban fabric of their large metropolitan areas because they are generally large landholders with fixed as sets. Thus, universities have the capacity to play a transformational role in city planning and development. The average CUMU member owns approximately 340 acres and 3.5 million square feet of urban/metropolitan campus real estate that is value d at an est imated $540 million . The average CUMU institution leases an additional 20 acres or 137,000 square feet of real estate at an estimated worth of $10 million . The total mixed - use real estate on the average CUMU’s campus totals 5 acres , with building space o f 476,000 square feet , and a value of a bit over $42 million . Further, CUMU members have a large amount of urban real estate that has the potential to be invested in and developed. The average institution owns 112 acres of undeveloped land and accompany ing assets worth, on average

16 , approximately $5 million per devel
, approximately $5 million per developable urban parcel. Increasingly, colleges and universities are attracting private development to their campuses. The average CUMU member has about 85,000 square feet of privately owned rea l estate on their campus worth over $6.2 million per campus. In addition colleges and universities are creating short and long term leases to private developers . In fact this relatively new asset development strategy is allowing the average CUMU campus t o lease about 215,0 0 0 square feet of real estate , worth approximately $35 million . In 2008, the University of Louisville (UofL) entered into an affiliation agreement with Edwards Companies to build, design, and manage a housing community of apartments o n the edge of Belknap campus. They own the land and invested their funds to build garden style apartments adding 858 beds for university students. The community opened in August 2009. UofL collaborates with the management staff on programming and recrui tment of residents, and assists in student development and life issues. This beautiful and vibrant community, which was once a blighted "brownspace", has added value to our residents' living options, added beds to our program and provided much needed clos e living for upperclass and graduate students. As part of its commitment to the economic revitalization of Chester, Widener University granted a ground lease for 10 acres adjoining the campus for the development of University Crossings. This is a $5 0 million project that not only brought new businesses and services to the campus and Chester, but also creates more than 100 new jobs. The land, which was formerly a tax - exempt parcel, has been added to the Chester tax rolls, and over the next 10 years, w ill generate an estimated $1.8 million in property tax revenue, more than $800,000 in earned income tax revenue from the new jobs created, and $600,000 in business privilege taxes. The project includes the 48 room Widener Hotel & Suites, the first hotel to open in Chester in 35 years, 57 apartments available to the community, a 7Eleven convenience store, a Chester police substation and TD Bank, the first bank to open in Chester in 15 years. 17 | Page Community Development: Land Development Practices When asked if their university is currently engaged in urban/metropolitan planning and development partnerships in off - campus housing or commercial or mixed - use real estate , 55% of the respondents claimed that they are currently so engaged. These projects range from public - private partnerships to build university amenities to city - university partnerships to plan entire university and community academic, retail, or residential corridors. The average amount of funds that each university directed toward these projects in FY 2009 was $ 3,006,000 , even though 5 of these respondents reported $0 spent in FY 2009. Additionally, it was reported that the total

17 value of these projects (including fu
value of these projects (including funds from partners) , on average , per institution , was $ 80,939,000 , even though the total average university investment in these projects was $ 17,081,000 . Thus, the universities were able to leverage their investments at a ratio of over 4 to 1 . Almost two thirds (or 60% ) of CUMU universities are invested in beautification efforts (e.g., street - scaping, signage) in the neighborhoods adjacent to the ir campus es in FY 2009. They have invested , on average , $ 169,000 in these efforts ; includ ing landscaping, demolition and rebuilding physical structures , signage, initiating service days dedicat ed to clean up and beautification, establishing partnerships for development, and claiming /reclaiming unwanted property. The University of Baltimore designed an urban campus landscape plan that provides a sense of place and arrival for the core of campus a nd its boarder streets. Over 60 trees and landscape gardens are planned for the city sidewalk surrounding the campus. UB also removed eclectic campus signage and established consistent size/style LED light signage on all buildings. Virginia Commonwealth U niversity provides irrigation systems and landscaping maintenance on a city - owned park adjacent to campus. While VCU has not specifically invested in neighborhood projects - and are prohibited in spending public money to do so - they make considerable effo rt to design their facilities within the character and scale of adjoining neighborhoods. Also they have made streetscape improvements – brick sidewalk pavers, street lighting, and trees to city - owned property adjacent to campus. Community Development: Pu blic Safety Initiatives The average CUMU member spent $2.3 million on public safety initiatives in FY 2009. In addition, 72% of the institutions provide security personnel or police officers to patrol the neighborhoods surrounding their campuses. They em ployed an average of 27 full - time sworn police officers and/or 23 full - time security personnel in addition to the12 part - time sworn in officers and 28 part - time security personnel. Percentage of CUMUs involved in or providing their campus’ surrounding neig hborhoods with the following Public Safety Initiatives Additional provision of lighting 61% Neighborhood block watch initiatives 32% Public safety awareness and training 90% Crisis Planning 87% Neighborhood police officers/security personnel 72% 18 | Page Eco nomic Development: Local Workforce Development Partnerships A substantial number, or 70% , of the CUMU members provide local small business assistance though in - direct funding, low interest loans, training, etc. CUMU institutions invested an average of $4 29,000 in workforce development efforts. Buffalo State College provides comprehensive one to one business counseling to entrepreneurs. The business owner typically receives 5 or more ho

18 urs of counseling. Areas of counseling
urs of counseling. Areas of counseling include business plan developmen t, loan preparation, human resource management assistance, market analysis, and advertising and export assistance. In order to provide this service to the community the college procured approximately $366,000 in grant funding. In 2009 the center directly a ssisted 893 entrepreneurs. As a result of the counseling, the Buffalo State business advisors assisted entrepreneurs in securing $9,134,480.00 in funding. The college maintains records that support this data. Jackson State University’s Small Business Deve lopment provides one on one free and confidential small business counseling to over 530 clients per year in an variety of areas: including accounting, management, marketing, loan packaging, business planning, taxes, etc . Jackson State sponsors workshops w ith over 1,000 attendees per year on a variety of topics: accounting, management, marketing loan packaging, business planning, procurement, technology, and taxes planning. The last fiscal year the JSU SBDC business clients obtained over $8,000,000 in loans and capital investment; while creating 138 new jobs and retaining 863 jobs. JSU SBDC assisted in starting 63 new businesses. At Rutgers University – Newark the Entrepreneurship Pioneers Initiative, funded by a WIRED grant from the Dept of Labor through t he North Jersey Partnership its first year, the Business School trained 50 entrepreneurs on how to grow their businesses. This program will continue next year through grants from PNC Bank and the Prudential Foundation. Economic Development: Technology T ransfer Universities have wide - ranging educational and research capability, which positions them especially well , not only to enter into productive partnerships, but also to develop an evolving body of knowledge. In FY 2009, the average CUMU submitted 24 i nventions; filed 21 patents; had 5 active licensing agreements; and netted a half million in income from royalties. Rutgers University – Camden leases space for a non - profit technology incubator. The incubator has 41 client companies with 185 employees ea rning a total of $7 million in annual salary. In addition, the incubator has spun off fourteen companies. Eleven have stayed in New Jersey, producing 160 jobs and more than $8 million in annual salary. University of Missouri - St. Louis created an antivi ral drug to treat all clinically important forms of the Human Papillomavirus (HPV). This would be the first therapeutic agent, offering non - surgical treatment options for women affected by the virus that can lead to cervical cancer. 19 | Page The table below show s that, as a group, CUMU universities are active in research that can be turned into patents, licensing agreements and business contracts. The latter element of technology transfer is , perhaps , the most important to emphasize here, with almost $4.5 millio n annually being the value of the business contracts ema

19 nating for on campus contract research .
nating for on campus contract research . Technology Transfer all reporting CUMU members (FY 2009) Average Per CUMU (reported in survey) Total of all CUMU (reported in survey) n (Number Responses) N umber of Inventions and/or Disclosures Submitted 23.7 18 735 31 U.S Patents Filed 21 19 630 30 U.S. Patents Issued 1.9 55 29 Foreign Patents Files 8.4 226 27 Foreign Patents Issued 1.2 34 29 Licensing Agreements Established 5.4 152 28 Net Income from Ro yalties $436,200 $11,342,300 26 University Tech Transfer Operating Expenses $312,100 $7,490,800 24 Net Legal Expenses $258,000 $6,191,800 24 Legal Fees Reimbursed $146,700 $3,520,800 24 Income Associated with Technology Transfer Activities Available fo r Distribution $410,800 $19,679,700 26 Number of Business Contracts for Joint Ventures 0.22 4 18 Number of Business Contracts for Contract Research 78 1,639 21 Value of Business Contracts for Contract Research $4,481,500 $85,148,500 19 Moving For ward The reported results from this research, both secondary data collection and survey results, are evidence of the importance of institutions of higher education, specifically CUMUs, to their cities. With this report the Coalition of Urban and Metropoli tan Universities attempts to move beyond the rhetoric of such importance to show the contributions of its members. Through the new 21 st Century Declaration of CUMU (printed below) the Coalition promises to continue this type of data collection, research, and dissemination as part of their mission to continue to serve their campuses and communities. 20 | Page 21st Century Declaration of the Coalition of Urban and Metropolitan Universities America has long been an urbanized nation , and urban areas house many of our nation’s greatest universities. Today, more than two - thirds of America’s population and two - thirds of its jobs are based in major metropolitan areas, which produce 75 percent of the nation’s output. Our future will be shaped by the success of its metropoli tan hubs as sources of innovation, creativity, health care, transportation, employment, governance and education. In recent years, many of America’s central cities have revitalized dramatically. During the 1970s, America’s central cities increasingly becam e home to poor and minority citizens. As middle class and affluent residents were attracted to the suburbs, many assumed that America’s urban centers had no real future. Although still home to some of America’s poorest individuals and some of our nation’s most serious social dilemmas, central cities are reasserting themselves as national centers of business and cultural life. Universities located in cities and in the surrounding metropolitan areas have been key players in this revitalization, and will play an even greater role in the future. As anchor institutions, they are major employers and develo

20 pers, they stimulate and nurture new eco
pers, they stimulate and nurture new economic enterprises, they build the workforce, and they enrich the cultural life of America’s cities. They partner with gov ernment, community organizations, health care systems, public schools, not - for - profit civic groups and others to address the needs of urban residents, provide vital services and strengthen their host city’s social fabric. Urban and metropolitan universitie s also draw on the rich array of business, governmental, cultural and civic institutions located in urban areas to expand student learning and enhance research opportunities for faculty and students. Urban university community engagement enriches metropoli tan communities while strengthening the universities’ core commitment to teaching and research. We, the leaders of urban and metropolitan universities, declare that our future as knowledge organizations will continue to be forged by sustained, reciprocal e ngagement with our cities. With its founding in 1989, the Coalition of Urban and Metropolitan Universities took the lead in defining the concepts of university - community engagement and stewardship of place, driven by a commitment to knowledge exchange and reciprocity. Today, our research, teaching and engagement agendas reflect the traits and ambitions of our regions. Our intellectual capacity contributes significantly to metropolitan planning and development, the enhancement of social capital and cultural enrichment, the improvement of schools and educational outcomes, and the preparation of globally connected, action - oriented civic leaders. Therefore, as members of the Coalition of Urban and Metropolitan Universities, we agree to continue to build both our cities and higher education institutions by acting collectively to:  Provide conference and publication venues to identify and disseminate best practices in engagement and university - community collaboration  Advocate for federal and state policies and progr ams that recognize and enhance the role of universities in the future development of our major metropolitan areas and the education of their residents  Educate students to understand the importance of civic engagement by citizens and the importance of Ameri ca’s cities to the nation’s future  Support professional development for university leaders that will strengthen their ability to build the partnerships that our cities and our nation require  Focus on the power of university - community engagement to address many of the economic, cultural, racial, social and governance issues of our cities  Use the intellectual resources of the university to foster innovation, entrepreneurship and economic growth  Work collaboratively with public schools to foster community part nerships that enhance the opportunities for urban children to graduate from high school prepared for post - secondary education 21 | Page Acknowledgments The survey was initiated and created through the ded

21 ication and hard work of the CUMU Ad - H
ication and hard work of the CUMU Ad - Hoc Survey Steering Committee, including John Christensen, Bill C ovino, Mark Winston, Jane Akers, and Linda Mannering . This project would not have been possible without the invaluable leadership provided by Bobbie O’Connell and Nicole S chiral di who administer the Coalition. We would also like to recognize the research support of John Sheaffer at Great Cities Institute and the Survey Research Laboratory at the University of Illinois at Chicago. The survey instrument and results would not have come to fruition without the support of and extensive feedback from all CUMU me mber institutions, whose participation in this endeavor is greatly appreciated. This report is authored by: Great Cities Institute at the University of Illinois at Chicago David Perry Carrie Menendez March 2011 A Selection of Comments from Participants “This survey requires a great deal of collaboration between a number of offices. We wo uld be most interested in the results.” “The survey is very detailed. While describing the initiatives in narrative form is relatively straightforward, defining them in terms of accessible data is not as easy. The data requested often has not been collect ed (if it has been collected at all) in a form that corresponds readily to your data needs. This survey was a challenge, yet we learned a lot about our own institution by attempting to complete it.” “We have not yet been able to track the community serv ice of our students, faculty and staff, performed on a voluntary, individual basis. A survey to that effect would be an appropriate task for the proposed Office of Campus Community Partnerships.” “The survey has motivated us to gather additional informati on about our campus activities and for that we are thankful to CUMU.” 22 | Page 1 The Integrated Postsecondary Education Data System (IPEDS) is the U .S. Department of Education’s National Center for Educational Statistics. 2 A large city is defined as a territory inside an urbanized area and inside a principal city with population of 250,000 or mor e. A large suburb is defined as a territory outside a p rincipal city and inside an urbanized area with population of 250,000 or more. “Degree of Urbanization” is based on IPEDS variable descriptions and data collected for the 2008 - 09 Academic Year. 3 The data is representative of only the U.S. institutional m embers of CUMU and is derived from the Integrated Postsecondary Education Data System (IPEDS) housed at the U.S. Department of Education, National Center for Educational Statistics. 4 IPEDS recently adopted a new classification system for doctor’s degrees: research/scholarship, professional practice, and other. “Professional practice” accounted for the largest portion of doctor’s degrees with 785 awarded during the 2008 - 09 academic year. 5 Initiatives for a Competitive Inner City

22 (ICIC). 2002. Leveraging colleges and
(ICIC). 2002. Leveraging colleges and cities for urban economic development: An action agenda. Boston: CEO’s for Cities 6 Webber, Henry and Mikael Karlstrom, 2009. Why Community Investment is Good for Non - Profit Anchor Institutions. University of Chicago: Chapin Hall. 7 Perry , David C. and Wiewel , Wim. eds. 2005. The University as Urban Developer: Case Studies and Analysis . Armonk, NY: M.E. Sharpe, Inc. 8 Perry, David C., Wiewel , Wim, and Menendez, Carrie 2009. The City, Communities, and Universities: 360 Degrees of Planning and Development. Cambridge MA: Lincoln Institute of Land Policy. 9 Data taken from The Brookings Institution, 2009. Blueprint for American Prosperity: U nleashing the Potential of a Metropolitan Nation, (retrieved June 10, 2009, from The Brookings Institution Web site ) 10 Core expenditures are calculated using the total dollars reported for public institutions using GASB 34/35 and public and private - not - fo r - profit institutions using FASB for FY 2008 as reported to IPEDS. 11 Core revenues are calculated using the total dollars reported for public institutions using GASB 34/35 and public and private - not - for - profit institutions using FASB for FY 2008 as reporte d to IPEDS. 12 Note: At the time of distribution of the survey there were 68 domestic members of CUMU. Currently there are 72 as we indicated in the “Introduction” of this report.. The secondary national data, following the Introduction, describes the cur rent membership; while the survey findings describe the responses from the membership as it stood at the time of distribution of t he survey. 13 Monetary values and other quantitative data will not be reported at the institutional level unless it was provide d by the respondent in narrative form on the returned survey. 14 For more detailed examples and case studies, please contact the national administrative office of CUMU. 15 The National Center for Public Policy and Higher Education. 2010. Beyond the Rhetoric: Improving College Readiness Through Coherent State Policy. A special report by the national center for public policy and the southern regional Education Board. 16 A combination of findings from the survey and results reported in the policy brief, “Beyond t he Rhetoric: Improving College Readiness through Coherent State Policy,” (June, 2010) by the National Center for Public Policy and Higher Education and the Southern Regional Education Board. 17 The calculation of average total expenditures from the survey respondents is larger than the average total expenditures reported on page 6, which is calculated average of all CUMU members. The numbers vary due to the sample of respondents reporting larger expenditures than the average CUMU member. 18 Note: 12 of the 31 valid responses were 0 when asked the number of inventions and/or disclosures submitted to their technology transfer office (or its equivalent). 19 Note: 11 of the 30 valid responses were 0 for the number of US Pa