/
Lecture 10: Ocean Carbonate Chemistry: Lecture 10: Ocean Carbonate Chemistry:

Lecture 10: Ocean Carbonate Chemistry: - PowerPoint Presentation

karlyn-bohler
karlyn-bohler . @karlyn-bohler
Follow
465 views
Uploaded On 2015-10-21

Lecture 10: Ocean Carbonate Chemistry: - PPT Presentation

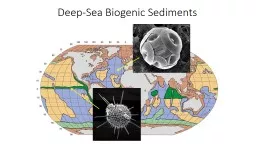
Ocean Distributions Ocean Distributions Controls on Distributions What is the distribution of CO 2 added to the ocean See Section 44 Emerson and Hedges Sarmiento and Gruber 2002 Sinks for Anthropogenic Carbon ID: 168332

alk co2 co32 dic co2 alk dic co32 ocean caco3 hco3 mol pco2 deep ddic h2co3 2004 ch2o pacific

Share:

Link:

Embed:

Download Presentation from below link

Download Presentation The PPT/PDF document "Lecture 10: Ocean Carbonate Chemistry:" is the property of its rightful owner. Permission is granted to download and print the materials on this web site for personal, non-commercial use only, and to display it on your personal computer provided you do not modify the materials and that you retain all copyright notices contained in the materials. By downloading content from our website, you accept the terms of this agreement.


Presentation Transcript

Slide1

Lecture 10: Ocean Carbonate Chemistry: Ocean DistributionsOcean DistributionsControls on Distributions

What is the distribution of CO2 added to the ocean?

See Section 4.4 Emerson and HedgesSlide2

Sarmiento and Gruber (2002) Sinks for Anthropogenic Carbon

Physics Today August 2002 30-36Slide3

CO2

CO

2

→ H

2

CO

3

→ HCO3- → CO32-

+ H

2O = CH2O + O2

B

orgC

+ Ca

2+ = CaCO3

B

CaCO3

Atm

Ocn

Biological Pump

Controls:

pH of ocean (controlled by DIC and Alk)Sediment diagenesis

CO2

Gas Exchange

Upwelling/

Mixing

River Flux

CO

2 + rocks = HCO3- + claysSlide4

Influences on pCO2

K

o

: Solubility of

CO

2

(same as K

H

)

K

1, K2: Dissociation constants

Function of Temperature, Salinity

Depends on biology

and gas exchange

Depends on biology only

Derive starting with: CO2(g) + CO32- = 2 HCO

3-And use alk – DIC ~ CO3

2- and 2DIC – alk ~ HCO3-Slide5

Ocean Distributions – versus depth, versus ocean

Atlantic

Pacific

Points:

1. Uniform surface

concentrations

2. Surface depletion -

Deep enrichment

3. DIC < Alk

4. D

DIC >

DAlk

See Key et al (2004)GBC

Q?Slide6

Controls on Ocean Distributions

A)

Photosynthesis/Respiration

Organic matter (approximated as CH

2

O for this example) is produced and consumed as follows:

CH

2

O + O

2  CO2 + H

2OThen: CO2 + H2O

 H2CO3* H2CO3* 

H+ + HCO3- HCO3-

 H+ + CO32-As CO2 is produced during respiration we should observe: pH

 DIC  Alk  PCO2

 CO2 is an acidThe trends will be the opposite for photosynthesis.B) CaCO3 dissolution/precipitation

CaCO3(s)  Ca2+ + CO

3 2-Also written as: CO32- is a baseCaCO3(s) + CO

2 + H2O  Ca2+ + 2 HCO3-

As CaCO3(s) dissolves, CO32- is added to solution. We should observe: pH  DIC 

Alk  PCO2 

Summary: DIC is from both organic matter and CaCO3

Alk is only from CaCO3Slide7

Influence of Nitrogen Uptake/Remineralization on Alkalinity

NO

3

-

assimilation by phytoplankton

106 CO

2

+ 138 H

2O + 16 NO3- → (CH

2O)106(NH3)16 + 16 OH- + 138 O2NH4 assimilation by phytoplankton106 CO2 + 106 H2

O + 16 NH4+ → (CH2O)106(NH3)16 + 16 H

+ + 106 O2NO3

- uptake is balanced by OH- productionAlk ↑NH4+ uptake leads to H+ generationAlk

↓Alk = HCO

3- + 2 CO32- + OH- - H+

See Brewer and Goldman (1976) L&OGoldman and Brewer (1980) L&O

Experimental CultureSlide8

The main features are:

1. uniform surface values2. increase with depth3. Deep ocean values increase from the Atlantic to the Pacific4. DIC < Alk DDIC > DAlk5. Profile of pH is similar in shape to O2.6. Profile of PCO2

(not shown)

mirrors O

2

.

Ocean Distributions of, DIC, Alk, O

2

and PO

4 versus Depth and OceanSlide9

Inter-Ocean ComparisonSlide10

Carbonate ion (CO32-) and pH decrease from Atlantic to Pacific

x 10-3 mol kg-1 x 10

-6

mol kg

-1

Alk

DIC CO32- pHSurface Water 2.300 1.950 246

8.12North Atlantic 2.350 2.190 128 7.75 Deep WaterAntarctic 2.390 2.280 101 7.63 Deep WaterNorth Pacific 2.420 2.370 72 7.46 Deep water

Deep Atlantic

to Deep Pacific

D

Alk = 0.070DDIC = 0.180SoDAlk/DDIC = 0.40

CO

32- decreases fromsurface to deep Atlanticto deep Pacific. These CO32- are from CO2Sys.Can Approximate as CO32- ≈

Alk - DIC

Q? CO2Sys/CO2Calc

S = 35T = 25CSlide11

Composition of Sinking Particles and Predicted ChangesSlide12

Composition of Sinking Particles and Predicted Changes

Assume the following average elemental composition of marine particulate matter P N C Ca SiSoft Parts 1 15 105 0 0Hard Parts 0 0 26 26 50Composite 1 15 132 26 50

Implies Org C / CaCO3 ~ 105/26 ~4/1

The impact of this material dissolving

CH

2

O + O

2

 CO2 + H2O DDIC = 1 DAlk

= 0 CaCO3  Ca2+

+ CO32- DDIC = 1 DAlk

= 2 1 mol CaCO3 4 mol orgC CompositeD

DIC 1 4 5DCa 1 0 1Dalk 2 0 2Consequences: 1)

DAlk/DDIC = 2/5 = 0.40 (DIC changes more than Alk)

2) Dalk – DDIC ~ DCO3

2- = 2 – 5 = -3 (CO3 2- decreases)Slide13

Ocean Alkalinity versus Total CO2 in the Ocean(Broecker and Peng, 1982)Slide14

Emerson and Hedges Color Plate

D

DIC/

D

Alk

≈ 1.5/1

Work Backwards

D

Alk / DDIC ≈ 0.66 = 2/3= 2 mol Org C / 1 mol CaCO3Slide15

From Klaas and Archer (2002) GBC

Data from annual sediment traps deployments

5 g POC g m

-2

y

-1

/ 12 g mol

-1

=

0.42 mol C m-2 y-1

40 g CaCO3 g m-2 y-1 / 105 g mol-1 = 0.38 mol C m-2 y-1

What is composition of sinking particles?

Org C / CaCO3 ~

1.1

Q. What does this imply?Slide16

PIC/POC in sediment trap samplesSlide17

POC and CaCO3 Export Fluxes


This Study

Previous Studies

POC (Gt a

−1

)

Global export

9.6 ± 3.6

11.1–12.9 [Laws et al., 2000]

b

9.2 [Aumont et al., 2003]

c

8.6 [Heinze et al., 2003]

c

8.7–10.0 [Gnanadesikan et al., 2004]

c

9.6 [Schlitzer, 2004]

d

5.8–6.6 [Moore et al., 2004]

c

CaCO

3

(GtC a

−1

)

Global export

0.52 ± 0.15

0.9–1.1 [Lee, 2001]

b

1.8 [Heinze et al., 1999]

c

1.64 [Heinze et al., 2003]

c

0.68–0.78 [Gnanadesikan et al., 2004]

c

0.38 [Moore et al., 2004]

c

0.84 [Jin et al., 2006]

c

0.5–4.7 [Berelson et al., 2007]

b

Based on Global Model results of

Sarmiento et al (2992) GBC; Dunne et al (2007) GBC

POC/CaCO

3

= 9.6 / 0.52 = 18.5Slide18

Revelle Factor

The Revelle buffer factor defines how much CO2 can be absorbed by homogeneous reaction with seawater. B = dPCO2/PCO2 / dDIC/ DICB = CT / P

CO2

(

P

CO2

/∂C

T)alk = CT (∂PCO2/∂H)alk P

CO2 (∂CT/∂H)alkAfter substitutionB ≈ CT / (H2CO3 + CO32-)For typical seawater with pH = 8, Alk = 10-2.7 and CT = 10-2.7H2CO3 = 10-4.7 and CO32- = 10-3.8; then B = 11.2

Field data from GEOSECS

Sundquist et al., Science (1979)

dPCO2/PCO2 = B dDIC/DIC

A value of 10 tells you that a change of 10%in atm CO2 is required to produce a 1% change in total CO2 content of seawater, By this mechanism the oceans can absorb about half ofthe increase in atmospheric CO2 B↑ as T↓ as CT

↑Slide19

CO2

CO

2

→ H

2

CO

3

→ HCO3- → CO3

2-

Atm

Ocn

350ppm + 10% = 385ppm

11.3 mM+1.2 (10.6%)

12.51640.5 m

M+27.7 (1.7%)1668.2

183.7-11.1 (-6.0%)174.2

Revelle Factor Numerical Example (using CO2

Sys)

CO2 + CO32- = HCO3-

1837+17.9 (+0.97%)1854.9

DIC

The total increase in DIC of +17.9 mM is mostly due to a big changein HCO3- (+27.7 mM) countering a decrease in CO32- (-11.1

mM).Most of the CO2 added to the ocean reacts with CO32- to make HCO3-.The final increase in H2CO3 is a small (+1.2

mM) portion of the total.

at constant alkalinitySlide20
Slide21

Emerson and Hedges Plate 8Slide22

Effect of El Nino on ∆pCO

2

fields

High resolution pCO

2

measurements in the Pacific since Eq. Pac-92

Eq Pac-92 process study

Cosca et al. in press

El Nino Index

P

CO2sw

Always greater

than atmosphericSlide23

Photosynthesis/respiration (shown as

apparent oxygen utilization or AOU = O

2,sat

– O

2,obs

)

and CaCO

3

dissolution/precipitation vectors (from Park, 1969)

CH2O + O2 → CO2 + H

2O as O2↓ AOU ↑ CO2 ↑