/
Lecturer’s desk INTEGRATED LEARNING CENTER Lecturer’s desk INTEGRATED LEARNING CENTER

Lecturer’s desk INTEGRATED LEARNING CENTER - PowerPoint Presentation

karlyn-bohler
karlyn-bohler . @karlyn-bohler
Follow
345 views
Uploaded On 2019-12-01

Lecturer’s desk INTEGRATED LEARNING CENTER - PPT Presentation

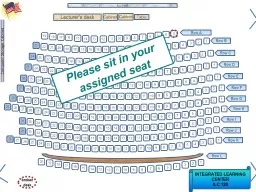
Lecturers desk INTEGRATED LEARNING CENTER ILC 120 Screen 11 10 2 1 9 8 7 6 5 13 12 15 14 17 16 19 18 4 3 Row A Row B Row C Row D Row E Row F Row G Row H Row I Row J Row K Row L Computer Storage Cabinet ID: 768809

incentive number cookies sold number incentive sold cookies anova row null groups variable sum girl reject effect troop

Share:

Link:

Embed:

Download Presentation from below link

Download Presentation The PPT/PDF document "Lecturer’s desk INTEGRATED LEARNING CE..." is the property of its rightful owner. Permission is granted to download and print the materials on this web site for personal, non-commercial use only, and to display it on your personal computer provided you do not modify the materials and that you retain all copyright notices contained in the materials. By downloading content from our website, you accept the terms of this agreement.


Presentation Transcript

Lecturer’s desk INTEGRATED LEARNING CENTER ILC 120 Screen 11 10 2 1 9 8 7 6 5 13 12 15 14 17 16 19 18 4 3 Row A Row B Row C Row D Row E Row F Row G Row H Row I Row J Row K Row L Computer Storage Cabinet Cabinet Cabinet Table 20 11 10 2 1 9 8 7 6 5 21 20 23 22 25 24 27 26 4 3 28 13 12 14 16 15 17 18 19 11 10 2 1 9 8 7 6 5 21 20 23 22 25 24 26 4 3 13 12 14 16 15 17 18 19 11 10 2 1 9 8 7 6 5 21 20 23 22 25 24 26 4 3 13 12 14 16 15 17 18 19 11 10 2 1 9 8 7 6 5 21 20 23 22 25 24 27 26 4 3 28 13 12 14 16 15 17 18 19 29 11 10 2 1 9 8 7 6 5 21 20 23 22 25 24 27 26 4 3 28 13 12 14 16 15 17 18 19 11 10 2 1 9 8 7 6 5 21 20 23 22 25 24 27 26 4 3 13 12 14 16 15 17 18 19 11 10 2 1 9 8 7 6 5 21 20 23 22 25 24 26 4 3 13 12 14 16 15 17 18 19 11 10 2 1 9 8 7 6 5 21 20 23 22 25 24 4 3 13 12 14 16 15 17 18 19 11 10 2 1 9 8 7 6 5 21 20 23 22 24 4 3 13 12 14 16 15 17 18 19 11 10 2 1 9 8 7 6 5 21 20 23 22 4 3 13 12 14 16 15 17 18 19 11 10 9 8 7 6 5 4 3 13 12 14 16 15 17 18 19 broken desk

BNAD 276: Statistical Inference in ManagementSpring 2016 WelcomeGreen sheets

Before our next exam (April 7th) OpenStax Chapters 1 – 12Plous (2, 3, & 4) Chapter 2: Cognitive Dissonance Chapter 3: Memory and Hindsight Bias Chapter 4: Context Dependence Schedule of readings

Analysis of Variance (ANOVA)Constructing brief, complete summary statements By the end of lecture today 3/24/16

“SS” = “Sum of Squares ” “SS” = “Sum of Squares ” “SS” = “Sum of Squares ” “df” = degrees of freedom SampleStandard Deviation = s = SampleVariance = s 2 = Remember, you should know these two formulas by heart

Study Type 2: t-test Study Type 3: One-way Analysis of Variance (ANOVA)Comparing more than two means We are looking to compare two means

Single Independent Variable comparing more than two groupsStudy Type 3: One-way ANOVA Single Dependent Variable (numerical/continuous) Ian was interested in the effect of incentives for girl scouts on the number of cookies sold. He randomly assigned girl scouts into one of three groups. The three groups were given one of three incentives and looked to see whosold more cookies. The 3 incentives were 1) Trip to Hawaii, 2) New Bikeor 3) Nothing. This is an example of a true experiment Used to test the effect of the IV on the DV None New Bike Sales per Girl scout Trip Hawaii None New Bike TripHawaii Dependent variable is always quantitative In an ANOVA, independent variable is qualitative (& more than two groups) Sales per Girl scout Review

Be careful you are not designing a Chi Square One-way ANOVA versus Chi SquareNone New Bike Sales per Girl scout Trip Hawaii This is an ANOVA None New Bike Total Numberof Boxes Sold Trip Hawaii This is a Chi Square If this is just frequency you may have a problem These are means These are means These are means These are just frequencies These are just frequencies These are just frequencies

One-way ANOVAOne-way ANOVAs test only one independent variable - although there may be many levels“Factor” = one independent variable “Level” = levels of the independent variable treatment condition groups“Main Effect” of independent variable = difference between levels Note: doesn’t tell you which specific levels (means) differ from each other A multi-factor experiment would be a multi-independent variables experiment Number of cookies sold Incentives None BikeHawaii trip

Comparing ANOVAs with t-testsSimilarities still include:Using distributions to make decisions about common and rare events Using distributions to make inferences about whether to reject the null hypothesis or not The same 5 steps for testing an hypothesis The three primary differences between t-tests and ANOVAS are:1. ANOVAs can test more than two means2. We are comparing sample means indirectly by comparing sample variances3. We now will have two types of degrees of freedom t(16) = 3.0; p < 0.05 F(2, 15) = 3.0; p < 0.05 Tells us generally about number of participants / observations Tells us generally about number of participants / observations Tells us generally about number of groups / levels of IV

A girl scout troop leader wondered whether providing an incentive to whomever sold the most girl scout cookies would have an effect on the number cookies sold. She provided a big incentive to one troop (trip to Hawaii), a lesser incentive to a second troop (bicycle), and no incentive to a third group, and then looked to see who sold more cookies. n = 5 x = 10 n = 5 x = 12 n = 5 x = 14 Troop 1 (nada)10 812713 Troop 2(bicycle)121410 1113Troop 3 (Hawaii)1491913 15 What is Independent Variable?How many groups? What is Dependent Variable? How many levels of the Independent Variable?

Hypothesis testing: Step 1: Identify the research problemDescribe the null and alternative hypothesesIs there a significant difference in the number of cookie boxes sold between the girlscout troops that were given the different levels of incentive?

Hypothesis testing: Decision rule= .05 Critical F (2,12) =3.98 Degrees of freedom (between) = number of groups - 1Degrees of freedom (within) = # of scores - # of groups = 3 - 1 = 2= (15-3) = 12* *or = (5-1) + (5-1) + (5-1) = 12.

α= .05 Critical F(2,12)= 3.89 F (2,12) Appendix B.4 (pg.518)

ANOVA table ?df MS F ? ? ? SourceBetween Within Total? ?SS ? ? ? “SS” = “Sum of Squares”- will be given for exams- you can think of this as the numerator in a standard deviation formula 128 88 40

“SS” = “Sum of Squares ” “SS” = “Sum of Squares ” “SS” = “Sum of Squares ” “df” = degrees of freedom SampleStandard Deviation = s = SampleVariance = s2 = Remember, you should know these two formulas by heart

ANOVA table df MS F ? ? ?Source Between WithinTotal SS ? ? ? Writing Assignment - ANOVA1. Write formula for standard deviation of sample 2. Write formula for variance of sample 3. Re-write formula for variance of sample using the nicknames for the numerator and denominator 4. Complete this ANOVA table128 8840 SS df = MS

? ? ? ANOVA table 128 df MS F # groups - 1 # scores - number of groups # scores - 1 2 12 14 Source BetweenWithin Total88 40 SS ? ? ? ? ?? “SS” = “Sum of Squares” - will be given for exams 3-1=215-3=12 15- 1=14

ANOVA tableANOVA table 128 df MS F 2 12 14Source BetweenWithin Total 8840 SS MS between MS within SS within dfwithin 20 7.33 SS between df between 88 12 =7.33 40 2 =20 20 7.33 =2.73 2.73 40 2 88 12 ? ? ? “SS” = “Sum of Squares” - will be given for exams

Make decision whether or not to reject null hypothesis 2.73 is not farther out on the curve than 3.89 so, we do not reject the null hypothesisObserved F = 2.73 Critical F(2,12) = 3.89 Conclusion: There appears to be no effect of type of incentive on number of girl scout cookies soldF(2,12) = 2.73; n.s.The average number of cookies sold for three different incentives were compared. The mean number of cookie boxes sold for the“Hawaii” incentive was 14 , the mean number of cookies boxes sold for the “Bicycle” incentive was 12, and the mean number of cookies sold for the “No” incentive was 10. An ANOVA was conducted and there appears to be no significant difference in the number of cookies sold as a result of the different levels of incentive F(2, 12) = 2.73; n.s.

Main effect of incentive: Will offering an incentive result in more girl scout cookies being sold? If we have a “effect” of incentive then the means are significantly different from each other we reject the null we have a significant F p < 0.05 We don’t know which means are different from which …. just that they are not all the same To get an effect we want: Large “F” - big effect and small variability Small “p” - less than 0.05 (whatever our alpha is)

Let’s do same problemUsing MS Excel A girlscout troop leader wondered whether providing an incentive to whomever sold the most girlscout cookies would have an effect on the number cookies sold. She provided a big incentive to one troop (trip to Hawaii), a lesser incentive to a second troop (bicycle), and no incentive to a third group, and then looked to see who sold more cookies. Troop 1 (Nada) 108127 13Troop 2(bicycle)12 14101113 Troop 3(Hawaii)1491913 15n = 5 x = 10n = 5 x = 12n = 5 x = 14

Let’s do oneReplication of study (new data)

Let ’s do same problemUsing MS Excel

Let ’s do same problemUsing MS Excel

ANOVA table MS between MS within SS between df between 88 12 =7.33 40 2 =20 20 7.33 =2.73 “ Sum of Squares ” # groups - 1 # scores - # of groups # scores - 1 3-1=2 15-3=12 15- 1=14 SS within dfwithin

F critical (is observed F greater than critical F?) P-value (is it less than .05?) No, so it is not significantDo not reject null No, so it is not significantDo not reject null “Sum of Squares ”

Make decision whether or not to reject null hypothesis 2.7 is not farther out on the curve than 3.89 so, we do not reject the null hypothesisObserved F = 2.73 Critical F (2,12) = 3.89Also p-value is not smaller than 0.05 so we do not reject the null hypothesis Step 6: Conclusion: There appears to be no effect of type of incentive on number of girl scout cookies sold

Make decision whether or not to reject null hypothesis2.7 is not farther out on the curve than 3.89 so, we do not reject the null hypothesisObserved F = 2.72727272Critical F (2,12) = 3.88529 Conclusion: There appears to be no effect of type of incentive on number of girl scout cookies soldF(2,12) = 2.73; n.s.The average number of cookies sold for three different incentives were compared. The mean number of cookie boxes sold for the “Hawaii” incentive was 14 , the mean number of cookies boxes sold for the “Bicycle” incentive was 12, and the mean number of cookies sold for the “No” incentive was 10. An ANOVA was conducted and there appears to be no significant difference in the number of cookies sold as a result of the different levels of incentive F(2, 12) = 2.73; n.s.

Thank you! See you next time!!