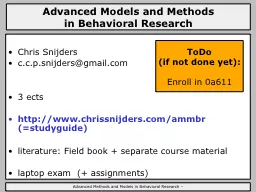
PSY505 Spring term 2012 February 22 2012 Todays Class MetaAnalysis MetaAnalysis What is it MetaAnalysis What is it usually used for MetaAnalysis What are the key challenges ID: 799468
Download The PPT/PDF document "Advanced Methods and Analysis for the Le..." is the property of its rightful owner. Permission is granted to download and print the materials on this web site for personal, non-commercial use only, and to display it on your personal computer provided you do not modify the materials and that you retain all copyright notices contained in the materials. By downloading content from our website, you accept the terms of this agreement.
Slide1
Advanced Methods and Analysis for the Learning and Social Sciences
PSY505
Spring term, 2012
February
22,
2012
Slide2Today’s Class
Meta-Analysis
Slide3Meta-Analysis
What is it?
Slide4Meta-Analysis
What is it usually used for?
Slide5Meta-Analysis
What are the key challenges?
Slide6Meta-Analysis
What are the key challenges?
Lack of detail in reports (p<0.05)
Inconsistent reports (r, p, d/
s
)
File-drawer problem
Construct-name mapping
Slide7Combining Significance
Stouffer’s Z
Z
sqrt
(K)
Slide8Combining Significance
Stouffer’s Z
sum(Z)
sqrt
(sum(
Var
(Z))
2
)
Var
(Z)=1 because it’s the normal distribution
Slide9What if you have p?
Slide10What if you have t?
Slide11What if you have r?
Slide12Asgn. 5
Problems 1-3
Slide13Weighting
When do R&R recommend weighting Z’s?
Is it a good idea?
Slide14Key assumption
Independence between studies
When might this assumption be violated?
If independence not met, there are other tests that can be used
See chapter
Slide15Combining Effect Size
Case of linear correlation r
Slide16Combining Effect Size
Convert r to Fisher z (not the same as Z!)
Using a table or function
Why?
As correlation approaches 1 or -1, the distribution of correlation becomes non-normal
The 95% confidence interval for a correlation of 0.9 might include 1.1, but correlation can’t be greater than 1
Fisher z adjusts this to make all distributions normal, making it possible to integrate across correlations
Slide17Combining Effect Size
Combine Fisher z
sum(z)
K
Slide18Combining Effect Size
Convert Fisher z back to r
Slide19Key assumption
Independence between studies
When might this assumption be violated?
If independence not met, there are other tests that can be used
See chapter
Slide20What about d/s
Convert it to r
Then conduct meta-analysis on r
Different equations for this conversion depending on properties of the data set
For more info, see p. 239 of
Cooper, H., Hedges, L.V. (1994)
The Handbook of Research Synthesis.
Slide21Cool thing
Same methods can be used to compare between significance values or correlations
Subtract values rather than summing them
Slide22Example
What is the significance of each study?
What is the significance of the two studies?
What is the difference between the studies?
Z=1.9
,
Z=2.2
Z=1.9, Z= -0.5
Slide23Evaluating detector goodness
Let’s do problem 4 together
Slide24Evaluating detector goodness
How do we get an A’ from this data?
(ignoring non-independence)
Slide25Evaluating detector goodness
How do we get SE(A’) from this data?
(ignoring non-independence)
Slide26Evaluating detector goodness
How do we compare A’ to chance?
(ignoring non-independence)
Slide27Evaluating detector goodness
Now, why was this the wrong thing to do?
(ignoring non-independence)
Slide28Evaluating detector goodness
Re-doing the procedure accounting for independence
Compute A’ for each student
Compute Z for each student
Use Stouffer’s Z to integrate across students
Slide29Evaluating detector goodness
When is this method inappropriate/useless?
Slide30Cleaning the Registers
At this point, every student should have handed in three assignments
If you haven’t, come talk to me after class
You now need to do 3 of Assignments 6-10
Slide31Asgn. 6
Slide32Next Class
Monday,
February
27
3pm-5pm
AK232
Regression and
Regressors
Readings
Ramsey
, F.L., Schafer, D.W. (1997)
The Statistical Sleuth: A Course in Methods of Data Analysis.
Sections 7.2-7.4, 9.2-9.3, 10.2-10.3
Witten, I.H., Frank, E. (2005)
Data Mining: Practical Machine Learning Tools and Techniques.
Sections 4.6, 6.5.
Assignments Due:
6. Regression
Slide33The End
Slide34Bonus Slides
If there’s time
Slide35BKT with Multiple Skills
Slide36Conjunctive Model(
Pardos
et al., 2008)
The probability a student can answer an item with skills A and B is
P(CORR|A^B) = P(CORR|A) * P(CORR|B)
But how should credit or blame be assigned to the various skills?
Slide37Koedinger et al.’s (2011)
Conjunctive Model
Equations for 2 skills
Slide38Koedinger et al.’s (2011)
Conjunctive Model
Generalized equations
Slide39Koedinger et al.’s (2011)
Conjunctive Model
Handles case where multiple skills apply to an item better than classical BKT
Slide40Other BKT Extensions?
Additional parameters?
Additional states?
Slide41Many others
Compensatory Multiple Skills (
Pardos
et al., 2008)
Clustered Skills
(Ritter et al., 2009)