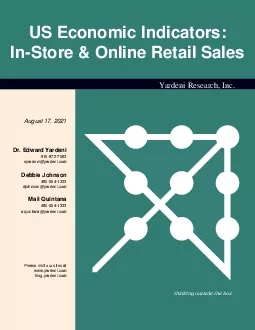
/
US Economic IndicatorsInStore  Online Retail Sales US Economic IndicatorsInStore  Online Retail Sales

US Economic IndicatorsInStore Online Retail Sales - PDF document

kimberly
kimberly . @kimberly
Follow
342 views
Uploaded On 2021-08-31

US Economic IndicatorsInStore Online Retail Sales - PPT Presentation

Dr Edward Yardeni5169727683eyardeniyardenicomDebbie Johnson4806641333djohnsonyardenicomMali Quintana4806641333aquintanayardenicomPlease visit our sites atwwwyardenicomblogyardenicomTable Of Cont ID: 874091

yardeni sales store online sales yardeni online store gafo stores general figure merchandise retail research retailers includes accessories houses

Share:

Link:

Embed:

Download Presentation from below link

Download Pdf The PPT/PDF document "US Economic IndicatorsInStore Online Re..." is the property of its rightful owner. Permission is granted to download and print the materials on this web site for personal, non-commercial use only, and to display it on your personal computer provided you do not modify the materials and that you retain all copyright notices contained in the materials. By downloading content from our website, you accept the terms of this agreement.


Presentation Transcript

1 US Economic Indicators:In-Store & Online
US Economic Indicators:In-Store & Online Retail Sales Dr. Edward Yardeni516-972-7683eyardeni@yardeni.comDebbie Johnson480-664-1333djohnson@yardeni.comMali Quintana480-664-1333aquintana@yardeni.comPlease visit our sites atwww.yardeni.comblog.yardeni.com Table Of Contents In-Store & Online Retail Sales1-6Miscellaneous7 929394959697989900010203040506070809101112131415161718192021222324 0200 02001000 (billion dollars, saar)In-Store* Plus Online Sales Online Sales (950.8) Warehouse Clubs & Super-Stores (581.1) Department Stores (144.8) *GAFO (general merchandise, appar

2 el and accessories, furniture, and other
el and accessories, furniture, and other sales) includes retailers that specialize in departme Figure 1. 929394959697989900010203040506070809101112131415161718192021222324 010 010 (as a percent of in-store* and online sales)In-Store* Plus Online Sales Online Sales (38.3) Warehouse Clubs & Super-Stores (23.4) Department Stores (5.9) *GAFO (general merchandise, apparel and accessories, furniture, and other sales) includes retailers that specialize in departme Figure 2.August 17, 2021 / In-Store & Online Retail Sales www.yardeni.comYardeni Research, Inc. 92939495969

3 7989900010203040506070809101112131415161
7989900010203040506070809101112131415161718192021222324 01 0 (trillion dollars, saar) In-Store GAFO* + Online** (2.5) *GAFO (general merchandise, apparel and accessories, furniture, and other sales) includes retailers that specialize in departme**Electronic shopping and mail order houses. Figure 3. 92939495969798990001020304050607080910111213141516171819202122 010 010 (as a percent of In Store GAFO* + Online**) *GAFO (general merchandise, apparel and accessories, furniture, and other sales) includes retailers that specialize in departme**Electronic shopping and ma

4 il order houses. Figure 4.August 17, 202
il order houses. Figure 4.August 17, 2021 / In-Store & Online Retail Sales www.yardeni.comYardeni Research, Inc. 92939495969798990001020304050607080910111213141516171819202122 0200 02001000 (billion dollars, saar)Retailers General Merchandise Stores* *Department stores, warehouse clubs, and supercenters.**Electronic shopping and mail order houses. Figure 5. 929394959697989900010203040506070809101112131415161718192021222324 010 010 (as a percent of In-Store GAFO* + Online)Retailers General Merchandise Stores** *GAFO (general merchandise, apparel and accessories, f

5 urniture, and other sales) includes reta
urniture, and other sales) includes retailers that specialize in departme**Department stores, warehouse clubs, and supercenters.***Electronic shopping and mail order houses. Figure 6.August 17, 2021 / In-Store & Online Retail Sales www.yardeni.comYardeni Research, Inc. 929394959697989900010203040506070809101112131415161718192021222324 0200 02001000 (billion dollars saar)General Merchandise Stores (GMS)* GMS: Total GMS: Warehouse Clubs & Super-Stores *General Merchandise Stores includes Warehouse Clubs & Super-Stores. Figure 7. 929394959697989900010203040506070809

6 101112131415161718192021222324 01020 010
101112131415161718192021222324 01020 01020 (as percent of total In-Store + Online GAFO*)Percent of Total GAFO* Online** (38.3) GMS: Warehouse Clubs & Super Stores (23.4) *GAFO (general merchandise, apparel and accessories, furniture, and other sales) includes retailers that specialize in departme**Electronic shopping and mail order houses. Figure 8.August 17, 2021 / In-Store & Online Retail Sales www.yardeni.comYardeni Research, Inc. 9394959697989900010203040506070809101112131415161718192021222324 -500 -50050100 (yearly percent change) In-Store GAFO* (20.5) *GAFO

7 (general merchandise, apparel and acces
(general merchandise, apparel and accessories, furniture, and other sales) includes retailers that specialize in departme**Electronic shopping and mail order houses. Figure 9. 929394959697989900010203040506070809101112131415161718192021222324 46 410 (thousand dollars, saar) In-Store* (12.1) *GAFO (general merchandise, apparel and accessories, furniture, and other sales) includes retailers that specialize in departme**Electronic shopping and mail order houses. Figure 10.August 17, 2021 / In-Store & Online Retail Sales www.yardeni.comYardeni Research, Inc. 929394

8 9596979899000102030405060708091011121314
959697989900010203040506070809101112131415161718192021222324 02000 02000 *Electronic shopping and mail order houses. Figure 11. 9394959697989900010203040506070809101112131415161718192021222324 -500 -50050100 Online** *GAFO (general merchandise, apparel and accessories, furniture, and other sales) includes retailers that specialize in departme**Electronic shopping and mail order houses. Figure 12.August 17, 2021 / In-Store & Online Retail Sales www.yardeni.comYardeni Research, Inc. 200520062007200820092010201120122013201420152016201720182019202020212022 2.53.03.5

9 2.53.03.5 (trillion dollars, saar) Retai
2.53.03.5 (trillion dollars, saar) Retail Sales Retail Sales excludingBuilding Materials & PCE: GoodsSource: Bureau of Economic Analysis and Census Bureau.yardeni.com Figure 13.August 17, 2021 / In-Store & Online Retail Sales www.yardeni.comYardeni Research, Inc. http://blog.yardeni.comhttp://blog.yardeni.comrequests@yardeni.comCopyright (c) Yardeni Research, Inc. 2021. All rights reserved. The informationcontained herein has been obtained from sources believed to be reliable, but is not, blog.yardeni.com, and YRI’s Apps are issuedwithout regard to the specific i

10 nvestment objectives, financial situatio
nvestment objectives, financial situation, or particular needsThe text, images, and other materials contained or displayed on any Yardeni Research, Inc.product, service, report, email or website are proprietary to Yardeni Research, Inc. andwww.yardeni.com, blog.yardeni.com, and YRI’s Apps may be downloaded, transmitted,broadcast, transferred, assigned, reproduced or in any other way used or otherwiseThe recipient should check any email and any attachments for the presence of viruses.Yardeni Research, Inc. accepts no liability for any damage caused by any virus tra