/
Common Bird Monitoring Program -2014 Common Bird Monitoring Program -2014

Common Bird Monitoring Program -2014 - PowerPoint Presentation

kittie-lecroy
kittie-lecroy . @kittie-lecroy
Follow
343 views
Uploaded On 2019-11-25

Common Bird Monitoring Program -2014 - PPT Presentation

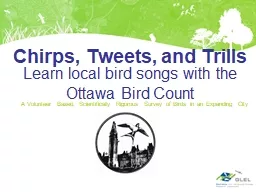
Common Bird Monitoring Program 2014 Results Find answers to these questions What are our common birds Are they doing well What habitats are good and what habitats are bad Are their numbers changing across years ID: 767998

species lists amp survey lists species survey amp cells

Share:

Link:

Embed:

Download Presentation from below link

Download Presentation The PPT/PDF document "Common Bird Monitoring Program -2014" is the property of its rightful owner. Permission is granted to download and print the materials on this web site for personal, non-commercial use only, and to display it on your personal computer provided you do not modify the materials and that you retain all copyright notices contained in the materials. By downloading content from our website, you accept the terms of this agreement.


Presentation Transcript

Common Bird Monitoring Program -2014 Results

Find answers to these questions What are our common birds ? Are they doing well? What habitats are good and what habitats are bad ? Are their numbers changing across years ?Why are their numbers changing ? Are there relationship between two species ?Positive (Koel & Crows) or Negative (Babblers) ?Need special attention to any species / groups ?Involve public. Impact education through CBMP Introduction to CBMP

Kerala Forest Department – Social Forestry Green Partners Program Use Great Backyard Bird Count (GBBC) Dates Pan Kerala - Involve all Green Partners (GP) Limited to non-forest areasIdentify Regional Coordinators amongst GPInvite new birders to participate via trainingAutomated submissions from Kerala towards Big Bird Day (BBD) & GBBCStrategy 14-17Feb

Publish Methodology to all GP Media Publicity Electronic & Newspapers Center Page in Vidhya of MathrubhoomiPrepare Centralised Training Material oneBird IntroductionBird IdentificationWorkshops in all district HQsMobilise regular bird-watchers Pre-Survey Planning

Create eBird Account Watch birds around ur home/workplaceList species seen and their numbers Each list strictly 15 minute durationSubmit in eBird by selecting the locationMark the species seen & their numbersSubmit at least 3 lists in 4 days.Survey Methodology

Sorted lists based on districts Assigned lists to district reviewers Reviewers identified data quality issues Location Imprecise, Likely Misidentification, Wrong Protocol, Unlikely number etc.Reviewers mailed/called the observer for clarification / correction Analysed data at state level & cell levelCell size is 15’ x 15’ (15’ = 0.25 degrees ~ 27km)Post-Survey Analysis

Results Overview

District Wise List Distribution

List Density No of Lists No of Cells

Species Density

Species Density – House Crow

Species Comparison: Bulbuls Red-vented Red-whiskered

Species Comparison : Babblers Yellow-billed Jungle

Species Comparison: Koel & Crows

Participants No of Accepted Lists Participants No of Accepted Lists Premchand Reghuvaran40salim ei 13 VINOD KUMAR P.K. 25 NANDANA V KUMAR12 hari kumar 20 Sivakumar AK 12 MSSRF Bioview 17 Jafer Palot 11 chithrabhanu pakaravoor 16 Jyothi Krishnan 11 Jacob Thomas 15 vijesh vallikunnu 11 jayaprakash m t 15 Devika V S 10 Sreekumar E R 15 Soni Nambiar 10 Top Participants

Backup Slides for Discussion

District No of Accepted L ists Non-compliant ListsNo. of speciesAlappuzha53 46 134 Ernakulam 11043 158 Idukki 13 17 158 Kannur 105 25 112 Kasargod 13 9 57 Kollam 4 27 67 Kottayam 9 17 94 Kozhikode 66 33 116 Malappuram 40 16 119 Palakkad 21 22 127 Pathanamthitta 24 78 75 Thiruvananthapuram 42 58 97 Thrissur 127 50 143 Wayanad 29 14 110 District-wise Participation

Protocol No of Lists eBird - Casual Observation 31eBird - Exhaustive Area Count68eBird - Stationary Count679eBird - Traveling Count347 eBird Random Location Count 6 Methodology/Protocol

65% No of Species No of Lists

No of species vs No of lists in a cell

Salim Ali Birth Anniversary Kerala Bird Race – Sunday near 12 th NovemberInduchoodan AnusmaranamJune 14 thWildlife Week CelebrationsOctober 2nd – 8th VacationsOnam (Aug / Sep)Christmas (Dec last week)Summer (April – May)Birding Events

Total Area: 38, 863 sq.km Non-Forest Area: 27, 554 sq.km Grid 15’ x 15’ 35 cells, 700 lists Grid 10’ x 10’ 80 cells, 1600 listsGrid 5’ x 5’ 322 cells, 6440 listsGrid 2.5’ x 2.5’ 1300 cells, 26000 lists Grid 1.5’ x 1.5’ 3580 cells, 71600 lists# Lists in CBMP 1122<F, S, S, M ><03, 03,16, 03 > => 25 lists [750 lists from 30 people]Some Statistics60’=1º~111km20 lists / cell

Start Survey @ 6:00 AM from your home Use a vehicle – motorbike or car or bicycle Survey for 15 minutes, Travel for 15minutes Repeat it over a round tripStop Survey @ 10:30 AM at your homeYou generate 9 lists in 4.5 hrs Repeat Survey between 3:00 PM – 6:30 PMSame route or different route.You generate 7 lists in 3.5hrs 16 lists in one dayA Sample One-day Survey

Sample Survey: Forenoon Route 9 lists in 4.5hrs

Sample Survey: Postnoon Route 7 lists in 3.5hrs

Submissions