/
Global climate trend since Nov. 16, 1978: +0.11 C per decade   May tem Global climate trend since Nov. 16, 1978: +0.11 C per decade   May tem

Global climate trend since Nov. 16, 1978: +0.11 C per decade May tem - PDF document

kittie-lecroy
kittie-lecroy . @kittie-lecroy
Follow
389 views
Uploaded On 2016-08-23

Global climate trend since Nov. 16, 1978: +0.11 C per decade May tem - PPT Presentation

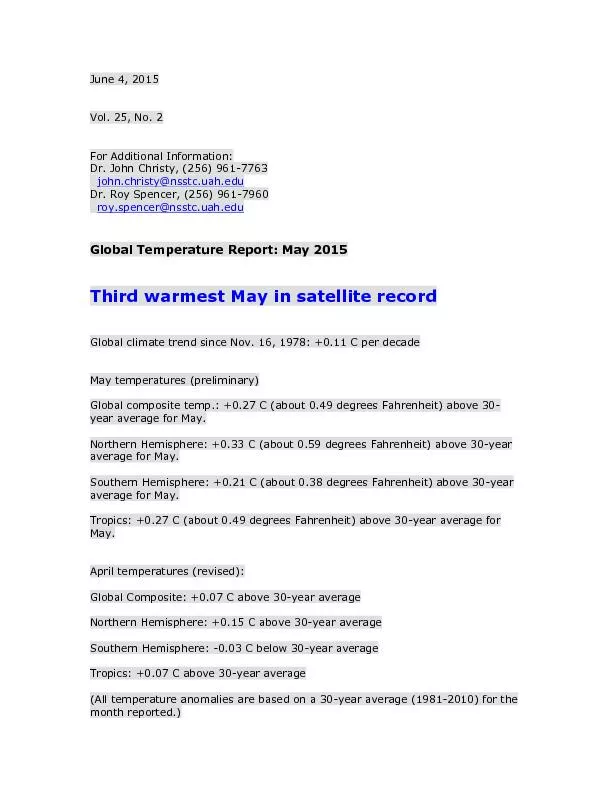
May 2015 had the third highest global average May temperature in the 38year global satellite temperature record said Dr John Christy director of the Earth System Science Center at The University o ID: 454857

May 2015 had the third

Share:

Link:

Embed:

Download Presentation from below link

Download Pdf The PPT/PDF document "Global climate trend since Nov. 16, 1978..." is the property of its rightful owner. Permission is granted to download and print the materials on this web site for personal, non-commercial use only, and to display it on your personal computer provided you do not modify the materials and that you retain all copyright notices contained in the materials. By downloading content from our website, you accept the terms of this agreement.


Presentation Transcript

Global climate trend since Nov. 16, 1978: +0.11 C per decade May temperatures (preliminary) Global composite temp.: +0.27 C (about 0.49 degrees Fahrenheit) above 30-year average for May. Northern Hemisphere: +0.33 C (about 0.59 degrees Fahrenheit) above 30-year average for May. Southern Hemisphere: +0.21 C (about 0.38 degrees Fahrenheit) above 30-year average for May. Tropics: +0.27 C (about 0.49 degrees Fahrenheit) above 30-year average for May 2015 had the third highest global average May temperature in the 38-year global satellite temperature record, said Dr. John Christy, director of the Earth System Science Center at The University of Alabama in Huntsville. Temperatures across the globe warmed in May, with the third warmest May in the northern hemisphere, fourth warmest in the tropics, and seventh warmest May in the southern hemisphere. Global average anomalies: May 1998 +0.64 C 2010 +0.44 C 2015 +0.27 C 2002 +0.26 C 2014 +0.25 C Compared to seasonal norms, the warmest average temperature anomaly on Earth in May was on the southwestern edge of the Kara Sea, north of central Russia near the town of Amderma. The May temperature there averaged 4.77 C (about 8.59 degrees F) warmer than seasonal norms. Compared to seasonal norms, the coolest average temperature on Earth in May was in East Antarctica near Davis Station, where the average May 2015 temperature was 3.31 C (about 5.96 degrees F) cooler than normal. The complete version 6 beta lower troposphere dataset is available here: http://vortex.nsstc.uah.edu/data/msu/v6.0beta/tlt/uahncdc_lt_6.0beta2 Archived color maps of local temperature anomalies are available on-line at: http://nsstc.uah.edu/climate/ As part of an ongoing joint project between UAHuntsville, NOAA and NASA, Christy and Dr. Roy Spencer, an ESSC principal scientist, use data gathered by advanced microwave sounding units on NOAA and NASA satellites to get accurate temperature readings for almost all regions of the Earth. This includes remote desert, ocean and rain forest areas where reliable climate data are not otherwise available. The satellite-based instruments measure the temperature of the atmosphere