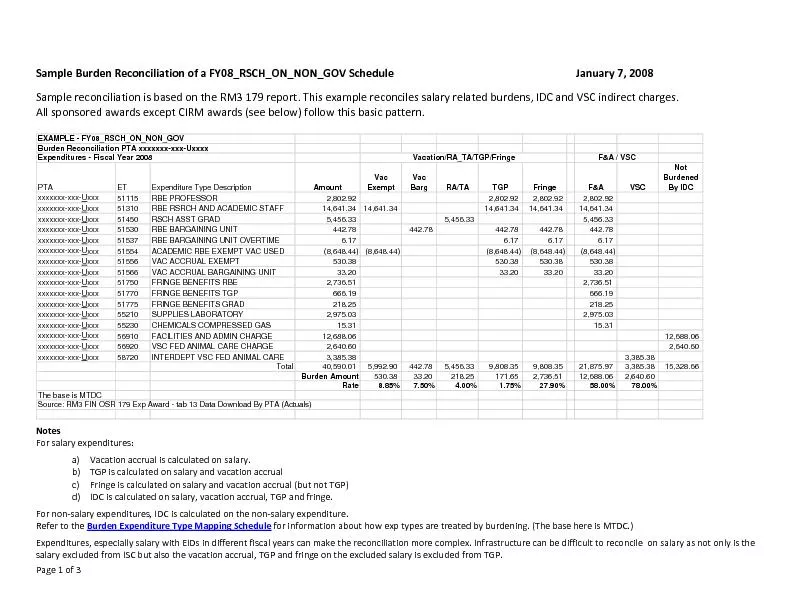
/
Performance Anomaly of 802.11b Performance Anomaly of 802.11b

Performance Anomaly of 802.11b - PowerPoint Presentation

kittie-lecroy
kittie-lecroy . @kittie-lecroy
Follow
409 views
Uploaded On 2016-05-07

Performance Anomaly of 802.11b - PPT Presentation

Presentation By Daniel Mitchell Brian Shaw Steven Shidlovsky Paper By Martin Heusse Franck Rousseau Gilles Berger Sabbatel Andrzej Duda 1 CS4516 C10 February 11 2010 ID: 309035

c10 hosts tcp cs4516 hosts c10 cs4516 tcp rate host bit slow transmission data time access transmit throughput bali anomaly conditions 802

Share:

Link:

Embed:

Download Presentation from below link

Download Presentation The PPT/PDF document "Performance Anomaly of 802.11b" is the property of its rightful owner. Permission is granted to download and print the materials on this web site for personal, non-commercial use only, and to display it on your personal computer provided you do not modify the materials and that you retain all copyright notices contained in the materials. By downloading content from our website, you accept the terms of this agreement.


Presentation Transcript

Slide1

Performance Anomaly of 802.11b

Presentation By: Daniel Mitchell, Brian Shaw, Steven Shidlovsky

Paper By: Martin Heusse, Franck Rousseau, Gilles Berger-Sabbatel, Andrzej Duda

1

CS4516 C10

February 11, 2010 Slide2

Outline

802.11b BasicsThe AnomalySimulation VerificationExperimental Verification

CS4516 C102Slide3

Abstract

When one host on a IEEE 802.11b network is forced to transmit at less than the maximum bit rate of 11 Mbps then all other hosts are forced to also transmit at this lower rate

3CS4516 C10Slide4

Behind the Problem

Access method – Distributed Coordination Function (DCF)Uses CSMA/CA Low quality radio transmissions will result in a decrease in bit rate 5.5, 2, or 1 MbpsPerformance anomaly caused

Privileges low speed hosts, penalize high speed hosts4CS4516 C10Slide5

DFC Performance

Overall transmission timeT = ttr + t

ovEach packet has constant overhead timetov = DIFS + tpr + SIFS + tpr

+ tackDIFS = Time wait between senses of channel

SIFS = Period access point waits to send ACKtpr

= PLPC Transmission time

t

ack

= MAC acknowledgement transmission time

5

CS4516 C10Slide6

Throughput Efficiency

Equation to determine useful throughputP = (Ttr/T) * (1500/1534)

Result: 70% useful throughputThus 11 Mbps has 7.74 Mbps useful data6CS4516 C10Slide7

Multiple Hosts

Increases overall transmission timeDecreases the proportion of useful throughputP(N) = t

tr/T(N)T(N) = Overall transmission time due to multiple hosts7CS4516 C10Slide8

The Anomaly

Since the slow hosts need more time to transmit the same data, all the hosts slow down to roughly the same speedThe slow host holds the channel for a proportionately longer amount of time!This anomaly occurs regardless of how many fast hosts are presentCollisions and contention affect all hosts proportionally

8CS4516 C10Slide9

Why the Anomaly Exists

sd: Amount of data to be transmittedTime to transmit data = sd/(data rate)

Over the long term, CSMA/CA provides each host with an equal probability of accessing the channelTherefore, all hosts will have the opportunity to transmit the same amount of dataFast hosts have a lower channel utilization9

CS4516 C10Slide10

Further Discussions

See Heuse, et. al. page 3 for the full mathematics.

Contention periods and collisions are accounted for.UDP is expected to obey the mathematical models as generally no ACK packets are sent.TCP behaves as though there is 2 slow hosts, but can be shown mathematically to behave similarly. The second slow host is the ACK packets returning to it.TCP also incorporates congestion control, so a host may stop transmitting when its data rate is substantially below the 1Mbps minimum.

10

CS4516 C10Slide11

Verification

A simulation was conducted to verify the mathematical results.Simulator is targeting a worst-case scenario: The channel is always busy the first time a node wants to transmit.All nodes configured to use 802.11b with exponential backoff

Simulation showed the mathematics are good, though not perfectThe error: Other factors, besides the proportion of collisions, affect the average time spent in collisions11CS4516 C10Slide12

Proportion of Collisions

The mathematics assume a greater number of collisions than the simulation shows, particularly for very large numbers of hosts

12CS4516 C10

Figure 3Slide13

Throughput

The performance anomaly is observed. Note that no configuration gets acceptable throughput for very large numbers of hosts. This triggers TCP congestion control algorithms and may force hosts to stop transmitting.

13CS4516 C10

Figure 4Slide14

Experimental Verification

Measure ThroughputFour notebooks(Marie, Milos, Kea, Bali)

RedHat 7.3, 802.11b cardsAccess Point is not the bottleneck14CS4516 C10Slide15

Tool Used

Netperf:: generates TCP or UDP traffic and measures throughputTcpperf::

generates TCP traffic and measures the throughputUdpperf:: generates UDP traffic and measures the throughputMeasurements done with netperf, compared to results of tcpperf and udpperf

15

CS4516 C10Slide16

Test 1: No Mobility

All hosts near access pointForce one to use degraded bit rateOne test run with TCP, the other with UDPUsing 2 hosts, 3 hosts, and 4 hosts, at bit rates 11, 5.5, 2, and 1 for Bali (slow host)

For TCP, hosts are competing with the access point, which is sending TCP ACKs on behalf of the destinationFor UDP, hosts compete with each other16CS4516 C10Slide17

17

CS4516 C10Slide18

Test 1: Discussion

Measured values correspond well to analytical values (better for UDP)TCP traffic pattern more complex, due to Access Point competing with hosts (TCP ACKs), dependence on overall RTT and bottleneck link

Pattern can become correlated with data segment traffic, since TCP ACK is sent upon arrival of data segment18CS4516 C10Slide19

Test 2: Mobile Hosts

Bali (slow host) is a mobile host, bit rate automatically adapts to varying transmission conditionsOther hosts located near access point with good conditions

19CS4516 C10Slide20

20

CS4516 C10Slide21

Test 2: Discussion

For TCP, when transmission conditions are bad (300-380) the throughput of Marie increases. This is due to Bali limiting its sending rate in adverse conditions Note, at 380, Bali stops sending completely even if its bit rate is not 0, and Marie gains almost all available throughput

UDP shows similar results, although Marie’s gains during adverse conditions are not quite as large, unless Bali stops sending21CS4516 C10Slide22

Related Work

There have been many other papers studying 802.11 WLANs, but no prior papers use varying bit rates for hostsMost other papers use simulations, rather than analysis, which can give complex resultsShort-term unfairness of CSMA-based medium access protocols is also a topic of interest

22CS4516 C10Slide23

Conclusions

Throughput much lower than nominal bit rateProportion of useful throughput depends strongly on number of hostsIf a host degrades its bit rate due to bad transmission conditions, other hosts throughputs will drop roughly to the rate of the slower host

However, in real conditions using TCP, the slow host will be subject to packet loss, limiting its sending rate, allowing other hosts to take advantage of the unused capacity23CS4516 C10