/
Proc. Int. Sym. Growing Media and HydroponicsEd. A.P. PapadopoulosPORE Proc. Int. Sym. Growing Media and HydroponicsEd. A.P. PapadopoulosPORE

Proc. Int. Sym. Growing Media and HydroponicsEd. A.P. PapadopoulosPORE - PDF document

kittie-lecroy
kittie-lecroy . @kittie-lecroy
Follow
390 views
Uploaded On 2015-09-27

Proc. Int. Sym. Growing Media and HydroponicsEd. A.P. PapadopoulosPORE - PPT Presentation

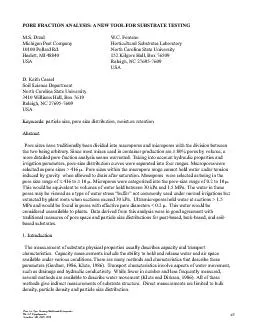
Keywords particle size pore size distribution moisture retention the two being arbitrary Since most mixes used in container production are more detailed porefraction analysis seems warranted Ta ID: 142755

Keywords: particle size pore size

Share:

Link:

Embed:

Download Presentation from below link

Download Pdf The PPT/PDF document "Proc. Int. Sym. Growing Media and Hydrop..." is the property of its rightful owner. Permission is granted to download and print the materials on this web site for personal, non-commercial use only, and to display it on your personal computer provided you do not modify the materials and that you retain all copyright notices contained in the materials. By downloading content from our website, you accept the terms of this agreement.


Presentation Transcript

Proc. Int. Sym. Growing Media and HydroponicsEd. A.P. PapadopoulosPORE FRACTION ANALYSIS: A NEW TOOL FOR SUBSTRATE TESTINGM.S. DrzalW.C. FontenoMichigan Peat CompanyHorticultural Substrates Laboratory10100 Pollard Rd.North Carolina State UniversityHaslett, MI 48840152 Kilgore Hall, Box 76509USARaleigh, NC 27695-76093410 Williams Hall, Box 7619 Keywords: particle size, pore size distribution, moisture retention the two being arbitrary. Since most mixes used in container production are more detailed pore-fraction analysis seems warranted. Taking into account hydraulic properties andThis would be equivalent to volumes of water held between 30 kPa and 1.5 MPa. The water in thesepores may be viewed as a type of water stress ÒbufferÓ not commonly used under normal irrigations butMPa and would be found in pores with effective pore diameters . This water would be available under various conditions. There are many methods and characteristics that describe theseparameters (Gardner, 1986, Klute, 1986). Transport characteristics involve aspects of water movement,such as drainage and hydraulic conductivity. While fewer in number and less frequently measured,several methods are available to describe water movement (Klute and Dirksen, 1986). All of thesedensity, particle density and particle size distribution. Proc. Int. Sym. Growing Media and HydroponicsEd. A.P. Papadopoulosstructure significantly (Milks, et al., 1989c). Therefore, structure does not Òcome in the bag,Ó but ratherHowever, most substrates that do not contain mineral soil have solid fractions between 10 and 20percent (by volume). These two parameters do not describe the 80 to 90 percent of the substratevolume which contains pores. A technique is necessary to accurately and adequately describe thetransfer of water between macropores and smaller pores is limited. While useful, these designations aresomewhat arbitrary (Puustjarvi, 1974), because a macropore large enough to drain when in the toprequire an expanded separation of pore size ranges for container substrates. Taking into accountranges as discussed below. The three substrates used were selected to cover the range of mixes used in container production. Ahorticultural grade vermiculite no. 2 (by volume). A bark-based substrate (bark mix) was formulatedvolume). A soil-based substrate (soil mix) was prepared with 1 sandy loam (75% sand: 15% silt 10% Proc. Int. Sym. Growing Media and HydroponicsEd. A.P. Papadopoulosand shaken on a Rotap Shaker (Tyler Industrial Products, Combustion Engineering Inc., Menton, Ohio)Seven samples of each substrate were packed in aluminum cylinders (7.6 cm diameter, 7.6 cm height)Volumetric water content (for each substrate using a nonlinear, five-parameter function developed by van Genuchten and Nielsen(1985) and adapted to horticultural substrates by Milks et al. (1989a). The nonlinear model is definedThe nonlinear model is defined(ah)n]m[1]where Qs is the volumetric water content at saturation (0 kPa), Qr is the residual volumetric watercontent at 30 kPa of water tension, and a, n, and m are curve-fitting parameters estimated throughiteration.The equilibrium capacity variable (ECV) model described by Bilderback and Fonteno (1987) andrefined by Milks et al. (1989b) combined the nonlinear moisture retention function [1] with containergeometry. These models were used to provide accurate predictions of container capacity (CC), airspace (AS), and available water (AW) for 11 cm height substrate in a 12.5 cm height azalea pot. Totalcurve data. The effective diameter of the largest water-filled pore at each tension was calculated by gh[2]) of water,2.4Average effective suction determination average ef fective suction at container capacity (AES Proc. Int. Sym. Growing Media and HydroponicsEd. A.P. Papadopoulosfor an 11 cm column of substrate would be equivalent to the midpoint (0.55 kPa) in thatcolumn (Figure 1a). However, since the container was actually an inverted, truncated cone, AEStall azalea containers filled with 11 cm of substrate used in the irrigation study (Figure 1b). CC was cm of substrate used in the irrigation study (Figure 1b). CC was()Qcc was calculated. The AES was then converted to an effective, largest water-filled-filled2.5. Pore fractionsIn this study, macropores� were selected as pore sizes 416 m. Pore sizes within the macropore rangecannot hold water under tension induced by gravity when allowed to drain after saturation. This is Mesopores (from Luxmoore, 1981) werecontainer suctions during commercial plant production do not normally exceed 30 kPa (effective pore Micropores were categorized into the pore-size range of 0.2 to 10 m. This would be equivalent toallowed to dry between 30 kPa and 1.5 MPa, the micropores would drain. These pores could beW�ater held at suctions 1.5 MPa would be found in pores with effective pore diameters However, water held in this range would include that absorbed into very small interaggregate and1982; Handreck and Black, 1984).This water would be considered unavailable to plants. The range ofeffective pore diameters ()The ultramicropore fraction would be equivalent to the unavailable water (UW) volumes in Table 1. Large differences existed in the moisture retention curves (Figure 2). The peat mix had the greatestbark mix (172 ml) respectively. Moisture retention curves for the bark and soil mixes have lower waterregulating variable (Johnson et al., 1981; Karlovich, 1986; Lieth and Burger, 1989; Spomer andLanghans, 1975). Less water was available for plant growth (Table 1) in the bark and soil mixes.3.2. Water and Air Capacity Characterization.listed in Table 1. The peat and bark mixes had the greatest total porosity (TP), followed by the soil mix.Container capacity (CC) and available water (AW) were greatest in the peat mix, followed by the soiland bark mixes, respectively. The unavailable water (UW) for the peat and bark mixes were similar but Proc. Int. Sym. Growing Media and HydroponicsEd. A.P. Papadopouloswere much greater than in the soil mix. Air space (AS) in the soil mix was less than both the peat andTable 2 contains the particle-size distributions for the three substrates. These show the peat mix asconsisting mainly of medium sized particles (between 0.5 and 2.0 mm) which retain large amounts ofwater (Bunt, 1988) and contributed to the large values of total porosity (TP), container capacity (CC),air space (AS), and available water (AW) (Table 1). This combination of particle sizes and low bulkdensity (BD) created a substrate with a high water holding capacity (Table 1).the soil mix (Table 2). The smaller particles apparently nested into the larger pore spaces reducing TP,CC, and AS (Table 1). This nesting has been suggested by many researchers (Beardsell, 1979;Bilderback et al., 1982; Erwiyono et al., 1990; and Wallach et al., 1992a ).The soil mix had the most uniform particle-size distribution (Table 2). The percentage of coarsermix, but with higher bulk density.3.4. Pore Fraction Analysis. Macropores. The peat mix contained the largest fraction of pores (11%) in this range (Fig 3). Thewith the soil mix having the lowest macropore percentage (3%). This indicated that the peat mix hadthe greatest air space after drainage, followed by bark and soil mixes, respectively. This agreed with theair space data in Table 1. Mesopores. The largest portions of pore space for the soil (37%), bark (36%), and peat mixes (47%)were in this mesopore range (Fig 3). Water storage capabilities may be most influenced by themesopore range. This middle range of pores shifts from being water-filled at CC to containing more air Micropores. The peat and soil mixes had 9% and 6% of their total volumes occupied by micropores,respectively (Fig 3). The percentage of water remaining in the bark mix in the micropores was kPa (Figure 2). Wilting and tissue death may occur more rapidly under moisture stress in the bark mix.Water-filled micropores may provide some protection against plant moisture stress under conditions ofextreme suctions in substrates during crop production. The water in these pores may be viewed as atype of water stress ÒbufferÓ not used under normal irrigations but extracted by plant roots when Ultramicropores. Since these values were derived from the water held at tensions were the same as the values for unavailable water (Table 1).First, the soil-based substrate had a large volume of solids compared to the soilless substrates. Second,to the plant. Third, the volume of each substrate available for holding and disseminating water forcapacity. These observations are consistent with those drawn using water retention and particle size Proc. Int. Sym. Growing Media and HydroponicsEd. A.P. Papadopoulos can vary. For example, AES will change with the height of the substrate and container geometry.Therefore, as AES increases, the percentage of macropores increases. The mesopore fraction alsochanges with AESbegan at 30 kPa. Also, other methods for determining total porosity, container capacity, moistureBased on the results of this study, micropore percentages appear to be dependent on substrateproperties, irrigation parameters, and container geometry.As irrigation systems become more sophisticated, substrates need to become more efficient at Beardsell, D. V., D. G. Nichols, and D. L. Jones. 1979. Physical Properties of Nursery Potting-mixtures. Scientia Hort. 11:1-8.Bilderback, T. E., W. C. Fonteno, and D. R. Johnson. 1982. Physical Properties of Media Composed ofPeanut Hulls, Pine Bark, and Peat moss and their Effects on Azalea Growth. J. Amer. Soc. Hort.Bilderback, T. E. and W. C. Fonteno. 1987. Effects of container geometry and media physicalproperties on air and water volumes in containers. J. Environ. Hort. 5(4):180-182.Macroporosity of SoilÓ. Soil Sci. Soc. Am. J., 45:671- 672.Bunt, A. C. 1988. Media and Mixes for Container-grown Plants. Unwin Hyman Ltd. London. pp.44-Cassel, D. K. and D. R. Nielsen. 1986. Field capacity and available water holding capacity: In A. Klute(ed). Methods of soil analysis, Part 1. Rev. Physical and Mineralogical Methods. Amer. Soc. ofAgron. Monogr. 9. pp.901-929.Childs, E. C. 1940. The use of soil moisture characteristics in soil studies. Soil Science. 50:239-252.Danielson, R. E. and P. L. Sutherland. 1986. Porosity: In A. Klute (ed). Methods of soil analysis, Part1. Rev. Physical and Mineralogical Methods. Amer. Soc. of Agron.Monogr. 9. pp.443-460Erwiyono, R. and D. H. Goenadi. 1990. The potential use of coconut husk material aspotting media:Fonteno, W. C. 1996. Growing media: types and physical/chemical properties. In: Reed, D.W. (ed.).Water, Media and Nutrition for Greenhouse Crops. Ball Publishing.Fonteno, W.C. and T. E. Bilderback. 1993. Impact of Hydrogel on physical propertiesof coarse-structured horticultural substrates. J. Amer. Soc. Hort. Sci. 118(2):217-222. Proc. Int. Sym. Growing Media and HydroponicsEd. A.P. PapadopoulosFonteno, W. C. and P. V. Nelson. 1990. Physical properties of and plant response torockwool-amended media. J. Amer. Soc. Hort. Sci. 115(3):375-381.Gardner, W. H. 1986. Water Content: In A. Klute (ed). Methods of soil analysis, Part 1. Rev. Physicaland Mineralogical Methods. Amer. Soc. of Agron. Monogr. 9. pp.443-460.Handreck, K. A. and N. D. Black. 1984. Growing media for ornamental plants and turf. New SouthWales Univ. Press. Kensington, Australia. pp.115-117.Hillel, D. 1982. Introduction to Soil Physics. Academic Press, Inc. San Diego.Johnson, C. R. D. L. Ingram, and J. E. Barrett. 1981. Effects of irrigation frequency on growth, L. HortScience, Vol.16(1):80-81.Karlovich, P. T. and W. C. Fonteno. 1986. The effect of soil moisture on the growth ofchrysanthemum in three container media. J. Amer. Soc. Hort. Sci. 111(2):191-195.Klute, A. 1986. Water Retention: Laboratory Methods. In A. Klute (ed). Methods of soil analysis, Part1. Rev. Physical and Mineralogical Methods. Amer. Soc. of Agron.Monogr. 9. pp.635-660.Klute, A. and C. Dirksen. 1986. Hydraulic conductivity and diffusivity; laboratorymethods: In A.Klute (ed). Methods of soil analysis, Part 1. Rev. Physical andMineralogical Methods. Amer. Soc.of Agron. Monogr. 9. pp.687-732.Lieth, J. H. and D. W. Burger. 1989. Growth of chrysanthemum using and irrigationsystemcontrolled by soil moisture tension. J. Amer. Soc. Hort. Sci. 114(3):387-392.Soil. Soil Sci. Soc. Am. J., 45:671-672.Milks, R. R., W. C. Fonteno, and R. A. Larson. 1989a. Hydrology of horticultural substrates: I.Characteristics of horticultural container media. J. Amer. Soc. Hort. Sci.114(1):48-52.Milks, R. R., W. C. Fonteno, and R. A. Larson. 1989b. Hydrology of horticultural substrates: II.Predicting physical properties of media in containers. J. Amer. Soc. Hort. Sci. 114(1):53-56.Milks, R. R., W. C. Fonteno and R. A. Larson. 1989c. Hydrology of horticultural substrates: III.Predicting air and water content in limited-volume plug cells. J. Amer. Soc. Hort. Sci. 114: 57-61.Puustjarvi, V. 1974. Physical properties of peat used in horticulture. Acta Hort. 37:1922-1929.Macroporosity of SoilÓ. Soil Sci. Soc. Am. J., 45:1246.Spomer, L. A. and R. W. Langhans. 1975. The growth of greenhouse bench Ramant. at high soil water contents: Effects of soil water and aeration. Commun. In SoilSci. Plant Anal. 6(5):543-553.van Genuchten, M. T. and D. R. Nielsen. 1985. On describing and predicting the hydraulic propertiesof unsaturated soils. E. G. S.; Ann. Geophysicae. 3:615-628.Wallach, R., F. F. da Silva, and Y. Chen. 1992a. Hydraulic characteristics of Tuff (Scoria) used as acontainer medium. J. Amer. Soc. Hort. Sci. 117(3):415-421. Proc. Int. Sym. Growing Media and HydroponicsEd. A.P. PapadopoulosTable 1. Percent volume of substrate attributed to total porosity (TP) and unavailable waterwater (AW) of 11 cm height substrate in a 12.5 cm height azalea container. UWCCASAWBD(% of Total Volume)(gácm Peat-based87.2a21.6a74.412.852.80.15aBark-based70.6b28.7a60.210.431.50.50bSoil-based56.5c12.5b51.3 5.238.81.10c TP= Total water dained + (wet weight - dry weight)CC= (wet weight - dry weight)AS= TP - CCUW= Water volume remaining after pressure of 1.5 MPa was applied.AW= CC - UWBD= Weight of solids / Total Volume Proc. Int. Sym. Growing Media and HydroponicsEd. A.P. PapadopoulosTable 2. Particle Size Distribution of Three Container Substrates Peat MixBark MixSoil MixMeanMeanMeanParticle SizeParticle (mm)(% of Dry Weight)Size Range � 6.30.852.511.046.3 -4.01.484.871.224.0 -2.82.724.803.12 2.8 -2.04.006.144.742.0 -1.47.637.919.021.4 -1.017.3211.2113.321.0 -0.7126.5416.4618.58 0.71 -0.5017.3216.4817.880.50 - 0.3559.2312.6513.070.355 - 0.2505.228.408.550.250 - 0.1802.994.764.730.180 - 0.1062.532.562.77 2.171.251.96 Peat substrate contained 1 sphagnum peat moss ()(v/v).ySoil is Sandy Loam (73.72% Sand, 21.95% Silt, 4.34% Clay)mm:;&#x 1 h;&#xorti; ult;&#xural;&#x gra;Þ v;rmi; uli;&#xte n;&#xo. 2;xParticle size range: Coarse = 2.0 mm, Medium = 0.50 - 2.0 mm, Fine = Proc. Int. Sym. Growing Media and HydroponicsEd. A.P. Papadopoulos Figure 1 -Average Effective Suction @ Container Capacity Proc. Int. Sym. Growing Media and HydroponicsEd. A.P. Papadopoulos 11010010001000020000 10 100 1000 1 2000 Figure 2 - Moisture retention curves for three substrates Proc. Int. Sym. Growing Media and HydroponicsEd. A.P. Papadopoulos Peat MixBark MixSoil Mix Solids Micropores Mesopores Macropores