/
Redfield Redfield

Redfield - PowerPoint Presentation

kittie-lecroy
kittie-lecroy . @kittie-lecroy
Follow
380 views
Uploaded On 2016-05-17

Redfield - PPT Presentation

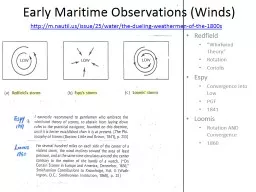
Whirlwind Theory Rotation Coriolis Espy Convergence into Low PGF 1841 Loomis Rotation AND Convergence 1860 Early Maritime Observations Winds httpmnautilusissue25watertheduelingweathermenofthe1800s ID: 323253

pressure isobars contour fronts isobars pressure fronts contour intermediates print maps standard weekly 1000mb location intervals 4mb working test

Share:

Link:

Embed:

Download Presentation from below link

Download Presentation The PPT/PDF document "Redfield" is the property of its rightful owner. Permission is granted to download and print the materials on this web site for personal, non-commercial use only, and to display it on your personal computer provided you do not modify the materials and that you retain all copyright notices contained in the materials. By downloading content from our website, you accept the terms of this agreement.


Presentation Transcript

Slide1

Redfield“Whirlwind Theory”RotationCoriolisEspyConvergence into LowPGF1841LoomisRotation AND Convergence1860

Early Maritime Observations (Winds)

http://m.nautil.us/issue/25/water/the-dueling-weathermen-of-the-1800sSlide2

Putting it Together (Air Masses)Slide3

A First Mention of FrontsSlide4

Norwegians Begin to go 3-DSlide5

Looking More Like Fronts!Slide6

Fronts and Cross-Sections: 1921Slide7

Another ViewSlide8
Slide9

Is the Norwegian Model Still Relevant?Unified Surface Analysis ManualSlide10

Artists don’t get it: Spot the Error!Slide11

What’s Wrong with This Picture?Slide12

How About This One?Slide13

Circled Obs DO NOT Fit CG Pressure Field!Slide14

Human-Adjusted Isobars: A Better FitSlide15

The Station ModelYou are expected to already know how to read thisPressure in this example is 1024.7mbIsobars:- The standard contour is simply a quasi-universal starting point for plotting, and is 1000mb- The contour interval is the change in value between isobars. It will be 4mb or less (2mb or 1mb for mesoscale)- Intermediate isobars are drawn in areas of slight pressure gradient and are ½ the value of the general map contour interval- Regular contours are solid lines, intermediates are long dash, nested intermediates are short dash and you may not jump to 1mb intermediates without first using 2mb intervalsSlide16

Some Standard Surface SymbolsFrontolysis and frontogenesis will be covered laterIgnore squall line, ridge, tropical wave: we do not plot the last two and use a different conven-tion for squall linesTroughs may be colored brown, purple or blackDrylines (ignore for now) may be colored brown or orangeSlide17

Reminders (things you should already know)Look over the error sheet when doing your weekly maps and try to avoid those most obvious mistakesFront Type is determined by air movement on cold side of boundaryFront Location is determined by careful analysis of:Pressure troughsWind shiftsTemperature and dewpoint gradientsCloud and precipitation locationPressure tendenciesSlide18

For Those Away at AMS…Class Policy (please keep these in mind):Working together on weekly maps is ENCOURAGED and RECOMMENDEDWorking together on weekly quizzes is considered CHEATING, these are designed to test individual knowledge and progressPre-TestPrint this and individually list the errors (do not work together on this)Do not include the jumpy nature of the isobars, this is an artifact of the crappy software I used, but, yes, isobars should be neat and smoothQuiz 1Print this and individually answer the questions and mark the appropriate maps. Have your glasses ready if needed, the numbers are very smallMap 1Print this, preferably on 11x17-inch paper (if available), and analyze:Fronts, highs and lows (proper symbols and color)Isobars (4mb intervals, 1000mb standard contour, label isobars, use regular black pencil)