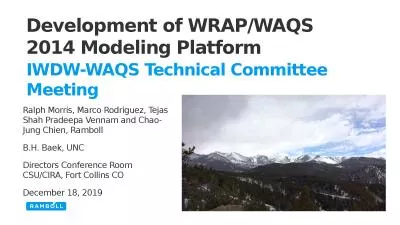
Intermountain Data Warehouse IWDW WAQS Workplan and Modeling Update University of North Carolina UNCIE Ramboll Environ Environ September 23 2015 WAQSIWDW Technical Committee Meeting ID: 398896
Download Presentation The PPT/PDF document "Western Air Quality Study (WAQS)" is the property of its rightful owner. Permission is granted to download and print the materials on this web site for personal, non-commercial use only, and to display it on your personal computer provided you do not modify the materials and that you retain all copyright notices contained in the materials. By downloading content from our website, you accept the terms of this agreement.
Slide1
Western Air Quality Study (WAQS)
Intermountain Data Warehouse (IWDW)
WAQS Workplan and Modeling UpdateUniversity of North Carolina (UNC-IE)Ramboll-Environ (Environ)September 23, 2015WAQS/IWDW Technical Committee MeetingSlide2
Summary
Modeling UpdateWinter O3 Sensitivity Results and Wiki MOVES2014 Sensitivity Results and WikiSimulation 2011a CAMx Source ApportionmentSimulation 2011b
CAMx MPENext StepsSlide3
Winter O3 Sensitivities
Objective: Evaluate the impacts of meteorology and emissions adjustments on simulating high wintertime O3DesignBase11a: 3SAQS 2011 Base version ABase11a_WinterO3
: WRF Winter MeteorologyBase11a_WinterO3_OG_Emis: add 10x HCHO, 2x VOC, 0.5x NOxBase11a_WinterO3_OG_Emis_Layers: add no layer collapsing in layers 1-6Simulate February-March 2011Slide4
Winter O3 Sensitivities
CAMx Sensitivity ResultsBase11a_WinterO3CAMx winter O3
predictions not sensitive to the met/CAMx adjustments aloneLess mixing = higher NOx concentrations = lower O3 concentrationsBase11a_WinterO3_OG_EmisO3/NOx/VOC sensitivity in areas of O&G activityBase11a_WinterO3_OG_Emis_LayersSmall changes relative to the emissions sensitivitySlide5
Winter O3 Sensitivities
CAMx Sensitivity Results: AQS Hourly O3
COUT
WY
The Q-Q plots highlight the response of the model in simulating air quality at the different monitoring networks to the sensitivities. At the upper end of the observed concentration range, the simulated O3 at the AQS sites in CO and UT responded favorably to the emissions and layer sensitivities; the O3 concentrations at the WY AQS sites did not show as drastic a change as the other states.Slide6
Winter O3 Sensitivities
CAMx Sensitivity Results: AQS Hourly NO2COUT
WYThe NO2 concentrations at the AQS sites in all three states were more responsive to the meteorology changes than either the chemistry or layers sensitivities.Slide7
Winter O3 Sensitivities
ResultsRangely, CORio Blanco CountyPiceance Basin*
Oil production siteAQS O3 and NO2
* Air quality conditions here are more like Uintah Basin sites than other
Piceance
Basin sitesSlide8
Winter O3 Sensitivities
Results: Rangely, ColoradoFebruary 2011
Hourly AQS NO2Hourly AQS O3Slide9
Winter O3 Sensitivities
Results: Rangely, ColoradoHigh O
3 episode mid-monthSignificant NO2 response to the emissions sensitivityNighttime O3 under-predictions from WRF sensitivityEmission sensitivity produces higher simulated O
3
CAMxSlide10
Winter O
3 SensitivitiesResultsRifle, CO
Garfield CountyPiceance BasinGas production siteAQS O3Garfield County VOCSlide11
Winter O3 Sensitivities
Results: Rifle, ColoradoO3
VOCHCHOSlide12
Winter O3 Sensitivities
Results: Rifle, ColoradoLow observed O3Simulated VOC increases in response to the sensitivity
O3 performance improves with WRF sensitivity, degrades with emissions sensitivityHighlights the problem with a brute-force emissions change
CAMxSlide13
Winter O
3 SensitivitiesResultsMyton
, UTDuchesne CountyUintah BasinOil production siteAQS O3 and NO2Slide14
Winter O3 Sensitivities
Results: Myton, UtahFebruary 2011
Hourly AQS NO2Hourly AQS O3Slide15
Winter O3 Sensitivities
Results: Myton, UtahHigh O
3 episode mid-monthAverage NO2 performance improves with emissions sensitivityWinter WRF squelches mixing = too much NOx = low O3
Higher simulated O3
during high observation periods = negative O
3
bias reduced
CAMxSlide16
Winter O3 Sensitivities
SummaryDespite a lot of work and analysis, more to be doneIn general, the meteorology and emissions sensitivities produced the best results at the Uintah Basin sites, relative to the other O&G basinsNone of the sensitivity configurations were particularly effective at improving the O3 model performance in the Upper Green or
Piceance Basins. Wiki for Additional Results and Discussion: http://vibe.cira.colostate.edu/wiki/wiki/2082/winter-ozone-aq-modeling-resultsSlide17
MOVES2014 Sensitivity
Objective: Evaluate the impacts of MOVES2014a onroad mobile emissions on simulated air qualityDesignSensitivity off of simulation Base11aReplace only the onroad
mobile emissions (MOVES201b) with MOVES2014aSimulate January and July 2011Slide18
MOVES2014 Sensitivity
January AQS Carbon Monoxide
MOVES2014 results in lower winter CO than MOVES2010b
CO
UT
WY
4-kmSlide19
MOVES2014 Sensitivity
July AQS Carbon MonoxideMOVES2014 also results in lower summer CO than MOVES2010bCO
UTWY4-kmSlide20
MOVES2014 Sensitivity
January AQS NO2MOVES2014 results are more mixed for NO2Mostly decreases in UT and WYSome increases in CO at lower concentrations
COUTWY4-kmSlide21
MOVES2014 Sensitivity
July AQS NO2Summertime NO2 increases in CO and WYAverage decrease across domain, but some periods/locations see increases in NOx
COUTWY4-kmSlide22
Jan
Jul
MOVES2014 SensitivityAQS and CASTNET MDA8 O3CO
UT
WYSlide23
Jan
JulMOVES2014 SensitivityIMPROVE and CSN Total PM2.5
COUTWYSlide24
MOVES 2014 SensitivitySummary
Fairly large emissions changes from MOVES2010b to MOVES2014, reflected in CAMx NO2 and CO performanceMOVES update does not result in major changes in simulated O3 and total PM2.5Wiki for
additional results and discussion: http://vibe.cira.colostate.edu/wiki/wiki/1067/moves2014-sensitivity-modeling-resultsSlide25
2011 Geographic Source Apportionment
2011a EmissionsRunning now21 Source Regions5 Source CategoriesNatural (Bio, Lx, SS, WBD)3 Fires (WF, Rx, Ag)Remainder Anthropogenic
Ozone/APCA 36/12 kmPSAT/PM 36 km only (new)O3, PM, Vis and Dep ContributionCSAPR-type AnalysisRHR Impaired vs. W20% DaysGrid cell definition of 17 States, Mex, Can, EUSA, Off-ShoreSlide26
Geographic SA Results
Annual Average PM2.5 – with Fires
2011
2008Slide27
2011
2008
Geographic SA Results
Annual Average PM2.5 – No FiresSlide28
Geographic SA Results
Annual Max 24-hour PM2.5 – with Fires
2011
2008Slide29
2011
2008
Geographic SA Results
Annual Max 24-hour PM2.5 – No FiresSlide30
2011
2008
Geographic SA Results
Colorado Anthropogenic Emissions
Contributions to 4
th
Highest MDA8 O3Slide31
2011
2008
Geographic SA Results
Colorado Anthropogenic Emissions
Contributions to Annual Maximum MDA8 O3Slide32
2011
2008
Geographic SA ResultsColorado Anthropogenic Emissions
Contributions to Annual Maximum MDA8 O3 >= 70 ppbSlide33
WAQS Simulation Base11b
Objective: Improve the Western U.S. 2011 regional modeling platform with insights gained from the evaluation of 3SAQS simulation Base11aDesignWinter configuration for December 15, 2010 – March 2011 (WRF Winter and CAMx Snow Albedo/
Chem)MOZART BC’s with a dust and sea salt set to zeroMOVES2014a onroad mobile emissionsNEI2011v6.2 (2011v2 platform)0.5x RWC emissions 3SAQS Phase II O&G emissions
PMDETAIL 2011 version B firesSlide34
WAQS Simulation Base11bSummary of Phase II O&G
Unchanged from Phase IAll permitted (point), Paradox and Raton BasinsWyoming survey-based emissionsCondensate tank EI in D-J, Piceance
, and N. San JuanAddition of Williston and Great Plains BasinsFracing emissions added to the D-J, Piceance, Uinta, North San Juan, and South San Juan basinsUinta
Basin tribal emissions estimates based on EPA Tribal MNSR
data
A
rtificial
lift engines, condensate tanks, heaters, oil tanks, pneumatic pumps, condensate truck
loadingSlide35
WAQS Simulation Base11bE
missions ResultsDRAFT DO NOT CITESlide36
WAQS Simulation Base11bE
missions ResultsDRAFT DO NOT CITESlide37
WAQS Simulation Base11bE
missions ResultsDRAFT DO NOT CITESlide38
WAQS Simulation Base11bE
missions Results: NOx
DRAFT DO NOT CITESlide39
WAQS Simulation Base11bE
missions Results: VOC
DRAFT DO NOT CITESlide40
WAQS Simulation Base11bE
missions Results: Relative DifferencesDRAFT DO NOT CITESlide41
WAQS Simulation Base11bE
missions SummaryOnroad: Colorado and Wyoming increases, decreases in UtahFires: VOC and SO2 increase, decreases in PM
2.5RWC: 50% decreaseDRAFT DO NOT CITESlide42
3SAQS Base 2011a MPE
2-slide summary of 2011a MPESummer O3 OKToo little winter O3Too much NO2
All AQS and
CASTNet
sites 4-km domain
Myton
, UT MDA8
Colorado AQS NO
2Slide43
3SAQS Base 2011a MPE
High seasonal PM2.5 biasPM performance issues with all species
Wet deposition too lowIMPROVE Total PM2.5
CSN Total PM
2.5Slide44
WAQS Simulation Base11bMDA8 Ozone Performance: All
AQS sites 4-km DomainAQS MDA8 for Base11b
is within performance goals in all monthsDomain-wide, Base11a has lower NMB in most monthsOutside of Jan-Mar Base11b has higher O3, on average, than Base11a.
DRAFT DO NOT CITESlide45
WAQS Simulation Base11bMDA8 Ozone Performance: All
CASTNet sites 4-km DomainDRAFT DO NOT CITE
CNET MDA8
for
Base11b
is within performance goals in all months
Domain-wide,
Base11b
has lower NMB in most months
Performance for
Base11a
and
Base11b
comparable for months other than February and March.Slide46
WAQS Simulation Base11bHourly NO2 Performance: All
AQS sites 4-km DomainDRAFT DO NOT CITE
High NO2 biases is reduced in
Base11b
at AQS sites across the 4-km domain
NO2 is still overestimated in most months Slide47
WAQS Simulation Base11bWinter O3 Performance: AQS MDA8 Ozone
DRAFT DO NOT CITE
The WRF winter configuration and O&G inventory updates did not improve high winter O3 simulation
Basin-specific emissions improvements are needed
Myton
, UT
Boulder, WYSlide48
WAQS Simulation Base11bDaily Max Total PM2.5 Performance: All sites 4-km Domain
DRAFT DO NOT CITE
Total PM2.5 is lower in simulation
Base11b
, leading to improvement in overestimates seen in
Base11a
.
Zeroing the dust boundary conditions reduce the total PM2.5 in all months.
CSN
IMPROVESlide49
WAQS Simulation Base11bDaily Max Total PM2.5 Performance:
CSN sites 4-km DomainDRAFT DO NOT CITE
Winter OC at urban CSN sites reduced in
Base11b
, leading to improvement over
Base11a
; model still over estimates OC.
Summer dust (Other) reductions improve overall CSN performance.
B11a
B11b
B11a
B11b
Winter
SummerSlide50
WAQS Simulation Base11b
Daily Max Total PM2.5 Performance:
IMPROVE sites 4-km Domain
DRAFT DO NOT CITE
Dust at rural IMPROVE sites also reduced in
Base11b
, leading to improvement over
Base11a
Aerosol nitrate underestimated in
Base11b
B11a
B11b
B11a
B11b
Winter
SummerSlide51
Next StepsComplete MOVES sensitivity documentation on Wiki
Recommendations for future winter modeling work2011b MPEWet deposition, visibility, and NH3 analysisOzone aloftDraft MPE reportCMAQ 2011b 36/12/4km in process nowAdd to MPE report2011b Platform release in November
Future year simulation