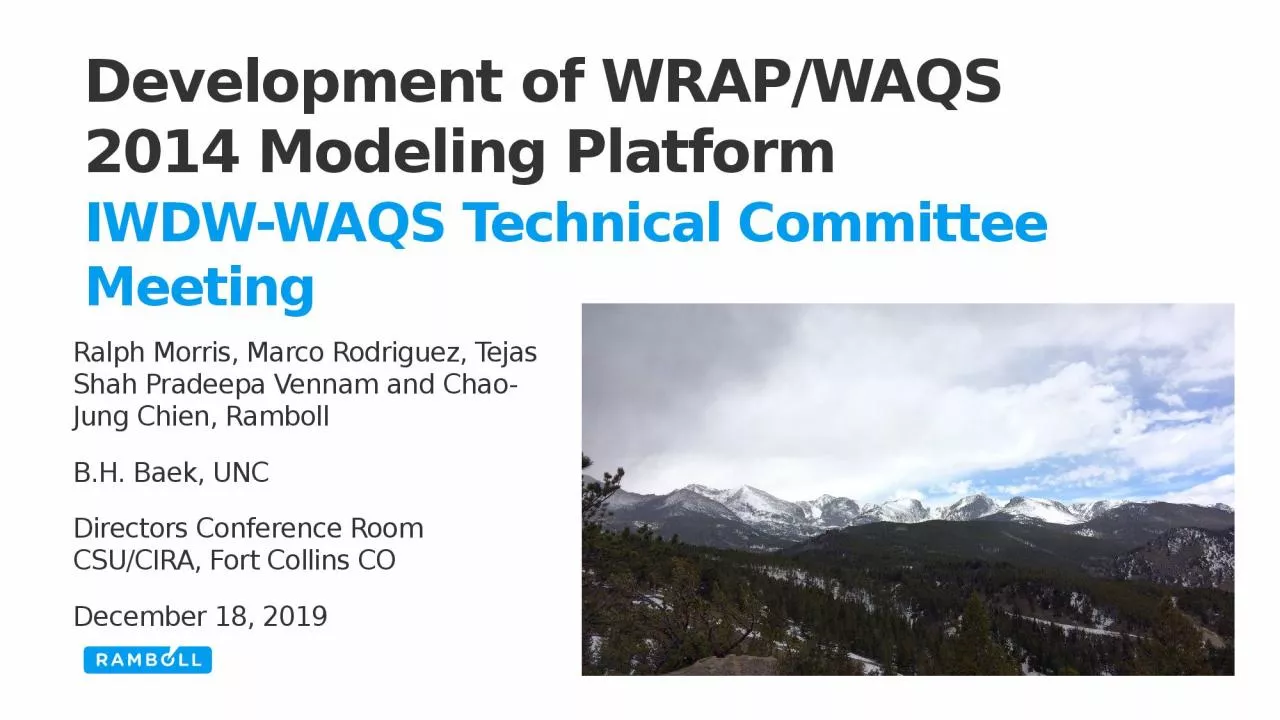
/
Development of WRAP/WAQS 2014 Modeling Platform Development of WRAP/WAQS 2014 Modeling Platform

Development of WRAP/WAQS 2014 Modeling Platform - PowerPoint Presentation

scarlett
scarlett . @scarlett
Follow
64 views
Uploaded On 2023-12-30

Development of WRAP/WAQS 2014 Modeling Platform - PPT Presentation

IWDWWAQS Technical Committee Meeting Ralph Morris Marco Rodriguez Tejas Shah Pradeepa Vennam and ChaoJung Chien Ramboll BH Baek UNC Directors Conference Room CSUCIRA Fort Collins CO December 18 2019 ID: 1036287

wrap 2014 modeling camx 2014 wrap camx modeling 2014v1 emissions repbase waqs 2028 task amp wrf phase 2014v2 epa

Share:

Link:

Embed:

Download Presentation from below link

Download Presentation The PPT/PDF document "Development of WRAP/WAQS 2014 Modeling P..." is the property of its rightful owner. Permission is granted to download and print the materials on this web site for personal, non-commercial use only, and to display it on your personal computer provided you do not modify the materials and that you retain all copyright notices contained in the materials. By downloading content from our website, you accept the terms of this agreement.


Presentation Transcript

1. Development of WRAP/WAQS 2014 Modeling PlatformIWDW-WAQS Technical Committee MeetingRalph Morris, Marco Rodriguez, Tejas Shah Pradeepa Vennam and Chao-Jung Chien, RambollB.H. Baek, UNCDirectors Conference RoomCSU/CIRA, Fort Collins CODecember 18, 2019

2. WRAP/WAQS 2014 Modeling Study (Dec 2018 - Dec 18, 2019)Completed WRAP/WAQS 2014v1 Shake-Out PGM Modeling (Phase I & II)Task 1: Modeling Protocol and Addendum (Plan)Task 3: 2014v1 Emissions Development and Modeling (EI)Task 4: Evaluate WAQS vs. EPA WRF 2014 36/12-km Meteorology (Met)Task 5: Process EPA 2014 GEOS-Chem for Boundary Conditions (BCs)Task 6: PGM 2014 Sensitivity and Final 2014v1 CAMx/CMAQ Annual 2014v1 & MPEFinishing Up WRAP/WAQS 2014v2/RepBase PGM Modeling (Phase II)Task 1: Additional PGM Sensitivity Tests and Final Annual PGM 2014v2 with MPETask 2: Representative Baseline (RepBase) SMOKE and PGM ModelingIncludes CAMx ANT/NAT/FIR Source Apportionment and GC/CAMx NAT & ZROW Zero-Out ModelingTask 3: Dynamic Evaluation (2002) Scoping StudyJust Started 2028 SMOKE/PGM Modeling & Reg Haze Development (Phase IV)Task 3: Dynamic Evaluation (2002 Modeling)Task 4: 2028 SMOKE Emissions and CAMx Photochemical ModelingTask 6: IWDW Verification, Data Transfer and Regional Haze Tool DevelopmentTask 6.2: WEP/AOI Analysis

3. 2014v1 Shake-Out Modeling Study Documentation on IWDW3

4. WRAP/WAQS 2014v1 Shake-Out Modeling ObjectivesUse existing information to develop a 2014 PGM modeling platform for western U.S. and provide initial testingJan-Apr 2019CAMx and CMAQ (PGMs)Standard “RPO” 36-km Resolution CONUS modeling domainTwo 12-km Domains Considered:WAQS 12WUS2 (WESTUS)EPA 12US2 (USA)4

5. WRAP 2014v1 Shake-Out Modeling Available DataBoundary Conditions (BC) – Defines transported pollutants (international) coming in through boundaries of the 36-km CONUS domain:EPA’s 2014 GEOS-Chem global chemistry model simulationMeteorology (WRF) – 3-D Transport, Temperature, Moisture, etc. within 36/12-km domainsTwo 2014 simulations of the Weather Research Forecast (WRF) model:Western Air Quality Study (WAQS) 36-km CONUS and 12-km 12WUS2 WESTUS domainsEPA 12-km 12US2 (USA) domain (used for EPA’s 2014 12US2 NATA Modeling Platform)Emissions (EI) – Point and Surface Anthropogenic and Natural EmissionsVersion 2 of the 2014 National Emissions Inventory (2014NEIv2)With updates to Point and Non-Point sectors in western StatesBiogenic emissions using MEGAN and BEISSea Salt (SSA), Lightning NOx (LNOx), Windblown Dust (WBD), Dimethyl Sulfide (DMS)CAMx processors and CMAQ in-line algorithms for SSA, LNOx and WBD5

6. 2014v1 Shake-Out – EPA 2014 GEOS-Chem BC (GCBC) SensitivityEPA 2014 GEOS-Chem BC (GCBC) causes ozone overestimation year-roundMore pronounced in cold monthsCAMx Inert BC-Only at Gothic, COEPA 2014 GCBC SO4 overestimation June-July, 2014Caused by climatological volcano eruptionsCorrected w/ EPA re-run Jun-Jul, 2014Original and Revised EPA 2014 GCBC6SO4 -- YELL

7. 2014v1 Shake-Out – EPA vs. WRF Met Sensitivity MPE77PRISM (obs) EPA WRF WAQS WRFAugust 2014 Monthly Precipitation ComparisonEPA WRF Overestimates Summer Precipitation

8. 2014v1 Shake-Out – EPA vs. WRF Met Sensitivity MPEConclusions of WAQS vs. EPA 2014 WRF MPE Comparison in WUS:Across all surface meteorological sites in Western U.S.:WAQS WRF has better Wind (WS/WD) and Humidity performance than EPA WRFEPA WRF has slightly better Temperature performance than WAQS WRFWRF Precipitation performance using PRISM Data:EPA WRF overstates summer (convective) precipitation compared to WAQS WRFCAMx Performance inconclusive using WAQS vs. EPA MetGCBC overstates O3; PM2.5 understated (WAQS slightly less bias)WRF and CAMx WRF MPE products available on 2014v1 Webpage on IWDWSelect WAQS WRF Meteorology for final 2014v1 configurationBetter summer precipitation model performance than EPA WRFAble to use two-way nesting with WAQS 36/12-km WRF dataWAQS 12WUS2 domain more computationally efficient than EPA 12US28

9. 2014v1 Shake-Out – MEGAN vs. BEIS Biogenic Sensitivity MPECAMx January and July 2014 sensitivity tests using MEGAN vs. WRF biogenic emissionsOzone biogenic emissions MPE confounded by overstated EPA GCBCCAMx NO3, EC, Soil and CM MPE comparable using MEGAN vs. BEISBiggest difference in Organic Aerosol (OA) MPE due to SOA9BEISMEGANJulySOA

10. WRAP 20141 -- MEGAN vs. BEIS vs. Obs OA MPE – MORA & LAVO10

11. WRAP 20141 -- MEGAN vs. BEIS vs. Obs OA MPE – BRID & CAPI11

12. WRAP 2014v1 -- MEGAN vs. BEIS Biogenic ConclusionsOther than OA and resultant PM2.5, CAMx using MEGAN vs. BEIS biogenic emissions MPE comparableBEIS produces higher SOA and mostly better OA MPE than MEGAN biogenic EIComparable WA/OR, better most every else except Desert SouthwestSelected BEIS biogenic emissions for final 2014v1 configuration12

13. 13WRAP/WAQS 2014v1 Shake-Out Anthropogenic Emissions2014NEIv2 Emissions with Western State Updates (9 States/9 Sectors)Arizona, California, Idaho, Montana, New Mexico, North Dakota, Oregon, Utah, WashingtonFugitive Dust (afdust), Agricultural (ag), Nonpoint, Nonpoint Oil/Gas (np_oilgas), Point Oil/Gas (pt_oilgas), Point EGU, Point Non-IPM, Rail and Residential Wood Combustion (RWC)13

14. WRAP 2014v1 Shake-Out (Phase I&II) Final Configuration14CAMxCMAQVersionv.6.50v.5.2.1MeteorologyWAQS WRF 36/12-kmHorizontal Domain36US and 12WUS2 One-Way NestingBCONEPA 2014 GEOS-Chem w/ no eruptions Jun/JulBiogenic EmissionsBEISAnthro EmissionsWRAP 2014v1 – 2014NEIv2 w/ Western State UpdatesWindblown DustOff-line CAMx windblown dustLighting EmissionsOff-line CAMx LNOx pre-processorIn-line CMAQ LNOxSea Salt EmissionsOff-line CAMx oceanic pre-processor that includes SSA and DMS modeled as SO2In-line CMAQ for just Sea Salt (SSA) (no DMS)Chemical MechanismCB6r4 with SOAP + ISORROPIACB6r3 with AE6 + ISORROPIA (CB6r3_AE6_AQ)

15. WRAP 2014v1 Shake-Out -- Ozone MPECAMx and CMAQ 2014v1 significantly overestimates observed ozone concentrationsHigher overestimation in colder monthsCAMx overestimation higher than CMAQDue to EPA 2014 GEOS-Chem overstated ozone GCBCs15CMAQCASTNetSummerCAMxCASTNetSummer

16. WRAP 2014v1 Shake-Out -- PM2.5 MPEPM2.5 underestimated in summer and overestimated in winterCAMx bias slightly lower than CMAQWildfires can have big effect on PM2.5 performance16CMAQIMPROVESummerCAMxIMPROVESummer

17. 2014v1 -- SO4 MPEGenerally reasonably good MPE with winter overestimation/summer underestimationCAMx SO4 higher than CMAQEspecially at coastal sites in summerExcept for coastal sites, neither model performing better than other17CMAQ JulyCAMx JulyJulyCMAQSummerCAMxSummer

18. 2014v1 – NO3 MPEMainly NO3 underestimation in WUS except in winterCAMx generally higher than CMAQ, especially coastal areasNo one model performing better for NO3 than the other18CMAQ JanCAMx JanJan

19. 2014v1 – OA MPEOrganic Aerosol (OA/OC) is overestimated by both modelsCMAQ overestimation larger than CAMxOverestimation highest in Aug/Sep lowest in Apr-JulWildfires may contribute in Aug/Sep19CMAQWinterCAMxWinterCMAQSummerCAMxSummer

20. 2014v1 PM Concentrations on Most Impaired Days (MID)20

21. 2014v1 PM Concentrations on Most Impaired Days (MID)21

22. 222014v1 PM Concentrations on Most Impaired Days (MID)22

23. Conclusions 2014v1 Shake-Out MPE (Phases I&II)O3: Both models overpredict throughout the year (GCBC).PM2.5: Both models show similar model performance, overpredict (Winter and Fall) and underpredict (Spring and Summer). CAMx generally better than CMAQ.SO4: Both models showed similar seasonal trends and reasonable model performance. CAMx coastal overestimation bias.NO3: Both models overpredict nitrate in Winter. Both underpredict rest of the year. Biases smaller for CMAQ in the winter but larger rest of year.OA: Systematically over-predicted throughout the year, CAMx model performance slightly better than CMAQ. EC: Similar reasonable performance between both models. Both overpredict in the summer.CM: Both models systematically underpredict concentrations throughout the year.MID: Decreasing OA contributions for MID may help performance since both models systematically overpredict OA. NO3 generally underestimated.23

24. WRAP 2014 Platform Development Phase III (Jun-Dec 2019)Task 1.1: Additional PGM Sensitivity TestsNew PGM versions; Coastal SO4 overestimation; NO3 underestimation; OA overestimationTask 1.2: Revised 2014 GEOS-Chem Simulation for new BCsCorrect Ozone BC overestimation bias and potential other improvementsTask 1.3: 2014v2 SMOKE Emissions ModelingNew 2014v2 California emissions and western state updatesTask 1.4: Fire Sensitivity Modeling2014NEI Bluesky vs. WRAP emissions and plume rise approachTask 1.6: 2014v2 CAMx Modeling and MPETask 2: Representative Baseline (RepBase: 2014-2018) Emissions and PGM ModelingTask 1.7: GC 2014 and CAMx RepBase NAT and ZROW Zero-Out Anthro ModelingTask 1.8: CAMx RepBase ANT/NAT/FIR U.S. vs. Intl Source ApportionmentTask 3.1: Dynamic Evaluation (2002) Modeling Plan24

25. WRAP 2014 Phase III – Task 1.1: Additional Sensitivity TestsCAMx SO4 Coastal Overestimation BiasCAMx v7.0 Explicit DMS Chemistry Sensitivity TestsObservedCAMx v7.0 Base CaseCAMx v7.0 Explicit DMS Chemistry with DMS EmissionsCAMx v7.0 Explicit DMS Chemistry with DMS Emissions and BCCAMx v7.0 no DMS EmissionsExplicit DMS chemistry does not eliminate coastal SO4 biasDMS only partially responable for biasRetain DMS in CAMx modeling as not justified to eliminate25Point Reyes, CA (PORE)Seasonal Extinction Performance

26. WRAP 2014 Phase III – Task 1.1: Additional Sensitivity TestsBiDirectional (BiDi) Ammonia Flux SensitivityCAMx v7.0 w/ BiDi Ammonia SensitivitySmall NO3 changes in winterLittle effect on NO3 overestimationLarger relative changes in other monthsImproves NO3 underestimation biasRetain BiDi ammonia deposition for final CAMx 2014v2 configuration26

27. WRAP 2014 Phase III – Task 1.2: Revised 2014 GEOS-ChemWRAP Revised 2014 GEOS-ChemMore Current Geos-ChemHigher ResolutionMore Recent EmissionsMuch improvement in ozone MPEEspecially in WinterOther species not affected muchSlightly better SO4Use WRAP 2014 GEOS-Chem for 2014v2 BCs27OJan: Lava Beds, CA Jul: Lava Beds, CA Jan: Gothics, COObserved MDA8 OzoneEPA 2014 GEOS-ChemWRAP 2014 GEOS-Chem

28. WRAP 2014 Phase III – Task 1.1: Additional Sensitivity TestsFire Sensitivity TestsWRAP (DEASCO3/PMDETAIL) fire modeling approachAir Sciences processing (FSWG)More efficient plume rise approach in CAMx with Plume top and bottom2014NEI Bluesky fires took almost two weeks to process and generated many Tb of dataWRAP approached produced higher PM concentrations near firesMPE of WRAP vs. Bluesky fires comparableAdopt WRAP Fire modeling approach for 2014v228LAVOGRCAHECA

29. WRAP 2014 Phase III – Task 1.1: Additional Sensitivity TestsNew Versions of CAMx (v7.0)Addition of Explicit Elemental Species (Fe, Mg, Mn, Ca, K, Al, Si, Ti) Five elements used in Aqueous-phase chemistry as they influenced cloud water pH (Ca, Mg, K) and metal catalysed SO4 formation (Fe, Mn).One element forms mineral nitrate (CaNO3) in ISOROPPIA.Six elements are used in IMPROVE SOIL equationRe-processing emissions allows inclusion of SOAALK SOA precursorSource Apportionment allows for the tracking of stratified Boundary Conditions (BC) For example, U.S. Anthropogenic; International Anthropogenic; Natural Sources New Version of CMAQ (v5.3)Improved ISAM Source Apportionment (untested)No longer supports layer collapsing (not compatible with 2014v1 modeling)Proceed with CAMx v7.0 modeling in 2014v2Conduct CMAQ 2014v2 and 2028OTBb modeling as time allows29

30. WRAP 2014v2 Phase III – Task 1.3: 2014v2 SMOKE Emissions2014v2 complete replacement of 2014v1 emissions for California (CARB)30Other western state updates

31. 312014v1 vs. 2014v2 Final Model Configuration(Major Changes in Red)OptionCAMxCMAQ (Postponed)2014v12014v22014v12014v2ModelCAMx v6.5CAMx v7.0CMAQ v5.2.1CMAQ V5.3NestingOne-Way Two-WayOne-WayOne-Way# Levels25252535BCsEPA GCWRAP GCEPA GCWRAP GCAnthro.2014v12014v22014v12014v2BiogenicBEISBEISBEISBEISFiresBlueskyWRAPBlueskyBlueskyNH3 BiDiNoYesNoNoElementsNoYesYesYesSOAALKNoYesYesYes

32. 32CAMx 2014v2b – Sulfate (SO4) IMPROVE 2014 Q3NMB = -11%; NME = 52%

33. CAMx 2014v2b – Nitrate (NO3) IMPROVE 2014 Q333NMB = +11%; NME = 86%

34. CAMx 2014v2b – Organic Aerosol (OA) IMPROVE 2014 Q334NMB = +74%; NME = 104%

35. WRAP 2014 Phase III – Remaining TasksTask 1.6: CAMx 2014v2 Base Case Modeling and Model Performance EvaluationCAMx 2014v2 simulations completed, working on MPE and coordinating with IWDWWill be documented in numerous products in Webpage on IWDWTask 2: RepBase SMOKE and CAMx ModelingPreparing RepBase Emissions – Must be consistent with 2028OTBaCAMx RepBase starts next weekTask 1.7: 2014 GEOS-Chem/CAMx RepBase NAT and ZROW Modeling2014 GEOS-Chem done; waiting for CAMx RepBaseTask 1.8: CAMx RepBase NAT/ANT/FIR Source ApportionmentWaiting for CAMx RepBaseTask 3.1: Dynamic Evaluation Scoping StudyUpdated Dynamic Evaluation Modeling Plan dated Dec 10, 201935

36. 36Sources of RepBase (2014-2018) and 2028OTBa EmissionsSource SectorRepresentativeBaseline2028 OTBaCalifornia 12WUS2CARB-2014v2CARB-2028WRAP Fossil EGU w/ CEMWRAP-RB-EGUWRAP-2028-EGUWRAP Fossil EGU w/o CEMWRAP-RB-EGUWRAP-2028-EGUWRAP Non-Fossil EGUEPA-2016v1EPA-2028v1Non-WRAP EGUEPA-2016v1EPA-2028v1O&G WRAP O&G StatesWRAP-RB-O&GWRAP-2028-O&GO&G WRAP Other StatesEPA-2016v1EPA-2028v1O&G non-WRAP StatesEPA-2016v1EPA-2028v1WRAP Non-EGU Point2WRAP-2014v2EPA-2028v1Non-WRAP non-EGU PointEPA-2016v1EPA-2028v1On-Road Mobile 12WUS2WRAP-2014v2WRAP-2028-MobileOn-Road Mobile 36USEPA-2016v1EPA-2028v1Non-Road 12WUS2EPA-2016v1WRAP-2028-MobileNon-Road non-WRAP 36USEPA-2016v1EPA-2028v1Other (Non-Point) 12WUS2EPA-2016v1EPA-2028v1Can/Mex/Offs 12WUS2EPA-2016v1EPA-2028v1Fires (WF, Rx, Ag)WRAP-RB-FiresWRAP-RB-FiresNatural (Bio, etc.)WRAP-2014v2WRAP-2014v2Boundary Conditions (BCs)WRAP-2014-GEOS5WRAP-2014-GEOS2018OTBb2014v2-Fires

37. WRAP 2014 Phase III – Building Blocks for Regional Haze SIPs2014v2 CAMx actual base case and model performance evaluation (MPE)MPE essential component of any PGM applicationAdd MPE criteria for selecting days in 2028 Visibility ProjectionsCAMx Representative Baseline (RepBase) ModelingRepresents 2014-2018 five-year planning period for projecting to 2028Representative Baseline Anthro/Natural Source Apportionment ModelingBreakdowns RepBase visibility by: U.S. Anthropogenic; International Anthropogenic; Fires; and NaturalCalculate modeled Most Impaired Days (MID) and International Anthro ContributionNatural (NAT) and International Anthropogenic Emissions (ZROW) SimulationsCoupled 2014 GEOS-Chem and CAMx RepBase zero-out modelingModeled estimate of Natural conditions (NAT) & International Anthro Contribution (ZROW)37

38. Task 7: Development of 2028 Mobile Source Emission Inputs for the Western U.S.Sources: On-Road Mobile; Off-Road Equipment; Rail; Aircraft; MarineTemporal: Hourly speciated emissions for 2028 emissions yearGeographic: 12-km 12WUS2 Domain at 12-km resolutionOn-Road Mobile Sources:2028 MOVES Emissions Factor (EF) Look-Up Tables2014 WAQS WRF hourly gridded meteorology for 12WUS2 domainSMOKE-MOVES v4.7 modelingNon-Road Mobile Sources: Off-Road equipment using MOVES with western state updatesUpdate EPA/MJO 2028 rail, marine and airport emissions using western state dataEmissions Modeling in December; Documentation and Model-Ready Data in January2028 Mobile Sources Project: On-road and Non-Road38

39. WRAP 2014 Phase IV – Task 3: Dynamic EvaluationPhase III Task 3.1 Modeling Plan updated December 10, 2019Backcast 2014v2 U.S. anthropogenic emissions to 2002CAMx 2002 simulation using 2002 U.S. anthropogenic and RepBase other emissions and BCsSeveral products from Dynamic EvaluationU.S. anthropogenic emissions contribution to visibility impairment for 2002, RepBase (2014-2018) and 2028 (eventually)Evaluate Most Impaired Days (MID) projection technique by comparing observed IMPROVE MID visibility between 2000-2005 Baseline and 2014-2018 5-year planning period with modeled changes in MID visibility between 2002 and RepBaseCan evaluate for total MID visibility impairment and by species (AmmSO4, AmmNO3, etc.)39

40. WRAP 2014 Phase IV – Task 4: 2028 Modeling2028 SMOKE emissions modeling of anthropogenic sourcesHold natural emissions and Boundary Conditions (2014 GEOS-Chem) constant at 2014v2 levelsTwo 2028 On-the-Book/On-the-Way CAMx simulations:2028OTBa: Use RepBase fire emissions2028OTBb: Use 2014v2 actual fire emissions2028 Visibility Projections using RRFS:CAMx 2014v2 & 2028OTBb w/ 2012-2016 IMPROVE MIDCAMx RepBase & 2028OTBa w/ 2014-2018 IMPROVE MIDUse Alternative RRF ApproachesAccount for Effects of International Emissions in URP GlideslopesGEOS-Chem & RepBase CAMx ZROW ModelingRepBase ANT/NAT/FIRE and USA/non-USA PM Source Apportionment Modeling40

41. WRAP 2014 Phase IV – Task 4.6 2028 State-Specific Source Apportionment Modeling (scope out ozone APCA as well)CAMx 2028OTBa PM Source ApportionmentSO4, NO3, NH4, EC, POA, Soil, CMNo SOA (do have SOAA and SOAB)Straw Person Starting PointGeographic Regions:17 western states, EUSA, Can, Mex, Off-shoreSource Sectors:Natural, WF, Rx+Ag, O&G, EGU Point, Non-EGU Point, On-Road, Non-Road, Remainder AnthroBoundary Conditions (GCBC):Natural, U.S. Anthro, Intl AnthroTask Products:2028 Vis Impairment at CIAs by State and SectorContributions of International Anthro emissions41

42. WRAP 2014 Phase IV: Task 6: IWDW Support2014v2, RepBase and 2028OTB CAMx verification runs on IWDWAssist IWDW in implementing modeling results on IWDWTechnical Support System (TSS) and WRAP 2014 modeling webpageInteractive tools for MPE, URP Glideslope, Source ApportionmentWeighted Emissions Potential (WEP)/ Area of Influence (AOI)42AOI: Residence TimeBack Trajectories on MIDSO4 EWRTSO4 WEP

43. WRAP 2014 PHASE IV MODELING SCHEDULE43Some delays in RepBase as need to fix CA Fug Dust (Task 6.4)

44. WRAP/WAQS 2014 Modeling Study Webpage DocumentationWRAP/WAQS 2014v1 Shake-OutModeling Plan and Addendum2014 WRF Evaluation2014v1 SMOKE EmissionsSensitivity Tests and Final 2014v1 CAMx/CMAQ and MPE2014v2 CAMx Base Case and MPEAdditional Sensitivity TestsFinal 2014v2 ConfigurationCAMx 2014v2 Base Case and MPEDynamic Evaluation2002 Emissions Development/Results2002/RepBase Dynamic Evaluation2002/RepBase/2028 US Ant Visibility4. RepBase and 2028 ModelingRepresentative Baseline & 2028 Emissions2028 Visibility Projections (TSS)WAQS 2013 Source Apportionmenta. 2014 GC/CAMx RB NAT & ZROWb. RepBase CAMx ANT/NAT/FIRc. 2028 CAMx State/Source Sectord. SrcApp Visualization Tool (SAVT)WEP/AOI Analysisa. Technical Approachb. EWRT Source Sector/Point SourceTechnical Support System (TSSV2)a. Glide Path 2028 Projectionsb. WEP/AOI – WEPVTc. Source Apportionment -- SAVT44