PPT-Designing index-based insurance for livestock
Author : lastinsetp | Published Date : 2020-08-28
Francesco Fava International Livestock Research Institute 1 INDEXINSURANCE FOR LIVESTOCK IN THE IGAD REGION MINISTERIAL POLICY ROUNDTABLE amp TECHNICAL WORKSHOP
Presentation Embed Code
Download Presentation
Download Presentation The PPT/PDF document "Designing index-based insurance for live..." is the property of its rightful owner. Permission is granted to download and print the materials on this website for personal, non-commercial use only, and to display it on your personal computer provided you do not modify the materials and that you retain all copyright notices contained in the materials. By downloading content from our website, you accept the terms of this agreement.
Designing index-based insurance for livestock: Transcript
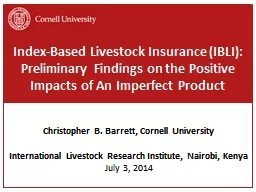
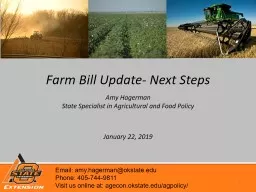
Francesco Fava International Livestock Research Institute 1 INDEXINSURANCE FOR LIVESTOCK IN THE IGAD REGION MINISTERIAL POLICY ROUNDTABLE amp TECHNICAL WORKSHOP ILRI Campus Addis Ababa 2426 June 2019. At Ark Agency, we are concerned with the specific equine insurance needs that you have, and not what your broker thinks you have. Often times, insurance agents and brokers will come up with a list of risks that they assume you have, without looking directly at your unique needs. The outcome is often horse insurance that is unfavorable for you. For Famine Prevention. Christopher B. Barrett. C.H. Dyson . School . of Applied Economics & Management and Dept. . of Economics . Trustee Council Annual Meetings. October 27, 2012. Droughts and Humanitarian Emergencies in East Africa. SSTI webinar series . March 27, 2013. Presented by SSTI. March 27, 2013. Executive-level Community of Practice. Technical assistance. Resource for the transportation community. SSTI webinar. 2. State Smart Transportation Initiative. Climate variability has an enormous impact on agricultural productivity, especially in developing countries, as it can prevent farmers from making productive choices that can lead to higher yields. Thus, “bad years” tend to be the main source of risks to farmer incomes and consumption practices. Farmers must try to manage those risks, and be more productive in the remaining “normal” years, even if those years are not quite as good as they used to be. . . SCC-76 . Annual . Meeting. . Pensacola, 30 March - 01 April 2017. Matthias . Buchholz & Oliver . Musshoff. Department of Agricultural Economics . and. Rural Development University of . Goettingen. Assistant Professor & Extension Economist. Agricultural Policy. Oklahoma State University. September 13, 2011. Drought Assistance. CRP Emergency Haying/Grazing. Disaster Programs. Emergency Loans. Biodiversity Conservation:. The Case of Hornbills. in Southern Thailand. Pin Chantarat, . Chris . Barrett. . Tavan. . Janvilisri, . Chularat. Niratisayakul. , . Sittichai. . Mudsri. and . Pilai. . Preliminary Findings on the Positive Impacts of An Imperfect Product. Christopher B. Barrett, Cornell University. International Livestock Research Institute, Nairobi, Kenya. July 3, 2014. Motivation: . Amy Hagerman. State Specialist in Agricultural and Food . Policy. January . 22. , . 2019. 1. Email: amy.hagerman@okstate.edu. Phone: 405-744-9811. Visit us online . at: . agecon.okstate.edu/. agpolicy. strengths-based . questions . September 2018. Before you start…. To ensure that you understand this new method of assessing . candidates, please . make sure you have completed the . Success Profiles . Mark . Fendrick, MD. University of Michigan Center for . Value-Based Insurance Design. www.vbidcenter.org. amfen@umich.edu. @um_vbid. 1. Value. -Based Insurance Design . Background . Federal and State Policy Efforts. under CCAP A feasibility study Mangesh Patankar, Microinsurance Fellow at Philippines Crop Insurance Corporation AbbreviationsANTRECCOAgusan del Norte Teachers Retirees Communities CooperativeCARDCen 8-RIVI of 18-RIVI ��2 of creditors or other persons towhom you have a financial debt or other pecuniary obligation. Beginning farmer or rancher means an individual who has not a 1KNOWLEDGE ATTITUDES AND WILLINGNESS TOPAY FOR WEATHER INDEX BASED CROP INSURANCEIN QUEZON PROVINCE PHILIPPINESAileen Lapitan1IIntroductionThe Philippines is among the countries in which the impacts o
Download Document
Here is the link to download the presentation.
"Designing index-based insurance for livestock"The content belongs to its owner. You may download and print it for personal use, without modification, and keep all copyright notices. By downloading, you agree to these terms.
Related Documents