/
Education blogosphere survey Education blogosphere survey

Education blogosphere survey - PowerPoint Presentation

liane-varnes
liane-varnes . @liane-varnes
Follow
392 views
Uploaded On 2017-10-15

Education blogosphere survey - PPT Presentation

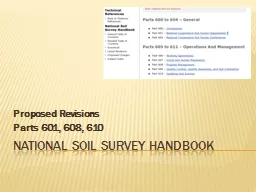
Dr Scott McLeod dangerouslyirrelevant org data collected January 2008 data reported October 2008 wwwflickrcomphotosauthentiqone2516909291 Do you blog as part of your job NO ID: 596068

photos flickr respondents www flickr photos www respondents age ideas median lack audience chance blogging blog teachers learning select

Share:

Link:

Embed:

Download Presentation from below link

Download Presentation The PPT/PDF document "Education blogosphere survey" is the property of its rightful owner. Permission is granted to download and print the materials on this web site for personal, non-commercial use only, and to display it on your personal computer provided you do not modify the materials and that you retain all copyright notices contained in the materials. By downloading content from our website, you accept the terms of this agreement.


Presentation Transcript

Slide1

Education blogosphere survey

Dr. Scott McLeoddangerouslyirrelevant.org

data collected

January 2008

data reported

October 2008Slide2

www.flickr.com/photos/authentiqone/2516909291Slide3

Do you blog

as part of your job?

NO

47%

YES

53%

www.flickr.com/photos/semperfelix/370610248Slide4

Which audience(s) does your

blog primarily target?

(check all that apply)

Teachers

Technology

coordinators /

integrationists

Students

Administrators

Parents

Other

No one

except

myself

Policy-

makers

Librarians

/ media

specialistsSlide5

minutes

per weekspentblogging

(median)

www.flickr.com/photos/shashachu/270424315Slide6

What are the primary reasons you blog?

(please select up to 3)

Responses

PERSONAL LEARNING / GROWTH

new

information, new perspectives, learning

network

248

THE CHANCE TO THINK

thinking

through ideas, reflection,

rumination

187

A VOICE / AUDIENCE / CHANCE TO SHARE

expressing

ideas, someone is listening, reaching a wider

audience

161

COMMUNITY / CONNECTION / INTERACTION

conversation

, discussion, new friends, peer group,

support

159

CAPTURING IDEAS / RESOURCES FOR LATER

summarizing

, organizing, creating a record, documenting,

archiving

110

SENSE OF HELPING OTHERS

contributing

value, greater good,

mentoring

96

KEEPS ME CURRENT / UP-TO-DATE

new

tools and resources, discovery, staying

fresh

74

CHANCE TO TRY THINGS OUT

experiment

, explore, try

things

50

THE OPPORTUNITY TO HEAR BACK

testing

ideas, feedback,

validation

48

IT'S REWARDING / GRATIFYING

receive

praise, self-satisfaction, feeling of

accomplishment

21

OTHER

20Slide7

1

3

4

6

7

8

9

2

5

10

11

Technorati

authority

(median)

www.flickr.com/photos/bobasonic/170043435Slide8

median number of subscribers

www.flickr.com/photos/ggerome/247720234Slide9

.

Correlation

Technorati

authority

&

number of subscribers

www.flickr.com/photos/svenwerk/369136782Slide10

Lack of time

to write

Lack of time

to read

Lack of

confidence

Lack of

readership

Need to be

careful / safe

Finding

new ideas

Unsure

about

purpose

Filtering /

other

roadblocks

Writing or

technical

mechanics

Other

What’s the most difficult thing for you about blogging?

(please select up to 3)Slide11

P

E

R

C

E

N

T

R

U

N

A

D

S

O

N

T

H

E

I

R

B

L

O

G

S

www.flickr.com/photos/bip/2274034194Slide12

In 2007, approximately how many

educators did you influence…

to begin

reading

blogs?

to begin

blogging

themselves?Slide13

People in your

organizationwho activelyread or writefor blogs

(median percentage)

www.flickr.com/photos/svenwerk/369136782Slide14

How many

feeds are in your

aggregator?

Mean = 92

Median = 50

Max = 848Slide15

More

informationabout the

participants

www.flickr.com/photos/psoup216/1443767349Slide16

48%

girls

52%

boys

www.flickr.com/photos/38071164@N00/367688798Slide17

The unbearable whiteness

of blogging

(cf. Milan

Kundera

)Slide18

Age 10-19

1 respondent

Age 20-29

36 respondents

Age 30-39

99 respondents

Age 40-49

84 respondents

Age 50-59

51 respondents

Age 60-69

8 respondentsSlide19

Respondents

(worldwide)Slide20

(yes, I forgot to take my own survey)

Respondents

(continental U.S.)Slide21

At what level

do you work? Slide22

What is your

primary

vocation?Slide23

What subject

do you teach?

(teachers only)

Technical arts (business, home econ, tech, etc.)

Science

Other

Social studies

Special education

Fine arts

ESL / ELL / bilingualSlide24

Thank you!

I couldn’t do this without you!

www.flickr.com/photos/boriskramaric/2656140464Slide25

Music credits

InertiaThe Hustlers

www.flickr.com/photos/brianauer/2027646283