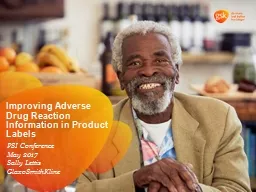
PSI Conference May 2017 Sally Lettis GlaxoSmithKline The views and opinions expressed in the following slides are those of the individual presenter and should not be attributed to any organization with which the presenter is employed or affiliated ID: 740421
Download Presentation The PPT/PDF document "Improving Adverse Drug Reaction Informat..." is the property of its rightful owner. Permission is granted to download and print the materials on this web site for personal, non-commercial use only, and to display it on your personal computer provided you do not modify the materials and that you retain all copyright notices contained in the materials. By downloading content from our website, you accept the terms of this agreement.
Slide1
Improving Adverse Drug Reaction Information in Product Labels
PSI Conference
May 2017
Sally Lettis GlaxoSmithKlineSlide2
The
views and opinions expressed in the following
slides are those of the individual presenter and should not be attributed to any organization with which the presenter is employed or affiliated.
DisclaimerSlide3Slide4
Outline
Current Labelling Practice
Current Labelling LimitationsThe problem to solveThe proposed solution
Presentation title
4Slide5
Current Labelling Practice
Product labels are intended to provide health care professionals with clear and concise prescribing information that will enhance the safe and effective use of drug products.
Presentation title
5Slide6
Current Labelling Practice: US Product Label
Quantitative approach used in the Adverse Reactions section
Incidence of ‘‘common’’ ADRs presentedCommon defined as an ADR that occurs at or above a specified incidence e.g. >=3%A comparator must be provided, except in exceptional circumstances.
Typically, a single ADR table is included; however, more than 1 can be included when the ADR profile differs substantially from one setting or population to another
Presentation title
6Slide7
Current Labelling Practice: EU SPc
ADRs (from RCTs) placed into frequency categories
Convention for classification: very common (1/10), common (1/100 to <1/10), uncommon (1/1,000 to <1/100), rare (1/10,000 to <1/1,000), and very rare (<1/10,000); (CIOMS III and V)
Comparator typically not included
Category based on crude incidence on drug. Studies included don’t need common comparator
For drugs for long-term use, there is no representative duration; in practice, studies of differing durations are combined together
Only in exceptional cases is more than 1 table included for different populations
Presentation title
7Slide8
Current Labelling Limitations: The issue with no comparator data in label
In label it is an ADR and is common
Heterogeneity? Appropriate to combine? Helpful for patient?If two similar drugs tested in different populations very different incidences with no comparator data to contextualise
Presentation title
8
Disease
Severity
Duration
Incidence on drug
Category
Incidence
on Comparator
X
Moderate
3
months
0.6%
Uncommon
-
X
Moderate
6 months
1.5%
Common
1.7%
X
Severe
12 months
6.3%
Common
3.3%
X
Pooled
3.0%
Common
2.6%
Y
Pooled
0.5%
Uncommon
-
X+Y
Pooled
1.0%
Common
-Slide9
Data presented is based on crude pooling of data across multiple studies: pooling data as if from a single study
Can lead to “Simpson’s Paradox”:
When studies combined, trend seen in the individual studies either disappears or is reversed
Why? Can result in an overall baseline risk that is different among treatment groups due to differing randomization allocations within a study and different study populations across studies
Differences that could affect the incidence include age, sex, race, medical practice, differing time on study
Common for reporting proportions with an ADR in labels
Not a new issue (
Chuang-Stein and
Beltangady
(2010))
E.g. Cochran-Mantel-
Haenszel
to produce a common odds ratio across strata
If used, applied in Integrated Summaries of Safety
Too complicated for Product Labels which revert to crude incidences
Current Labelling Limitations:
The issue with crude poolingSlide10
New treatment,
n/N (%)
Placebo,
n/N
(%)
Total patients in study
Phase 2 study
30/300
(10%)
10/100
(10%)
400
Phase 3 study
133/700
(19%)
67/350
(19%)
1050
Phase 3 study in refractory patients
200/500
(40%)
200/500
(40%)
1000
Incidence
proportion:
crude pooling
363/1500
(24%)
277/950
(29%)
2450
Current
Labelling Limitations: Example showing misleading incidence proportion from crude pooling
N = total number of patients in the group; n = the number in the group that experienced the event
The last row gives the impression the new drug has a beneficial effect, though the AE incidences are equal in each study.
If you were to do a statistical test -> p=0.007Slide11
New treatment,
n/N (%)
Placebo,
n/N
(%)
Total patients in study
Allocation
Ratio
Phase 2 study
30/300
(10%)
10/100
(10%)
400
3:1
Phase 3 study
133/700
(19%)
67/350
(19%)
1050
2:1
Phase 3 study in refractory patients
200/500
(40%)
200/500
(40%)
1000
1:1
Incidence
proportion: crude pooling
363/1500
(24%)
277/950
(29%)
2450
Current
Labelling
Limitations:Why did crude pooling go wrong?
N = total number of patients in the group; n = the number in the group that experienced the event
Studies with uniformly lower ADR proportions (e.g. Phase 2) have more subjects on new treatment than placeboSlide12
The problem to solve: So what do we do?
16Aug2016
CBI’s Pharmacovigilance Final Rule Summit on IND 2016
12
We can see what the issue is
How should we present adjusted proportions?
Conclusions from crude pooling misleading
Meta-analytic techniques:
e.g. Cochran-Mantel-
Haenszel
weights
Not easy for non-statistician to understandSlide13
New treatment,
n/N (%)
Placebo,
n/N
(%)
Total patients in study
Proportion
of total patients in study
Phase 2 study
30/300
(10%)
10/100
(10%)
400
w
1
=
400/2450 (16%)
Phase 3 study
133/700
(19%)
67/350
(19%)
1050
w
2
=
1050/2450
(43%)
Phase 3 study in refractory patients
200/500
(40%)
200/500
(40%)
1000w3 = 1000/2450
(41%)Incidence proportion from crude pooling
363/1500 (24%)
277/950
(29%)2450
The Proposed Solution: A better way to go
Study-size Adjusted PercentagesSlide14
New treatment,
n/N (%)
Placebo,
n/N
(%)
Total patients in study
Proportion
of total patients in study
Phase 2 study
30/300
(10%)
10/100
(10%)
400
w
1
=
400/2450 (16%)
Phase 3 study
133/700
(19%)
67/350
(19%)
1050
w
2
=
1050/2450
(43%)
Phase 3 study in refractory patients
200/500
(40%)
200/500
(40%)
1000w3 =
1000/2450(41%)Incidence proportion from crude pooling
363/1500 (24%)
277/950
(29%)2450
Study-size-adjusted
incidence proportions
w
1
x
(30/300)
+
w
2
x (133/700) + w3 x (200/500) = 26%w1 x (10/100) +w2 x (67/350) + w3 x (200/500) = 26%
The Proposed Solution: A better way to go
Study-size Adjusted PercentagesSlide15
Comparison of Weights for New Treatment
New treatment
n/N (%)
Study Size
Weights
in Crude Pooling =
Proportion of total patients on
new drug
Weights in Study sized pooling = Proportion of patients in study
Weights
using CMH
a
j
= (n
1j
n
2j
)/ (n
1j
+n
2j
)
Study 1
30/300 (10%)
400
w
1
=
300/1500
20%
w
1
=
400/2450
16%
w1 = a1
/aj13%
Study 2133/700 (19%)1050
w
2
= 700/1500 47%
w2 =
1050/2450
43%
w
2
=
a
2
/
aj42%Study 3200/500 (40%)1000w3 = 500/1500 33%w3 = 1000/2450 41%w3 = a3/a
j
45%
N15002450w1 x (30/300) + w2 x (133/700) + w3 x (200/500) = 24%w1 x (30/300) + w2 x (133/700) + w3 x (200/500) = 26%w1 x (30/300) + w2 x (133/700) + w3 x (200/500) = 27%
15
Study Adjusted Size and CMH weights same for each treatment; Crude pooling weights are notSlide16
Comparison of Weights for Placebo
Placebo
n/N (%)
Study Size
Weights
in Crude Pooling =
Proportion of total patients on
placebo
Weights in Study sized pooling = Proportion of patients in study
Weights
using CMH
a
j
= (n
1j
n
2j
)/ (n
1j
+n
2j
)
Study 1
10/100 (10%)
400
w
1
=
100/950
11%
w
1
=
400/2450
16%
w1 = a1/a
j13%Study 267/350 (19%)
1050w2
=
350/950
37%w2
= 1050/2450 43%
w
2
=
a
2
/
a
j
42%Study 3200/500 (40%)1000w3 = 500/950 53%w3 = 1000/2450 41%w3 = a3/aj45%
N
950
2450w1 x (10/300) + w2 x (67/350) + w3 x (200/500) = 29%w1 x (10/100) + w2 x (67/350) + w3 x (200/500) = 26%w1 x (10/100) + w2 x (67/350) + w3 x
(200/500) =
27%
16
Study Adjusted Size and CMH weights same for each treatment; Crude pooling weights are notSlide17
Current labelling limitations: The Issue with “Rule of 3”
If ADR not observed in clinical trials but determined to be causally related post authorization based on spontaneous reports, ‘‘Rule of 3’’ used to estimate category using sample sizes from clinical trials
If X is number of patients exposed to drug in all relevant clinical trials, then frequency category would be 3/X, the upper limit of a 95% CI for the true incidence proportion of the event in question
This method estimates the incidence proportion by the upper end of a range of plausible values for the incidence proportion.
By doing so, ADRs that were never reported in clinical trials can be assigned to a frequency category that is higher than the category for ADRs that were reported in clinical trials.
Anomalies arise when AE was observed in clinical trials at same or lower incidence than placebo and so not considered ADR. Subsequently included as ADR based on spontaneous reports. Frequency?
Presentation title
17Slide18
That product labels that include comparator data be changed to include adjusted incidence proportions (or rates) when needed for adverse drug reactions (ADR) that are somewhat common.
Product labels better reflect the risk of a drug relative to a comparator
Not needed if:
The ratio of patients receiving the new drug to that receiving the comparator is approximately the same across all the studies included or
Incidences of AEs in the comparator group are nearly the same across the studies
If crude pooling be sure to look at the individual study results to check that pooled results are consistent with the individual studies
Including comparator incidence in product labels gives health care providers and patients appropriate information to put the absolute risks in perspective
Recommendations Slide19
References
Crowe, B., Chuang-Stein, C.,
Lettis, S., & Brueckner, A. (2016). Reporting Adverse Drug Reactions in Product Labels.
Therapeutic Innovation & Regulatory Science
, 50(4), 455-463
.
Chuang-Stein, C., and
Beltangady
, M. (2010). Reporting Cumulative Proportion of Subjects With an Adverse Event Based on Data From Multiple Studies.
Pharmaceutical Statistics, 10, 3–7.
16Aug2016
CBI’s Pharmacovigilance Final Rule Summit on IND 2016
19