/
Stratospheric Circulation Changes Associated with the Stratospheric Circulation Changes Associated with the

Stratospheric Circulation Changes Associated with the - PowerPoint Presentation

linda
linda . @linda
Follow
27 views
Uploaded On 2024-02-02

Stratospheric Circulation Changes Associated with the - PPT Presentation

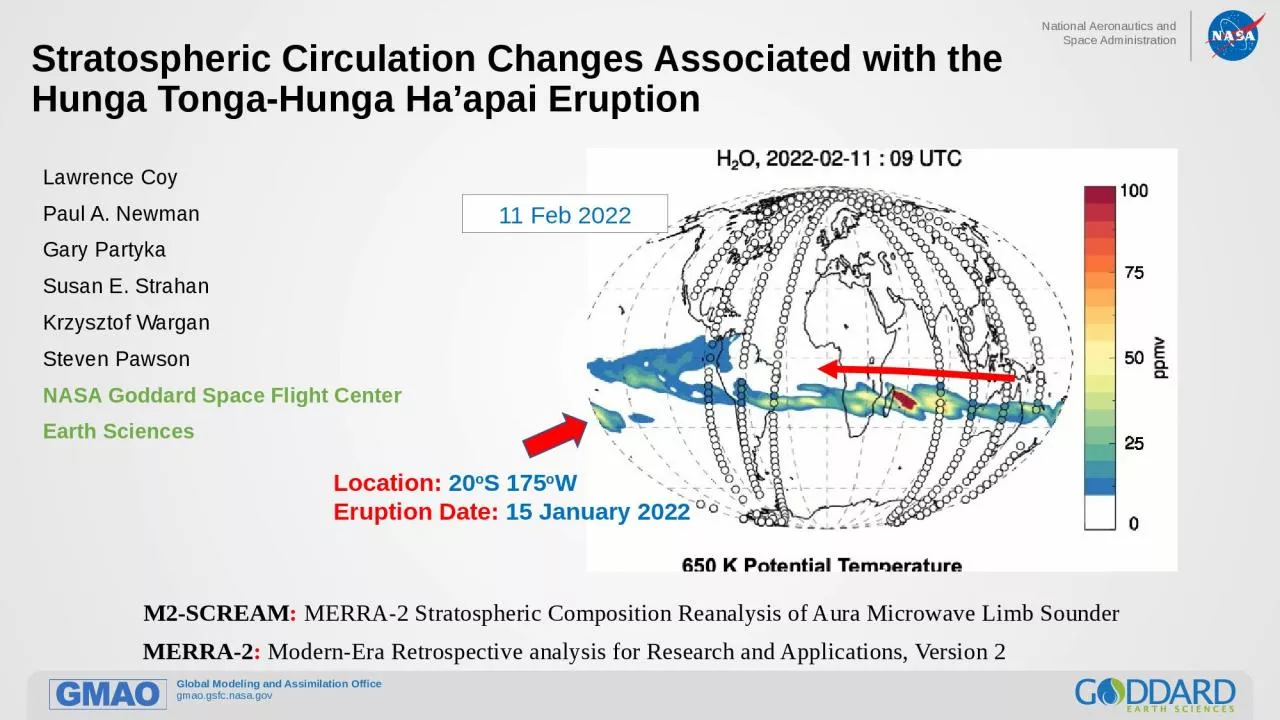
Hunga Tonga Hunga Haapai Eruption Lawrence Coy Paul A Newman Gary Partyka Susan E Strahan Krzysztof Wargan Steven Pawson NASA Goddard Space Flight Center Earth Sciences MERRA2 ID: 1043602

circulation merra 2021 1980 merra circulation 1980 2021 water vapor nwrt s30 km90 km48 2022 standard hunga edge16 records

Share:

Link:

Embed:

Download Presentation from below link

Download Presentation The PPT/PDF document "Stratospheric Circulation Changes Associ..." is the property of its rightful owner. Permission is granted to download and print the materials on this web site for personal, non-commercial use only, and to display it on your personal computer provided you do not modify the materials and that you retain all copyright notices contained in the materials. By downloading content from our website, you accept the terms of this agreement.


Presentation Transcript

1. Stratospheric Circulation Changes Associated with the Hunga Tonga-Hunga Ha’apai EruptionLawrence Coy Paul A. NewmanGary PartykaSusan E. StrahanKrzysztof WarganSteven PawsonNASA Goddard Space Flight Center Earth SciencesMERRA-2: Modern-Era Retrospective analysis for Research and Applications, Version 2M2-SCREAM: MERRA-2 Stratospheric Composition Reanalysis of Aura Microwave Limb SounderLocation: 20oS 175oWEruption Date: 15 January 202211 Feb 2022

2. Stratospheric Circulation Changes Associated with the Hunga Tonga-Hunga Ha’apai EruptionOutline:The data going into MERRA-2 can capture the effects of the Tonga water vapor, even though MERRA-2 physics does not include the water vapor perturbationEvaluation of the changes in the MERRA-2 winds, temperatures, and circulations associated with the Tonga water vapor perturbationMERRA-2: Modern-Era Retrospective analysis for Research and Applications, Version 2M2-SCREAM: MERRA-2 Stratospheric Composition Reanalysis of Aura Microwave Limb SounderLocation: 20oS 175oWEruption Date: 15 January 202211 Feb 2022

3. Water vapor from eruption spreads around the globeSpecial M2-SCREAM assimilates the MLS water vapor measurements. K. Wargan, 2022650 K Potential Temperature Surface ~26 kmNote: Standard GMAO assimilation products do not assimilation middle atmosphere water vapor.Location: 20oS 175oWEruption Date: 15 January 2022

4. MERRA-2: unusually low global temperatures at 20 hPa Global Mean Temperature20 hPa (~27 km)MERRA-2Monthly Averaged202242 Years: 1980-20211 K2022 global temperatures at 20 hPa were much lower than in past years

5. Missing water vapor cooling in 2022 created extreme temperature increments at 20 hPaGlobal Mean Temperature Increments20 hPa (~27 km)MERRA-2Monthly Averaged202242 Years: 1980-20211 K/month0-112-2-3-4T Increments (K/month)

6. Data analysis generated tendencies can capture missing radiative effects Thermodynamic EquationDT/dt=Dynamics Tendency+Radiative Tendency+Data Analysis TendencyAlso known as incrementsCorrected Radiative TendencyHorizonal and vertical advection

7. MERRA-2 data analysis increments capture the perturbed water vapor cooling.Southern HemisphereMean Temperature Increments20 hPa (~27 km)Monthly Averaged20224 K/month010-10T Increments (K/month)M2-SCREAMM2-SCREAM Increments near zeroStrong radiative cooling MERRA-2 Increments largeSum is strongly cooling

8. Record low temperature and strong winds were seen in June 2022Volcano20 hPaExceed Cold Records by -3KExceed Strong Wind Records by 10 m/sNote: Records are outside of the SH polar vortexVortex Edge16 km48 km90 S30 NWRT 1980-2021 MERRA-2

9. Temperatures were more than 3 standard deviations below the meanWinds were more than 3 standard deviations above the meanVolcano20 hPaTemperature-2 and -3 contoursWind2 and 3 contoursVortex Edge16 km48 km90 S30 NWRT 1980-2021 MERRA-2June 2022

10. The residual mean stream function was greatly distorted in June 2022Volcano20 hPaGray1980-2021 AverageBlack2022Vortex Edge16 km48 km90 S30 NWRT 1980-2021 MERRA-2June 2022

11. The residual circulation had a record strong anomaly near the volcano locationVolcano20 hPaResidual Circulation Record Maximum AnomalyVortex Edge16 km48 km90 S30 NWRT 1980-2021 MERRA-2June 2022

12. Vertical residual circulation anomaly was more than 2 standard deviations above the meanMeridional residual circulation anomaly was more than 3 standard deviations below the meanVolcano20 hPaVortex EdgeVertical Wind2 contourMeridional Wind-2 and -3 contours16 km48 km90 S30 NWRT 1980-2021 MERRA-2June 2022

13. Clockwise circulation anomaly is centered in the lower stratosphere during June 2022Clockwise Residual Circulation AnomalyVertical Wind2 contourMeridional Wind-2 and -3 contoursVolcano20 hPa16 km48 km90 S30 NWRT 1980-2021 MERRA-2

14. Clockwise circulation anomaly extends to higher altitudes during July 2022Clockwise Residual Circulation AnomalyVertical Wind2 contourMeridional Wind-2 and -3 contoursVolcano20 hPa16 km48 km90 S30 NWRT 1980-2021 MERRA-2

15. Record low temperatures and strong winds descended in October 2022Volcano20 hPaExceed Cold Records by -2KExceed Strong Wind Records by less than 5 m/sVortex Edge16 km48 km90 S30 NWRT 1980-2021 MERRA-2Record Cold in polar upper stratosphere

16. Temperatures were more than 3 standard deviations below the meanWinds were more than 3 standard deviations above the meanVolcano20 hPaVortex Edge16 km48 km90 S30 NWRT 1980-2021 MERRA-2October 2022Exceed Cold Records by -3 standard deviationsExceed Strong Wind Records by 3 standard deviationsCold in polar upper stratosphere

17. The residual circulation record anomaly descends with timeVolcano20 hPaResidual Circulation Record Maximum AnomalyVortex Edge16 km48 km90 S30 NWRT 1980-2021 MERRA-2October 2022

18. Low ozone is associated with the upward circulation anomalyVolcano20 hPaOzone anomaliesStandard deviationsVortex Edge16 km48 km90 S30 NWRT 1980-2021 MERRA-2October 2022Ozone-2 and -3 contoursOzone2 and 3 contours

19. ConclusionsData assimilation can provide assessment of model biases and even missing model physics, such as the anomalous water vapor.Water vapor from the Hunga-Tonga Hunga Ha-apai eruption disrupted the global middle atmosphere circulation for at least 10 months and is expected to continue for years.Future ensemble forecast experiments will include the anomalous water vapor.Reference: Coy, L., Newman, P. A., Wargan, K., Partyka, G., Strahan, S. E., & Pawson, S. (2022). Stratospheric circulation changes associated with the Hunga Tonga-Hunga Ha'apai eruption. Geophysical Research Letters, 49, e2022GL100982. https://doi.org/10.1029/2022GL100982