/
1 Preservation of HOPE Scholarship Program 1 Preservation of HOPE Scholarship Program

1 Preservation of HOPE Scholarship Program - PowerPoint Presentation

lindy-dunigan
lindy-dunigan . @lindy-dunigan
Follow
395 views
Uploaded On 2017-05-14

1 Preservation of HOPE Scholarship Program - PPT Presentation

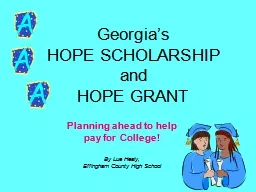
Joint House amp Senate Study Committee Debbie Alford CEOPresident September 14 2015 Nov 1992 Georgia voters approve a constitutional amendment to create the Georgia Lottery first ticket sales began on June 29 1993 ID: 548345

profit 000 coam lottery 000 profit lottery coam glc thousands georgia sales 2015 net 600 800 expenses cap 500 data operating total

Share:

Link:

Embed:

Download Presentation from below link

Download Presentation The PPT/PDF document "1 Preservation of HOPE Scholarship Progr..." is the property of its rightful owner. Permission is granted to download and print the materials on this web site for personal, non-commercial use only, and to display it on your personal computer provided you do not modify the materials and that you retain all copyright notices contained in the materials. By downloading content from our website, you accept the terms of this agreement.


Presentation Transcript

Slide1

1

Preservation of HOPE Scholarship Program

Joint House & Senate Study

CommitteeDebbie AlfordCEO/PresidentSeptember 14, 2015Slide2

Nov. 1992 - Georgia voters approve a constitutional amendment to create the Georgia Lottery; first ticket sales began on June 29, 199336th lottery in the United States; now 44 + DC

GLC is established as a body corporate and politic which shall be deemed to be an instrumentality of the state and a public corporation OCGA 50-27-4Net proceeds of lottery games shall be used to support improvements and enhancements for educational purposes and programs and that such net proceeds shall be used to supplement, not supplant, existing resources for educational purposes and programs

The GLC is governed by a Board of Directors composed of seven members appointed by the Governor and approved by the State SenateLegislative Oversight Committees: House Regulated Industries/Senate Economic DevelopmentReceives no state appropriations; operating dollars come from revenues; currently operate at 10.5% of net revenuesGLC transfers profit to the state treasury quarterly; does not administer the Lottery for Education Account or reserve funds In 2013, HB 487 transferred regulatory oversight of COAM’s (coin operated amusement machines) in Georgia to the GLC2 Georgia Lottery Corporation (GLC)Slide3

On average, the GLC raises approximately $2.7 Million every day for Georgia’s HOPE & Pre-K Programs

To date, the GLC has raised more than $16.5 Billion for educationMore than 1.7 Million students have attended college on a HOPE Scholarship or Grant

More than 1.4 Million four-year-olds have attended a lottery-funded Pre-K Program 3 Students BenefitSlide4

$138 $43 $38 -$26 $91 $37 $8 $35 $25 $31 $20 $20 $31 $14 $5 $11 -$37 $ 55 $26 $18 $35

$ Change YOY

4

$ in

millions

Over $16.5 Billion Returned to EducationSlide5

5

GLC Transfer to Lottery For Education

($ in Thousands)Slide6

Worldwide Rankings #17 total sales

#5 total per cap sales #10 instant sales #2 instant per cap sales

Source - LaFleur’s 2015 World Lottery AlmanacNational Rankings #2 total per cap sales #2 instant per cap sales #4 per cap returns to beneficiaries Source- LaFleur’s Magazine (September/October 2014)6Worldwide and National Lottery Rankings Slide7

7

FY 2015 Top Profit

per Capita (PPC) Lotteries($ in Thousands)Lottery Began

YearsPopulationNet SalesProfitProfit Per Cap Massachusetts197243 6,750 $5,011,000$983,500

$145.70

New York

1967

48

19,750

$7,251,000

$2,203,000

$111.54

Georgia

1993

22

10,100

$3,908,000

$969,600

$96.00

Connecticut

1972

43

3,600

$1,144,000

$319,700

$88.81

Maryland

1973

42

5,980

$1,762,000

$525,000

$87.79

Pennsylvania

1972

43

12,790

$3,820,000

$1,061,000

$82.96

Michigan

1972

43

9,910

$2,728,000

$762,800

$76.97

Florida

1988

27

19,890

$5,580,000

$1,500,000

$75.41

South Carolina

2002

13

4,830

$1,405,000

$349,000

$72.26

Virginia

1988

27

8,330

$1,844,000

$533,800

$64.08

New Jersey

*

1970

45

8,940

$3,001,000

N/A

N/A

NOTE:

Population data

obtained from

2014 U.S

Census (rounded)

. FY15 sales and profit data obtained

directly from specific lotteries.

*

FY15 actual profit unavailable at this time. FY14 profit per cap was $107.94.Slide8

8

Top PPC Lotteries

YOY $ Change($ in Thousands)

YOYLotteryFY14*FY15**$ Change% Change

South Carolina

$330,700

$349,000

$18,300

5.5%

Georgia

$940,097

$969,600

$29,503

3.1%

Michigan

$746,820

$762,800

$15,980

2.1%

Massachusetts

$974,560

$983,500

$8,940

0.9%

Maryland

$521,100

$525,000

$3,900

0.7%

Florida

$1,495,000

$1,500,000

$5,000

0.3%

Connecticut

$319,500

$319,700

$200

0.1%

Virginia

$538,600

$533,800

($4,800)

(0.9%)

Pennsylvania

$1,079,600

$1,061,000

($18,600)

(1.7%)

New York

$2,302,760

$2,200,000

($102,760)

(4.5%)

New Jersey

$965,010

N/A

N/A

N/A

*Based on data obtained from La

Fleur's 2015 World Lottery Almanac except for Connecticut, Maryland, and New York which came from their financial statements.** Unaudited FY15 data received directly from the specific lottery.Slide9

9

FY 2015 Top Lotteries Based on $ Profit

($ in Thousands)Lottery BeganYears

PopulationNet SalesProfitProfit Per Cap New York196748 19,750 $7,251,000$2,203,000

$111.54

Florida

1988

27

19,890

$5,580,000

$1,500,000

$75.41

California

1985

30

38,800

$5,500,000

$1,350,000

$34.79

Texas

1992

23

26,960

$4,529,700

$1,242,702

$46.09

Pennsylvania

1972

43

12,790

$3,820,000

$1,061,000

$82.96

Massachusetts

1972

43

6,750

$5,011,000

$983,500

$145.70

Georgia

1993

22

10,100

$3,908,000

$969,600

$96.00

Michigan

1972

43

9,910

$2,728,000

$762,800

$76.97

Ohio

1974

41

11,600

$2,743,100

$739,900

$63.78Virginia198827 8,330 $1,844,000$533,800$64.08Maryland

1973

42

5,980

$1,762,000

$525,000

$87.79

Illinois

*

1974

41

12,880

N/A

N/A

N/A

New Jersey

*

1970

45

8,940

$3,001,000

N/A

N/A

NOTE:

Population data obtained from 2014 U.S Census (rounded).

*

FY15 actual profit unavailable at this time. Illinois FY14 profit was $742M. New Jersey FY14

profit was $965M.Slide10

10

Top Lotteries Based on $ Profit

Comparison of Change in Profit YOY

LotteryFY14*FY15**$ Change

% Change

Georgia

$940,097

$969,600

$29,503

3.1%

Michigan

$746,820

$762,800

$15,980

2.1%

Texas

$1,220,720

$1,242,702

$21,982

1.8%

California

$1,328,000

$1,350,000

$22,000

1.7%

Massachusetts

$974,560

$983,500

$8,940

0.9%

Maryland

$521,100

$525,000

$3,900

0.7%

Florida

$1,495,000

$1,500,000

$5,000

0.3%

Virginia

$538,600

$533,800

($4,800)

(0.9%)

Pennsylvania

$1,079,600

$1,061,000

($18,600)

(1.7%)

Ohio

$764,900

$739,900

($25,000)

(3.3%)

New York

$2,302,760

$2,200,000

($102,760)

(4.5%)

Illinois$741,900N/AN/AN/ANew Jersey$965,010N/AN/AN/A

*Based on data obtained from La

Fleur's

2015 World Lottery Almanac, except for Maryland and New York which came from their financial statements.

**Based on unaudited data obtained from specific lotteries.

($ in Thousands)Slide11

11

(All figures in

Thousands except for PPC)FY 2015 Southeast Region PPC & $ ProfitLottery

BeganYearsPopulationNet RevenueProfitProfit Per Cap SE Rank in Total $ Profit

Georgia

1993

22

10,100

$3,908,000

$969,600

$96.00

2

Florida

1988

27

19,890

$5,580,000

$1,500,000

$75.41

1

South Carolina

2002

13

4,830

$1,405,000

$349,000

$72.26

5

Virginia

1988

27

8,330

$1,844,000

$533,800

$64.08

3

Kentucky

1989

26

4,410

$886,930

$236,101

$53.54

7

Tennessee

2004

11

6,550

$1,373,000

$347,785

$53.10

6

North Carolina

2006

9

9,940

$1,970,000

$522,000

$52.52

4

Louisiana199124 4,650 $453,800 $167,000 $35.91 8

NOTE:

Population data

obtained from

2014 U.S Census data.Slide12

12

Southeast Region

Comparison of Change in Profit($ in Thousands)Slide13

13

Who Plays the Lottery

The demographic profile of who has ever played the Georgia Lottery reflects the U.S. Census Bureau’s data of Georgia’s population regarding gender, ethnicity and income. Of those Georgians who have ever played the Georgia Lottery:Approximately half are male and half are femaleApproximately half are under the age of 45Approximately half are marriedApproximately half are CaucasianApproximately half have an annual household income of $50,000 or more (source: 2012 Bantam Group)Slide14

14

Jackpot Games

: Mega Millions

Powerball Jumbo Bucks LottoDaily Games: Fantasy 5 Cash 3 Cash 4 Georgia FIVE All or Nothing KENO!

Games: $1, $2, $3, $5, $10, $20, $30

.

Diggi

Games

Our Products

Class A

:

kiddie rides, arcade games, juke boxes, pool tables, claw

machines

Class B

:

line-up, match-up video games with some skill (points carry over

)Slide15

15

Georgia Lottery Corporation

P&L Statements FY2011 – FY2015 (Traditional Lottery)

($ in Thousands)Slide16

16

$3.3B

$3.6B$3.6B$3.7B$3.9B

67.4%67.4%67.2%67.8%68.4%32.6%32.6%

32.8%

32.2%

31.6

%

GLC Net Revenue & Product Mix

($ in Thousands)Slide17

17

Profit Margin = 36.1%

Profit Return = $500,428,000Prize Payout % = 50.5%Profit Margin = 24.8%Profit Return = $969,581,000Prize Payout % = 64.7%GLC Product MixSlide18

18

Profit Margin 30.4%

Profit Per Cap = $111.54Payout = 60.6%Profit Margin = 24.8%Profit Per Cap = $96.00Payout = 64.7%GLC Product Mix vs. New York LotterySlide19

19

Existing Georgia

Mix

Net RevenueProfitScratcher68.4%$2,594,399$461,301Draw

31.6%

$1,313,547

$508,280

Total Net Revenue

$3,907,946

$969,581

Recalculated Georgia based on NY Product Mix

NY Mix

Net Revenue

Profit

Scratcher

50.3%

$1,965,697

$349,514

Draw

49.7%

$1,942,249

$751,558

Total Net Revenue

$3,907,946

$1,101,071

Incremental Profit

$131,490

Revised Profit Margin

28.2%

GLC – Recalculated Based on

New York’s FY 2015 Product Mix

($ in Thousands)Slide20

20

GLC Tickets Provided as Prizes

($ in Thousands)Slide21

21

GLC Prize Expense

($ in Thousands)Slide22

22

Where We Sell

Approximately 8,700 RetailersGLC Direct Sales (Airport Baggage Claim, 8 District Offices, Headquarters)Internet Sales ($25m FY2015) Top performing retail outlets located along state borders and Hartsfield-Jackson International AirportSlide23

Independent vs Corporate Retailers

23

76% of GLC Retailers are small businesses Sales by Trade Style

Retailer Trade StylesSlide24

24

Top PPC Lotteries –

FY 2014 Retailer ProductivitySlide25

25

Southeast Region

FY 2014 Retailer Productivity Slide26

26

GLC Operating Expenses –

Retailer Commissions

($ in Thousands)Slide27

27

*Source La

Fleur’s 2015 World Almanac Lottery Retailer CommissionsSlide28

28

GLC Operating Expenses – Vendor Fees

($ in Thousands)Slide29

Employee tenure 65% over 6 years of service

Almost 50% over 10 years of service Approximately 17% over 20 years of serviceEmployee turnover rate

FY11 – 4.5% FY12 – 5.6% FY13 – 4.5% FY14 – 6.0% FY15 – 7.3%29Our EmployeesSlide30

Georgia Lottery Employees - Ethnic Diversity

30

Of the 13 individuals that comprise the GLC’s senior management team, six are minorities and four are women.*source: Georgia Lottery Minority Business Participation Report (Dec. 1, 2014)

Georgia Lottery Employees - Gender BreakdownOur EmployeesSlide31

31

# of GLC Employees

  286 287 284

288 291 298 # of COAM Employees - - -

11

29

Total Employees


286

287

284

288

302

327

GLC Operating Expenses – Salaries

Total Salary and Headcount

($ in Thousands)Slide32

32

Bonuses FY 2010 – FY 2015Slide33

33

GLC Operating Expenses – Advertising

($ in Thousands)Slide34

34

Advertising costs as % of net sales

Source: 2015 Lafleur’s World AlmanacSlide35

35

GLC Operating Expenses - Marketing

($ in Thousands) 

FY2011 FY2012 FY2013 FY2014FY2015  

Advertising

$21,130

$20,563

$18,796

$19,563

$21,113

Other Gaming

18,874

19,164

19,270

21,133

18,222

TOTAL MARKETING EXPENSE

$40,004

$39,727

$38,066

$40,696

$39,335


Total % of Revenue

1.20%

1.11%

1.05%

1.09%

1.01%

ROI

$21.15

$22.69

$24.36

$23.10

$24.65 Slide36

36

GLC Distribution of Net Revenues

- Traditional LotterySlide37

By gameBy price pointBased on historical trends

Incorporating strategic initiativesNew game launches and matrix changes37

How We Forecast AnnuallySlide38

38

Historical Profit GrowthSlide39

Stabilize and grow draw gamesFocus on quality distribution and inventory optimizationExpand corporate business development, especially non-traditional locations

Deploy mobile sales channelAchieve operational efficiencies

39Our Strategic FocusSlide40

40

GLC Traditional Lottery Projected Profits

($ in Millions)Slide41

41

Coin Operated Amusement Machine (COAM) Origination

HB 487Signed by Governor Deal on April 10, 2013.Transferred COAM responsibilities to the LotteryResponsibilities include:Licensure of owners and operators of Class A and B COAMsClass A- kiddie rides, arcade games, juke boxes, pool tables, claw machinesClass B- line-up, match-up video games with some skill (points carry over)Issuance of decals for COAMsCollection of license and decal fees for COAMsImplementation of a central accounting systemCollection of net proceeds from Class B COAMsCompliance and EnforcementSlide42

42

Recent COAM Legislation

SB 190 - July 1, 2015Provides for licensing of manufacturers and distributorsMandates arbitration for licensee disputesCreates the ability to implement staggered licensing periodsPlaces a cap on Master License Holders at 220 with an auction provisionNo more than 9 Class B COAMs in a locationIncreases late fee for licensing Slide43

43

COAM Update – FY 2014

Established intergovernmental agreements with GBI, DOAA and DORDeveloped and deployed a revenue reporting systemDeveloped licensing criteria with integrity checksCreated online license applicationsInstituted enforceable rules and regulationsMet monthly with the COAM advisory boardWrote and awarded an RFP for the centralized gaming systemStaffed the COAM DivisionImplemented responsible gaming initiatives and doubled the transfer to DBHDD for treatment of problem gambling from $200,000 to $400,000Created an anonymous “tip line” for consumers to report COAM fraud and abuseSlide44

Brought licensing and enforcement activities in-houseProcessed 8,100 Class A and B licensees with integrity

checksTested, certified, and deployed the centralized COAM gaming systemOn-boarded over 20,000 Class B COAMs in approximately 5,000 locations throughout Georgia

Began conducting financial sweeps of retailersSet up a hearing/arbitration systemIncreased compliance, enforcement, and education efforts through partnerships with GBI, local law enforcement, DOAA, DOR, industry associations, and banking regulators44COAM Update – FY 2015Slide45

45

FY 2015 COAM Enforcement

Almost 4,400 compliance inspections were conductedOver 1,300 citations and warnings were issued by GLC Compliance Inspectors- almost $1 million in fines leviedMore than 340 audits of licensees were conductedGBI served 58 search warrants, made 36 arrests, and seized currency, bank accounts, businesses, and property48 retailers were suspended due to illegal activities and/or non-complianceSlide46

46

Georgia Lottery Corporation

P&L Statements FY2014-2015 (COAM)

FY14FY15COAM REVENUE  


COAM Centralized System

-

0.00%

5,910

38.68%

COAM Licensing Renewals

10,190

99.83%

8,834

57.82%

COAM Fines/Pen/Assmt Fees

-

0.00%

470

3.08%

COAM NSF Fees

-

0.00%

26

0.17%

COAM Other Revenue

-

0.00%

0

0.00%

COAM CC Renewal Processing Fee

-

0.00%

9

0.06%

COAM ACH Renewal Processing Fee

-

0.00%

21

0.14%

Interest Income

17

0.17%

8

0.05%

COAM Revenue

10,207

100.00%

15,278

100.00%

COAM EXPENSES


Personnel Costs

1,301

12.75%

1,809

11.84%Operating Expenses 666

6.52%

1,258

8.23%

COAM Operating Expenses

1,967

19.27%

3,067

21.45%

DOR MOU Expenses

480

4.70%

27

0.18%

DOAA MOU Expenses

380

3.72%

407

2.67%

Investigations and Enforcement

472

4.62%

1,295

8.48%

Other COAM Operating Expenses

1,333

13.06%

1,729

11.32%

Total Operating Expenses

3,299

32.32%

4,797

32.77%

Gaming Expenses


Intralot Vendor Fees

-

0.00%

1,469

9.62%

Total COAM Expenses

3,299

32.32%

6,266

42.38%

Gross Proceeds for Education

6,908

67.68%

9,012

57.62%

Distribution of Retained Earnings

-

0.00%

1,908

1.37%

Net Proceeds For Education

6,908

67.68%

10,920

58.99%

Proceeds Held as Retained Earnings

1,908

-

Net Transfer for Education

5,000

10,920

($ in Thousands)Slide47

47

COAM Projected Profits

($ in Thousands)Slide48

48

Consolidated Projected Profits

($ in Thousands)Slide49

49

Our Mission

To maximize revenues for HOPE and Pre-K.

Our Vision

To be

recognized globally as a top performer and innovative leader in the lottery industry and a trusted and valued partner for the state.

Our Motto

We do it for Georgia’s kids

!