/
NEWS/WASHINGTON POST POLL: NEWS/WASHINGTON POST POLL:

NEWS/WASHINGTON POST POLL: - PDF document

lindy-dunigan
lindy-dunigan . @lindy-dunigan
Follow
405 views
Uploaded On 2016-07-11

NEWS/WASHINGTON POST POLL: - PPT Presentation

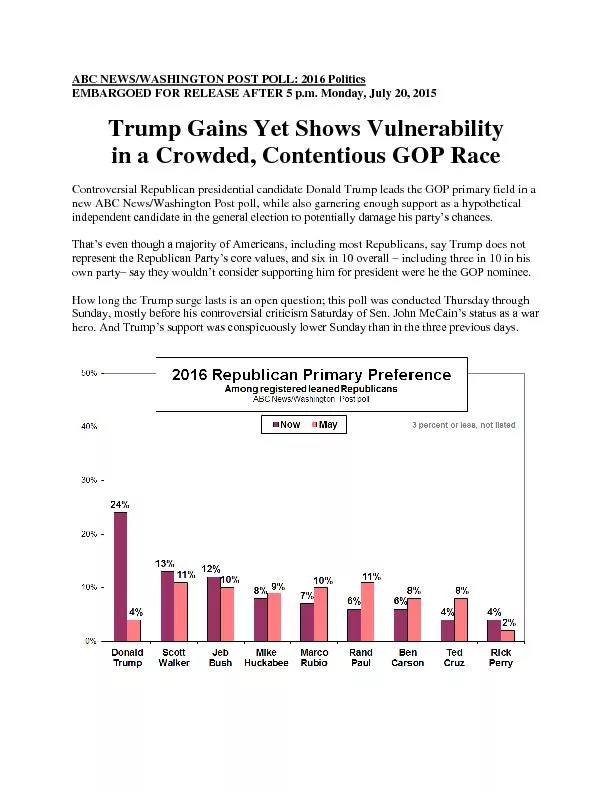
ABC 2016 Politics E MBARGOED FOR RELEASE AFTER 5 p m Monday Ju ly 20 2015 Trump Gains Yet Shows Vulnerability in a Crowded Contentious GOP Race Controversial Republican presidential cand ID: 399506

ABC 2016 Politics E MBARGOED FOR RELEASE

Share:

Link:

Embed:

Download Presentation from below link

Download Pdf The PPT/PDF document "NEWS/WASHINGTON POST POLL:" is the property of its rightful owner. Permission is granted to download and print the materials on this web site for personal, non-commercial use only, and to display it on your personal computer provided you do not modify the materials and that you retain all copyright notices contained in the materials. By downloading content from our website, you accept the terms of this agreement.


Presentation Transcript

ABC NEWS/WASHINGTON POST POLL: 2016 Politics E MBARGOED FOR RELEASE AFTER 5 p .m. Monday , Ju ly 20 , 2015 Trump Gains Yet Shows Vulnerability in a Crowded, Contentious GOP Race Controversial Republican presidential candidate Donald Trump leads the GOP primary field in a new ABC News/Washington Post poll, while also garnering enough support as a hypothetical independent candidate in the general election to potentially damage his party’s chances. That’s even though a majority of Americans , including mos t Republicans , say Trump does not represent the Republican Party’s core values, and six in 10 overall – including three in 10 in his own party – say they wouldn’t consider supporting him for president were he the GOP nominee. How long the Trump surge last s is an open question; this poll was conducted Thursday through Sunday, mostly before his controversial criticism Saturday of Sen. John McCain’s status as a war hero. And Trump’s support was conspicuously lower Sunday than in the three previous days. 2 Trump’s frontrunner status , moreover, reflects the crowded GOP race. He leads the 16 - candidate field with 24 percent support among Republicans and Republican - leaning independents who are registered to vote, up sharply from 4 percent in May. While enough fo r a lead, that also means 76 percent prefer someone else, or none of them. Scott Walker has 13 percent support, Jeb Bush 12 percent, with the rest in single digits. Trump’s support was 28 percent in this survey’s first three nights of polling. While th e sample size of registered leaned Republicans on Sunday is quite small, he dropped to the single digits that day. His improvement overall, compared with an ABC/Post poll in May, occurred largely across the board. Support for Rand Paul dropped by 5 percen tage points, for Ted Cruz by 4 and for several other candidates by generally non - significant 1 - to 3 - point margins. Among groups, Trump’s advanced since May by 7 points among college graduates, but just to 8 percent, underscoring his weakness in this gro up . But – at least until Sunday – his gains otherwise were broad , up, for example, by 16 points among Republicans, 23 points among GOP - leaning independents and 20 points among moderates and conservatives alike. He’s at least numerically ahead, as a result , across many key groups . Trump Walker B ush Huck abee Rubio Paul Carson All 24% 13 12 8 7 6 6 Republicans 22 16 13 11 6 2 4 Independents 25 10 9 3 7 9 9 Moderates 25 6 13 9 6 9 3 Smwt cons. 24 12 16 4 12 1 9 Very cons. 17 25 6 15 4 7 7 Evangelical white Prot. 20 14 11 12 7 4 4 Men 25 10 16 8 6 7 6 Women 23 16 8 9 7 4 6 HS or less 31 14 13 11 5 3 3 Some college 32 13 7 7 7 6 4 Coll. grads 8 12 15 8 9 8 11 NATIVISTS – There’s a nativist elem ent to Trump’s support: He’s backed by 3 8 percent of Republicans and GOP - leaning independents who feel that immigrants, overall, mainly weaken U.S. society. That drops to 12 percent among those who say immigrants strengthen this country. Another, related result underscores a disconnect for Trump with the public overall, one that may pose a challenge for him in the future. Seventy - four percent of Americans see undocumented immigrants from Mexico as “mainly honest people trying to get ahead” as opposed to “mainly 3 undesirable people like criminals.” Trump, again controversially, has said such immigrants include drug dealers and rapists, while “some, I assume, are good people.” The question of core values is a potentially difficult one for Tru mp. Republicans and Republican - leaning independents by a 2 4 - point margin, 56 - 3 2 percent, say his views do not reflect the core values of the Republican Party (leaned Democrats agree, by a similar 61 - 32 percent). And 31 percent of Republicans say they would n’t consider voting for Trump were he the party’s nominee – a large group to lose on his own side . (Just 1 1 percent of Democrats, by contrast, rule out supporting Hillary Clinton.) GENERAL – In a general election trial heat, Clinton leads Bush, the GOP fundraising leader , by a slight 50 - 44 percent among registered voters. But with Trump as an independent candidate that goes to 46 - 30 - 20 percent, Clinton - Bush - Trump – with Trump drawing support disproportionately from Bush, turning a 6 - point Clinton advant age into 16 points. Trump’s su pport in this three - way matchup was 21 percent from Thursday to Saturday, vs. 13 percent in Sunday interviews. These are early days, of course; leaders came and went like flashcards in the 2012 Republican primary contest, and, as noted, potential fallout from Trump’s comments on McCain – or his next pronouncements – remains to be seen. But the results underscore th e GOP’s conundrum in 4 responding to Trump, a billionaire businessman and television celebrity who hasn’t ruled out an independent run for the presidency. Am ong other results in this poll, produced for ABC by Langer Research Associates : THE DEMS – Clinton retains very broad backing for the Democratic nomination, 63 percent, vs. 14 percent for Bernie Sanders and 12 percent for Joe Biden. With Biden out (he hasn’t announced a candidacy), most of his support go es to Clinton, boosting her to 68 percent. That said, Clinton’s support is less enthusiastic than it might be – 42 percent of her supporters are very enthusiastic about her candidacy. And while 72 percent of leaned Democrats are satisfied with their choi ce of candidates, that compares with 83 percent at this point in 2007. Sixty - nine percent of Democrats and Democratic leaning independents call Clinton “about right” ideologically, as opposed to too liberal or too conservative. That falls to 40 percent f or Sanders – not because he’s seen as too liberal, but because nearly four in 10 don’t know enough about him to say. Also, despite Sanders’ more liberal image, Clinton wins 64 percent support from liberals . She also does 1 9 points better among women than men in support for the nomination, and 1 5 points better among nonwhites than whites. 5 MORE GOP – Republican candidates do less well in their base than Clinton in hers on being seen as “about right” ideologically – 46 percent for Bush, 45 percent for Marco Rubio, 44 percent for Trump, 38 percent for Walker and 35 percent for Ted Cruz. Twenty - two percent call Bush “too liberal” and 17 percent say the same about Trump . Walker, Cruz and Rubio, like Sanders, have high undecided numbers on the question. As s hown in the table above (online readers, see the pdf), Bush is notabl y weak among very conservative leaned Republicans, with just 6 percent support – a persistent difficulty for him. GENERAL – A general election match - up between Clinton and Bush is a bit better for her now (50 - 44 percent, as noted) than in May, 47 - 44 percent. That relies, in part , on a 19 - point advantage for Clinton among moderates. (She has 21 percent support among conservatives; Barack Obama won 17 percent of that group in 2012 ) . Clinton also does 10 points better among women than men (as did Obama) and far better among under - 30s (71 percent support) than their elders, especially seniors (40 percent). And she has 78 percent support among nonwhites vs. Bush, compared with 39 percent of whites – margins again similar to Obama’s in 2012. Bringing Trump into the mix as an independent reduces Bush’s support in his better groups, including Republicans ( - 27 points for Bush with Trump adde d), conservatives ( - 23) and whites ( - 19). Clinton - Bush Clinton - Bush - Trump All 50 - 44% 46 - 30 - 20 Democrats 87 - 11 84 - 10 - 5 Republicans 11 - 84 7 - 57 - 32 Independents 44 - 47 37 - 31 - 26 Liberals 85 - 12 81 - 8 - 10 Moderates 56 - 37 51 - 26 - 19 Cons. NET 21 - 71 18 - 48 - 28 Smwt. cons. 25 - 70 21 - 49 - 29 Very cons. 17 - 73 15 - 50 - 28 Whites 39 - 55 34 - 36 - 26 Nonwhites NET 78 - 15 75 - 14 - 6 Men 44 - 47 41 - 34 - 20 Women 54 - 41 50 - 25 - 20 18 - 29 71 - 25 65 - 17 - 15 65 - plus 40 - 52 36 - 37 - 21 - 35 52 - 24 - 19 $50 - 100K 49 - 46 43 - 31 - 23 $100K - plus 39 - 55 40 - 39 - 20 HS or less 52 - 41 45 - 27 - 25 Some coll/degree 48 - 45 45 - 31 - 19 Post - grad 53 - 43 52 - 32 - 10 6 Another result marks the mood confronting both political parties: Asked which better represents their own values, a substantial 23 percent of Americans volunteer that neither does (of the rest, 3 8 percent pick the Democrats, 31 percent the Republicans). And in a challenging finding for candidates trying to find a lever, the public factures on what attributes matter most to them – a strong leader (24 percent, peaking among Republicans), one who’s honest and trustworthy (also 24 percent), one who shares their values (20 percent) or who understands their problems (17 percen t, peaking among Democrats). Two other items finish lower on the list – having the best experience (10 percent) or the best chance to win (3 percent). AND THE PRES – As to the president (not the chief focus of this survey, clearly), Obama continues to enc ounter difficulties in his popularity overall . W hile 45 percent of Americans approve of his job performance, more, 50 percent, disapprove, essentially unchanged from 45 - 49 percent in May. Despite recent economic gains he manages just an even split on handl ing the economy, also unchanged. Views o f the president remain highly polarized. METHODOLOGY – This ABC News/Washington Post poll was conducted by landline and cellular telephone July 16 - 19 , 2015, in English and Spanish, among a random national sample of 1,002 adults , including 815 registered voters . Results have a margin of sampling error of 3.5 points for the full sample, and 4.0 for registered voters, including design effect. Part isan divisions are 30 - 21 - 39 percent , Democrats - Republicans - independents. Interviews were conducted Sunday among 200 respondents overall, including 82 Republicans a nd Republican - leaning independents and 65 leaned Republicans who reported being registered to vote. ABC customarily reports results for groups at or near 100 respondents, but may make characterizations of results in smaller groups. Sunday results on Trump support characterized in this analysis were essentially identical regardless of registratio n. The survey was produced for ABC News by Langer Research Associates of New York, N.Y., with sampling, data collection and tabulation by Abt - SRBI of New York, N.Y. Analysis by Gary Langer . ABC News polls can b e found at ABCNEWS.com at http://abcnews.com/pollingunit . Media contacts: Van Scott , ( 212 ) 456 - 7243 , or Julie Townsend , (212) 456 - 4934 . Full results follow. * in data columns = less than 0.5 percent 2b, 26 - 27 previously released; 3, 17 - 24 held for release. 1. Do you approve or disapprove of the way Barack Obama is handling his job as president? Do you approve/disapprove strongly or somewhat? -------- Approve -------- ------- Disapprove ----- - No NET Strongly Somewhat NET Somewhat Strongly opinion 7/19/15 45 26 20 50 13 37 5 5/31/15 45 22 23 49 11 38 6 7 3/29/15 47 26 21 47 11 36 6 1/15/15 50 24 26 44 9 35 6 12/14/14 41 21 20 54 13 41 5 10/26/14 43 21 22 51 12 39 6 10/12/14 40 20 20 51 12 39 8 9/7/14 42 24 18 51 12 39 6 6/1/14 46 23 23 51 14 37 3 4/27/1 4 41 23 19 52 12 40 6 3/2/14 46 25 22 50 12 38 3 1/23/14 46 23 23 50 9 41 4 12/15/13 43 23 20 55 14 41 3 11/17/13 42 22 21 55 11 44 3 10/20/13 48 28 20 49 10 39 3 9/15/13 47 25 22 47 11 37 6 7/21/13 49 25 24 44 12 32 7 5/19/13 51 32 20 44 10 33 5 4/14/13 50 27 23 45 10 35 5 3/10/13 50 2 9 21 46 11 36 4 1/13/13 55 32 23 41 8 33 4 12/16/12 54 33 21 42 9 32 5 11/4/12 RV 52 33 10 46 10 36 2 11/3/12 RV 51 33 10 47 10 37 2 11/2/12 RV 51 32 11 47 11 36 2 11/1/12 RV 50 31 11 48 11 37 2 10/31/12 RV 50 30 11 48 11 37 2 10/30/12 RV 50 28 12 48 12 37 2 10/29/12 RV 50 28 11 48 11 36 2 10/28/12 RV 51 28 11 46 11 36 3 10/27/12 RV 50 28 11 46 11 36 3 10/26/12 RV 51 29 10 46 10 36 3 10/25/12 RV 50 29 9 47 9 37 3 10/24/12 RV 50 29 10 48 10 38 3 10/23/12 RV 50 29 21 47 9 37 3 10/22/12 RV 50 30 20 47 10 38 3 10/21/12 RV 51 31 20 47 10 37 2 10/13/12 50 30 21 44 10 34 6 9/29/12 50 26 24 46 12 34 4 9/9/12 49 29 20 45 11 35 6 8/25/12 50 27 23 46 13 33 4 7/8/12 47 24 24 49 15 34 4 5/20/12 47 26 21 49 13 36 3 4/8/12 50 30 20 45 10 35 6 3/10/12 46 28 18 50 11 39 4 2/4/12 50 29 22 46 11 36 3 1/15/12 48 25 23 48 11 37 4 12/18/11 49 25 24 47 13 34 4 11/3/11 44 22 22 53 15 37 3 10/2/11 42 21 21 54 14 40 4 9/1 /11 43 21 22 53 16 38 3 8/9/11* 44 18 26 46 9 37 10 7/17/11 47 25 22 48 14 35 5 6/5/11 47 27 20 49 13 37 4 5/2/11** 56 29 27 38 14 24 6 4/17/11 47 27 21 50 12 37 3 3/13/11 51 27 24 45 12 33 4 1/16/11 54 30 23 43 15 28 3 12/12/10 49 24 25 47 15 32 4 10/28/10 50 27 23 45 11 34 5 10/3/10 50 26 24 47 13 34 3 9/2/10 46 24 22 52 14 38 3 7/11/10 50 28 22 47 12 35 3 6/6/10 52 30 22 45 1 2 33 4 4/25/10 54 31 23 44 11 33 3 8 3/26/10 53 34 20 43 8 35 3 2/8/10 51 29 22 46 12 33 3 1/15/10 53 30 24 44 13 32 2 12/13/09 50 31 18 46 13 33 4 11/15/09 56 32 23 42 13 29 2 10/18/09 57 33 23 40 11 29 3 9/12/09 54 35 19 43 12 31 3 8/17/09 57 35 21 40 11 29 3 7/18/09 59 38 22 37 9 28 4 6/21/09 65 36 29 31 10 22 4 4/24/09 69 42 27 26 8 18 4 3/29/09 66 40 26 29 9 20 5 2/22/09 68 43 25 25 8 17 7 *Washington Post **Washington Post/Pew Research Center 2 a . Do you approve or disapprove of the way Obama is handling the economy ? Do you approve/disapprove strongly or somewhat? -------- App rove -------- ------- Disapprove ------ No NET Strongly Somewhat NET Somewhat Strongly opinion 7/19/15 47 25 22 48 13 35 5 5/31/15 47 25 23 48 14 34 4 3/29/15 49 29 20 46 12 34 5 1/15/15 48 26 21 48 10 38 5 12/14/14 44 24 20 52 14 38 4 10/26/14 42 21 20 52 14 38 7 10/12/14 44 25 19 51 12 39 4 9/7/14 42 22 19 54 15 39 5 6/1/14 43 21 21 53 15 38 4 4/27/14 42 20 21 54 13 41 4 3/2/14 43 23 20 54 14 41 2 1/23/14 43 22 21 55 13 42 3 12/15/13 42 24 18 55 14 40 4 11/17/13 41 22 20 57 14 42 2 10/20/13 44 23 20 54 12 42 2 9/15/13 45 25 20 51 14 37 4 7/21/13 45 22 22 49 14 35 6 5/19/13 48 26 22 48 10 37 4 4/14/13 44 22 22 53 12 41 3 3/10/13 44 24 20 52 10 42 4 1/13/13 50 24 25 47 10 37 3 12/16/12 50 27 23 48 10 38 3 10/13/12 RV 4 7 26 21 51 10 41 2 9/29/12 RV 47 23 25 52 10 41 1 9/9/12 RV 45 24 21 53 8 45 2 8/25/12 44 20 23 54 12 42 3 7/8/12 44 21 23 54 13 41 2 5/20/12 42 20 22 55 11 44 2 4/8/12 44 23 21 54 12 42 2 3/ 10/12 38 20 18 59 9 50 2 2/4/12 44 23 22 53 11 41 3 1/15/12 41 19 22 57 11 46 2 12/18/11 41 17 24 56 13 43 2 11/3/11 38 18 20 61 13 48 2 10/2/11 35 17 19 61 13 48 4 9/1/11 36 15 21 62 15 47 2 7/17/11 39 18 22 57 15 43 3 6/5/11 40 20 20 59 10 49 2 5/2/11* 40 18 22 55 16 39 4 4/17/11 42 23 19 57 11 46 2 3/13/11 43 22 21 55 13 41 2 9 1/16/11 46 22 24 51 13 38 2 12/12/10 43 21 22 54 15 39 3 10/28/10 RV 44 21 23 54 15 39 3 10/3/10 45 22 23 53 13 41 2 9/2/10 41 20 21 57 13 44 2 7/11/10 43 20 23 54 13 41 4 6/6/10 50 26 24 49 12 37 2 4/25/10 49 24 25 49 10 39 2 3/26/10 45 23 22 52 12 40 3 2/8/10 45 22 23 53 15 38 2 1/15/10 47 22 24 52 13 39 1 12/13/09 46 23 24 52 12 40 2 11/15/09 51 26 25 47 12 36 2 10/18/09 50 29 22 48 13 35 1 9/12/09 51 28 24 46 13 33 2 8/17/09 52 27 25 46 13 33 2 7/18/09 52 29 23 46 10 35 3 6/21/09 56 28 28 41 13 27 3 4/24/09 58 31 28 38 13 25 4 3/29/09 60 34 25 38 12 26 3 2/22/09 60 NA NA 34 NA NA 6 *Washington Post/Pew Research Center 4. Which political party, the (Democrats) or the (Republicans), do you think better represents your own personal values? Both Neither No Democrats Republicans (vol.) (vol.) opinion 7/19/15 38 31 3 23 5 10/12/14 44 36 3 10 7 9/7/14 45 40 2 10 3 1/23/14 43 41 2 13 2 3/10/12 44 39 2 12 3 10/28/10 RV 48 42 2 7 1 9/2/10 45 42 2 10 1 11/15/09 49 39 2 9 2 11/4/06 RV 48 44 1 6 2 10/8/06 53 37 2 7 1 11/2/05 50 40 1 7 1 4/24/05 47 38 2 10 2 3/14/99 47 39 3 8 3 5. (ASKED OF LEANED REPUBLICANS) I'm going to read a list of possible candidates for the Republican nomination for president in 2016. If the 2016 Republican presidential primary or caucus in your state were being held today, for whom would y ou vote? Which candidate would you lean toward? 7/19/15 - NET LEANED VOTE PREFERENCE ------------------------ Among gen pop ------------------------ 7/19/15 5/31/15 3/29/15 12/14/14 10/12/14 4/27/14 1/23/14 Jeb Bush 13 13 20 15 15 14 18 Ben Carson 6 7 7 7 6 NA NA Chris Christie 4 5 6 8 7 10 13 Ted Cruz 4 7 13 8 4 6 12 Carly Fiorina * 2 1 NA NA NA NA Lindsey Graham * 1 1 NA NA NA NA Mike H uckabee 7 9 8 6 11 13 NA Bobby Jindal 2 1 1 3 2 1 NA John Kasich 2 3 1 2 2 2 NA George Pat aki 2 1 NA NA NA NA NA 10 Rand Paul 6 11 9 11 12 14 11 Rick Perry 3 2 2 5 6 6 NA Marco Rubio 9 9 7 6 8 7 10 Rick Santorum 1 3 2 3 3 NA NA Donald Trump 23 5 NA NA NA NA NA Scott Walker 11 11 12 6 1 5 NA Paul Ryan N A NA NA 11 8 11 20 Other (vol.) 1 * 1 * 1 1 2 None of these (vol.) 5 1 3 2 3 4 4 Would not vote (vol.) 1 1 1 * 1 * 1 No opinion 2 6 4 7 10 5 9 -- ----------------------- Among RVs --------------------------- 7/19/15 5/31/15 3/29/15 12/14/14 10/12/14 4/27/14 1/23/14 Jeb Bush 12 10 21 14 13 12 18 Ben Carson 6 8 6 8 7 NA NA Chris Christie 3 6 7 7 8 9 14 Ted Cruz 4 8 12 8 4 7 12 Carly Fiorina * 2 1 NA NA NA NA Lindsey Graham * 1 1 NA NA NA NA Mike Huckabee 8 9 8 7 12 14 NA Bobby J indal 2 * 1 3 2 2 NA John Kasich 2 3 1 2 2 1 NA George Pataki 1 1 NA NA NA NA NA Rand Paul 6 11 8 10 12 15 11 Rick Perry 4 2 1 5 6 5 NA Marco Rubio 7 10 8 7 8 6 10 Rick Santorum 1 4 2 3 4 NA NA Donald Trump 24 4 NA NA NA NA NA Scott Walker 13 11 13 7 2 5 NA Paul Ryan NA NA NA 11 9 12 18 Other (vol.) * * 1 * 1 2 2 None of these (vol.) 4 2 3 2 3 4 4 Would not vote (vol.) 1 1 1 * 0 * 1 No opinion 2 5 4 6 9 5 9 6. (ASKED OF LEANED DEMOCRATS) I'm going to read a list of possible candidates for the Democratic nomination for president in 2016. If the 2016 Democratic presidential primary or caucus in your state were being held today, for whom would you vote? Which candidate would you lean toward? 7/19/15 - NET LEANED VOTE PREFERENCE ----------------------- Amon g Gen pop ------------------------ 7/19/15 5/31/15 3/29/15 12/14/14 10/12/14 6/1/14 1/23/14 Joe Biden 14 14 11 14 13 12 12 Lincoln Chafee 1 1 NA NA NA NA NA Hillary Clinton 62 63 66 63 65 66 73 Martin O'Malley 1 2 1 1 1 1 NA Bernie Sanders 14 9 4 4 1 2 NA Elizabeth Warren NA NA 11 11 10 7 8 Jim Webb 2 2 2 3 3 2 NA Andrew Cuomo NA NA NA NA NA 2 NA Brian Schweitzer NA NA NA NA NA 1 NA Other (vol.) 2 2 * * 0 0 1 None of these (vol.) 2 3 1 1 2 2 2 Wo uld not vote (vol.) 1 1 1 1 * * * No opinion 2 2 3 2 5 4 3 ------------------------- Among RVs -------------------------- 7/19/15 5/31/15 3/29/15 12/14/14 10/12/14 6/1/14 1/23/14 Joe Biden 12 14 12 14 13 12 11 11 Lincoln Chafee * 1 NA NA NA NA NA Hillary Clinton 63 62 66 61 64 69 73 Martin O'Malley 1 3 * * 1 2 NA Bernie Sanders 14 10 5 4 1 2 NA Elizabeth Warren N A NA 12 13 11 7 9 Jim Webb 2 1 1 3 2 1 NA Andrew Cuomo NA NA NA NA NA 2 NA Brian Schweitzer NA NA NA NA NA 1 NA Other (vol.) 2 2 * * 0 0 * None of these (vol.) 3 4 2 1 3 2 3 Would not vote (vol.) 1 1 1 1 0 0 * No opinion 2 1 2 2 5 2 4 7. (ASKED OF LEANED BIDEN SUPPORTERS) Who would your second choice be? Which candidate would you lean toward as your second choice? 7/19/15 – NET LEANED VOTE PREFERENCE All Among RVs Lincoln Chafee 1 1 Hillary Clinton 69 68 Martin O'Malley 2 2 Bernie Sanders 15 16 Jim Webb 4 5 Other (vol.) 2 2 None of these (vol.) 3 3 Would not vote (vol.) 1 1 No opinion 3 3 8. (ASKED OF LEANED CLINTON SUPPORTERS) Would you say you are very enthusias tic about supporting Clinton, somewhat enthusiastic, not so enthusiastic, or not enthusiastic at all? --- Enthusiastic ---- --- Not enthusiastic ---- No NET Very Somewhat NET Not so Not at all opinion 7/19/15 89 39 50 11 7 4 0 3/29/15 83 42 42 16 12 5 * 9. (ASKED OF LEANED DEMOCRATS/REPUBLICANS) Overall, how satisfied or dissatisfied are you with the choice of candidates for the [Democra tic/Republican] nomination for president this year – are you very satisfied, somewhat satisfied, somewhat dissatisfied or very dissatisfied? ----- Satisfied ----- --- Dissatisfied ---- No NET Very Somewhat NET Somewhat Very opinion 7/19/15 70 21 48 28 19 9 3 NET LEANED DEMOCRAT ----- Satisfied ----- --- Dissatisfied ---- No NET Very Somewhat NET Somewhat Very opinion 7/19/15 72 24 48 26 17 9 2 11/1/07 81 30 51 18 14 4 1 9/7/07 78 28 50 21 17 4 2 7/21/07 83 33 50 16 14 2 1 6/1/07 79 26 53 18 15 4 2 4/15/07 80 29 51 18 14 3 2 2/25/07 86 29 57 12 9 3 2 10/29/03 68 9 58 28 21 8 4 12 9/13/03 64 8 56 34 27 7 2 1/16/00 69 14 56 28 21 7 2 *10/29/03 and previous: "candidates in the Democratic primary" NET LEANED REPUBLICAN ----- Satisfied ----- --- Dissatisfied ---- No NET Very Somewhat NET Somewhat Very opinion 7/19/15 67 18 49 30 21 8 3 1/15/12 61 9 52 36 23 12 3 12/18/11 59 11 48 37 27 10 4 11/3/11 59 9 50 36 27 9 5 10/2/11 62 9 54 32 25 7 6 9/1/11 65 15 51 29 21 8 6 7/17/11 54 8 46 38 29 10 8 6/5/11 47 7 40 46 38 9 7 4/17/11 43 5 38 40 30 10 17 11/1/07 69 16 54 28 22 7 2 9/7/07 68 19 49 26 21 6 5 7/21/07 65 13 53 32 26 6 3 6/1/07 68 11 56 28 22 6 4 4/15/07 65 16 49 31 27 5 3 2/25/07 73 14 58 24 20 5 3 10. (ASKED OF LEANED DEMOCRATS) Do you think [ITEM]’s views on most issues are too (liberal) for you, too (conservative) for you, or just about right? 7/19/15 - Summary Table Too Too About No liberal conservative right opinion a. Hillary Clinton 10 14 69 7 b. Bernie Sanders 13 9 40 38 Trend: a. Hillary Clinton Too Too About No liberal conservative right opinion 7/19/15 10 14 69 7 9/30/07 9 9 78 4 5/15/06 13 5 77 6 b. No trend. 11. (ASKED OF LEANED REPUBLICANS) Do you think [ITEM]’s views on most issues are too (liberal) for you, too (conservative) for you, or just about right? 7/19/15 - Summary Table Too Too About No liberal conservative right opinion a. Jeb Bush 22 14 46 19 b. Donald Trump 17 16 44 23 c. Ted Cruz 10 18 35 36 d. Scott Walker 8 11 38 43 e. Marco Rubio 12 10 45 33 13 12. Do you think Donald Trump’s views reflect the core values of the Republican Party, or not? Yes No No opinion 7/19/15 29 56 14 13. If [ITEM] wins the [Democratic/Republican] nomination for president would you definitely vote for him/her in the general election for president in 2016, would you consider votin g for him/her or would you definitely not vote for him/her? 7/19/15 - Summary Table Definitely Would Definitely No would consider would not opinion a. Donald Trump 14 20 62 4 b. Jeb Bush 15 34 44 7 c. Hillary Clinton 29 27 43 2 d. Bernie Sanders 10 29 41 21 Trend where available: d. Hillary Clinton Definit ely Would Definitely No would consider would not opinion 7/19/15 29 27 43 2 3/2/14* 25 41 32 2 9/30/07 30 28 41 1 4/15/07 27 26 45 1 5/15/06* 19 38 42 1 *“If Hillary Clinton runs for president...” 14. (ASKED OF LEANED DEMOCRATS/REPUBLICANS) Thinking about the [Democratic/Republican] nominee for president i n 2016, which of the following is most important to you: Someone who (shares your values), (understands the problems of people like you), (is a strong leader), (is honest and trustworthy), (has the best experience), or (has the best chance of winning) Shares Understands Strong Honest and Best Best No values problems leader trustworthy experience chance op. 7/19/15 20 17 24 24 10 3 1 15. If the 2016 presidential election were being held today and the candidates were (Hillary Clinton, the Democrat) and (Jeb Bush, the Republican), for whom would you vote? Would you lean toward (Clinton) or toward (Bush)? NET LEANED VOTE PREFERENCE - GEN POP Hillary Jeb Other Neither Would not No Clinton Bush (vol.) (vol.) vote (vol.) opinion 7/19/15 51 41 1 2 3 2 5/31/15 49 41 1 3 5 1 3/29/15 54 40 * 2 2 2 1/15/15 55 39 * 2 2 2 NET LEANED VOTE PREFERENCE – RVs Hillary Jeb Other Neither Would not No Clinton Bush (vol.) (vol.) vote (vol.) opinion 7/19/15 50 44 1 3 2 1 14 5/31/15 47 44 1 3 4 1 3/29/15 53 41 1 1 2 2 1/15/15 54 41 0 2 1 1 4/27/14 53 41 * 4 1 1 16. How about if the candidates were (Hillary Clinton, the Democrat), (Jeb Bush, the Republican), and Donald Trump running as an independent candidate for president - for whom would you vote? Would you lean toward (Clinton), towards (Bush), or toward Trump? Hillary Jeb Donald Oth er None of them Would not No Clinton Bush Trump (vol.) (vol.) vote (vol.) opinion 7/19/15 47 29 19 * 2 1 2 7/19/15 RV 46 30 20 * 1 1 2 25. Do you think undocumented immigrants from Mexico are mainly (undesirable people like criminals) or mainly (honest people trying to get ahead)? Do you feel that way strongly or somewhat? ----- Undesirable ------- -------- Honest --------- No NET Strongly Somewhat NET Somewhat Strongly opinion 7/19/15 16 10 6 74 29 45 10 *** END ***